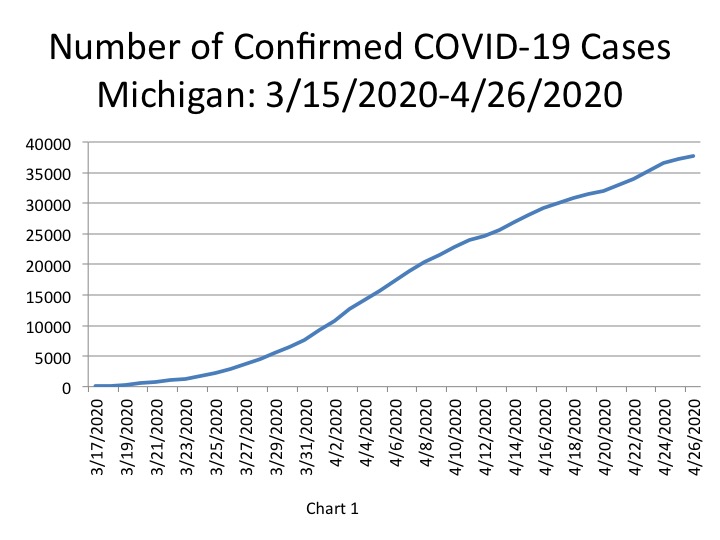
The total number of COVID cases in Michigan increased to 37,778 on April 26 (Chart 1), compared to 37,203 the day before; this was a 575 daily case increase. This was equivalent to 378 cases per 100,000 people (Chart 2) on April 26.
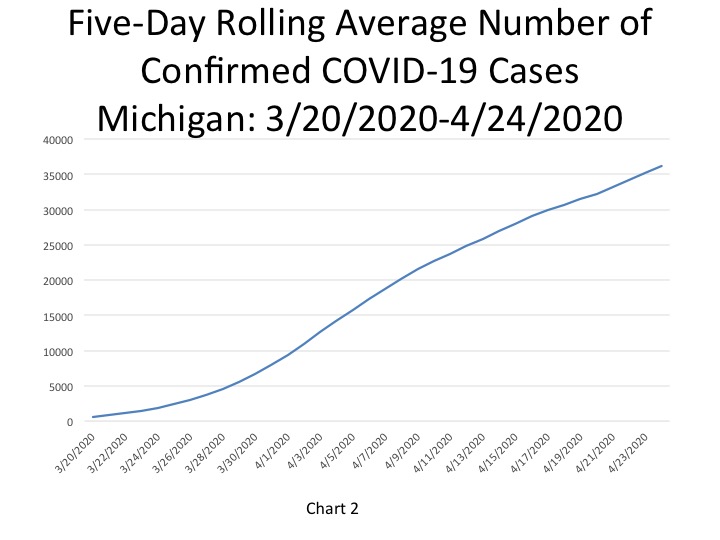
In Chart 2, and subsequent Charts throughout this post (Charts 4, 9, 12, 15), you will also see the five-day rolling averages for the number of confirmed cases and deaths throughout the State and Southeastern Michigan. By using a 5-day simple moving average we are able to smooth out the data, making it less sensitive to changes in testing. This formula helps to adjust for changes or increasing in testing or fluctuations in the quality of reporting or failure to report. Technically, we take information from the two days before and two days after in addition to information from the reported data from each day and sum that information and divide by 5. On April 24, which is the most recent data we have for the 5-day rolling average, the total number of confirmed COVID-19 cases in the Michigan was 36,176.
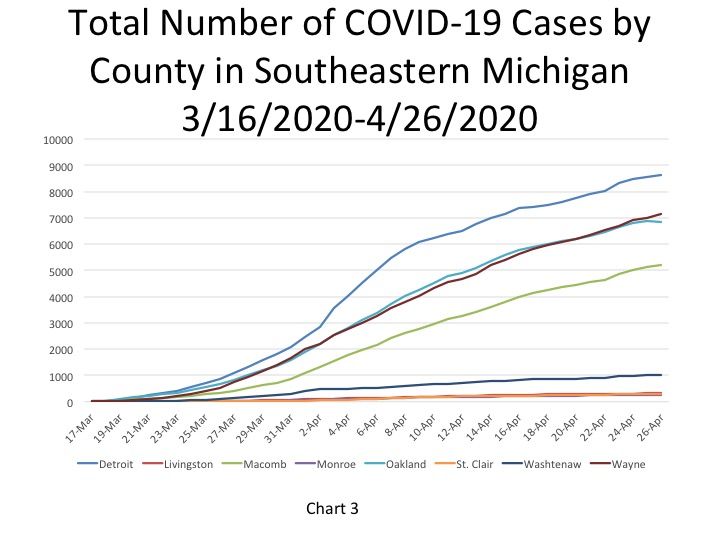
The total number of COVID cases reported to date in the City of Detroit reached 8,613 on April 26. Wayne County (excluding Detroit) had 7,135 cases, Oakland County had 6,928 cases, and Macomb County had 5,203 cases (Chart 3). The number of confirmed cases in Washtenaw, Livingston, Monroe and St. Clair counties combined totaled 1,892, a 50 case increase since Friday.
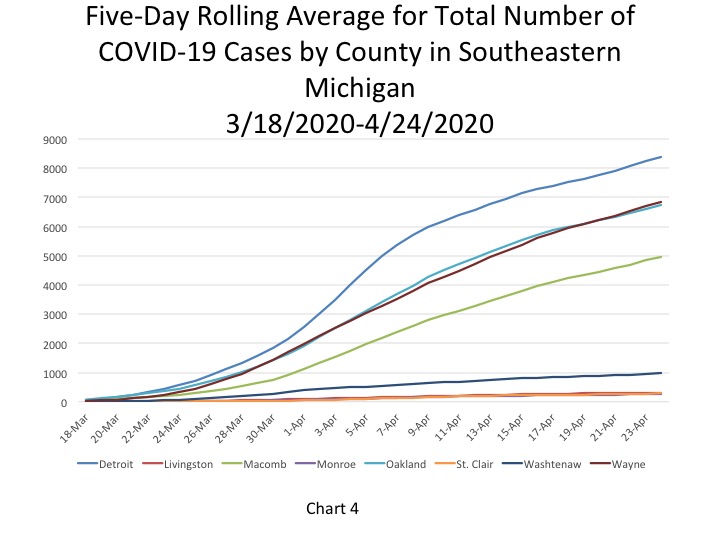
Chart 4 reflects the 5-day rolling averages at the County level and for the City of Detroit. As was shown in Chart 3, Detroit continues to have the highest number of confirmed cases, recorded at 8,395 on April 24. Oakland and Wayne counties follow similar trends in these daily reports. On April 24 Oakland County had 6,742 cases and Wayne County had 6,856 cases.
The daily data highlighted in these posts is from Michigan.gov/coronavirus, where data is updated daily at 3 p.m. Historical data was supplied from covidtracking.com, which republishes COVID data from the State.
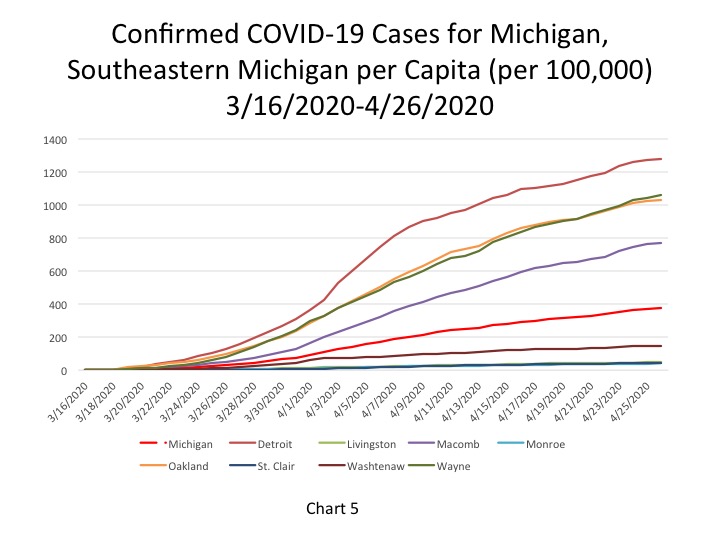
people on April 26, an increase from 1,271 the day before (Chart 5). Wayne County reported 1,061 cases per 100,000 people, and Oakland County’s cases per 100,000 was 1,030. Macomb County had 773 COVID cases per 100,000 people. Wayne County experienced the highest increase at 20 cases per capita between April 25 and April 26. Additionally, this chart shows the number of COVID cases in Michigan per 100,000 people was 378.3. Detroit, Macomb, Oakland and Wayne counties all had higher per capita rates than the State.
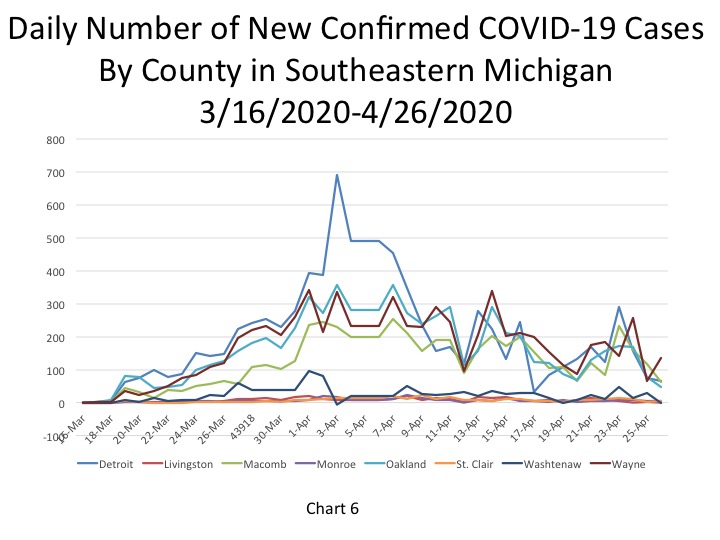
Chart 6 shows that the daily increases in the number of new COVID cases.
Wayne County had the highest increase in the number of new daily COVID cases at 135 on April 26. In fact, Wayne and St. Clair counties were the only two to post COVID increases between April 25 and April 26. St. Clair County had 5 total new COVID cases, which was 2 more than the day before. Detroit had 65 new cases on April 26, a decrease from the 75 posted the day before. Oakland County reported 47 new COVID cases on April 26 while Macomb County reported 64.
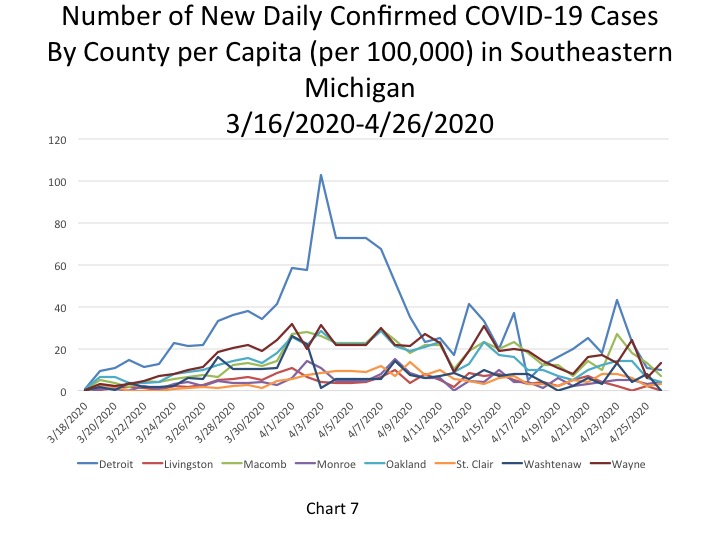
Chart 7 further shows how Wayne County was the only one in the region to exhibit a visible increase in the number of daily confirmed COVID cases. Wayne County reported 13 new COVID cases per 100,000 people while Detroit reported 10, Oakland County reported 4 and Macomb County reported 7.
It was reported by the State of Michigan that on April 26 the total of COVID-19 deaths reached 3,315 (Chart 8). The 3,315 total deaths reported for April 26 was 41 deaths higher than what was reported on April 25 (Chart 10). The 41 new deaths reported on April 26 was the lowest number of new deaths reported in the State since March 29.
Chart 9 is another new chart showing the 5-day rolling average for total COVID deaths in Michigan. On April 24 there were 3,093 deaths.
Of the total number of raw deaths reported, Detroit and Wayne County each had 10 new deaths, Oakland County had 8 and Macomb County had 3 on April 26. The number of new deaths reported on April 26 is significantly lower than the numbers reported on April 25-Detroit alone had 73 new deaths on April 25 and Wayne County had 35 new deaths (Chart 14). The addition of these new daily deaths brings the totals to the following: 922 COVID deaths in Detroit, 520 in Macomb County, 620 in Oakland County, and 658 in Wayne County (Chart 11).
When looking at the 5-day rolling averages for the number of new daily COVID deaths and overall death totals we again see smoother lines, specifically in Chart 15. Using the 5-day rolling average for the number of new daily COVID deaths we see the growth of COVID deaths over time, but it appears each governmental unit is now showing declines in their rolling averages. The number of new daily COVID deaths peaked on April 9 in Oakland County at 26, for Wayne County the peak occurred on April 11 at 34 new deaths and for Macomb County the peak was on April 15 with 31 new deaths. Detroit appeared to peak at 54 cases and dropped to 39. Wayne and Oakland counties reported 22 and 23 new deaths, respectively. Even with a rolling average, the tendency for deaths to drop on weekends because of slower reporting could be a reason for these results.
The cumulative number of COVID fatalities per 100,000 people was 137 for Detroit, 98 for Wayne County, 92 for Oakland County and 77 for Macomb County (Chart 13).
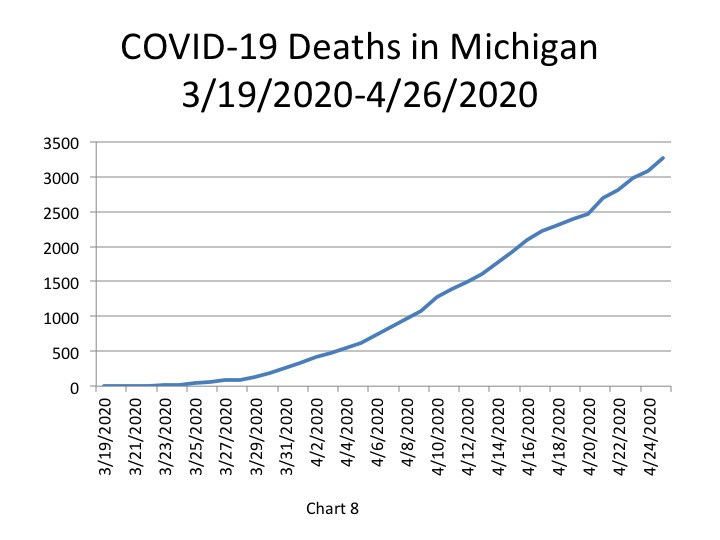
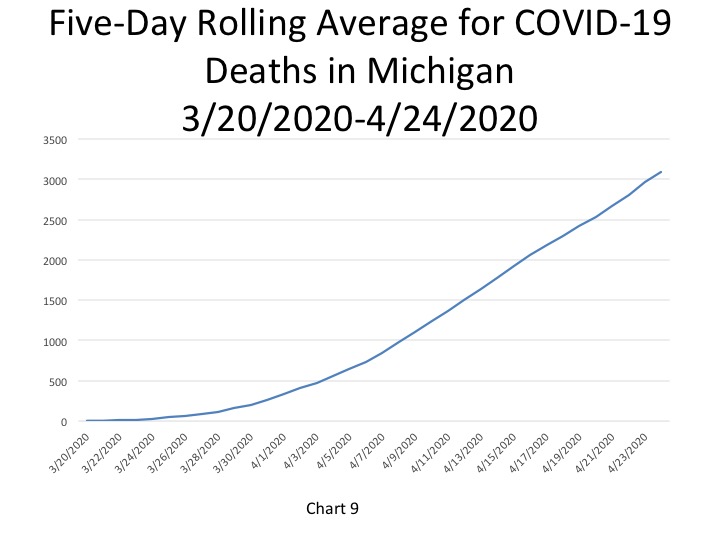
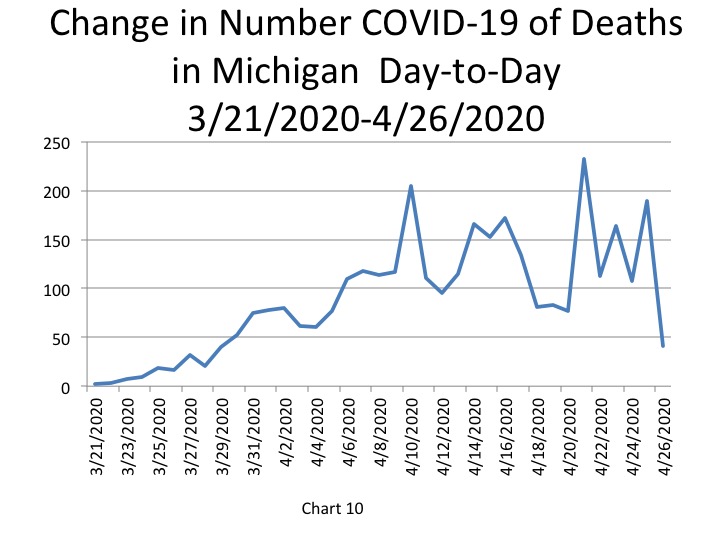
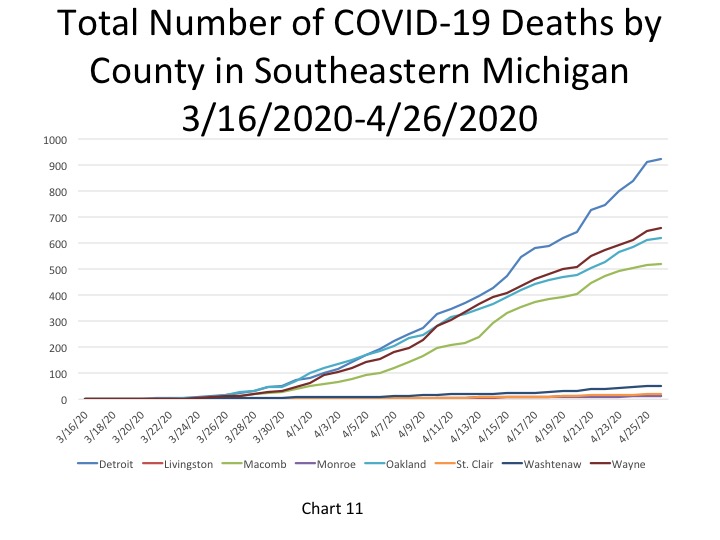
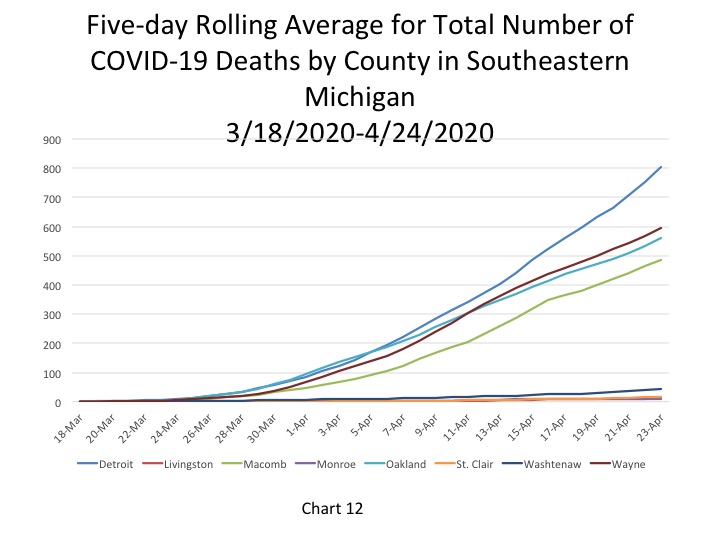
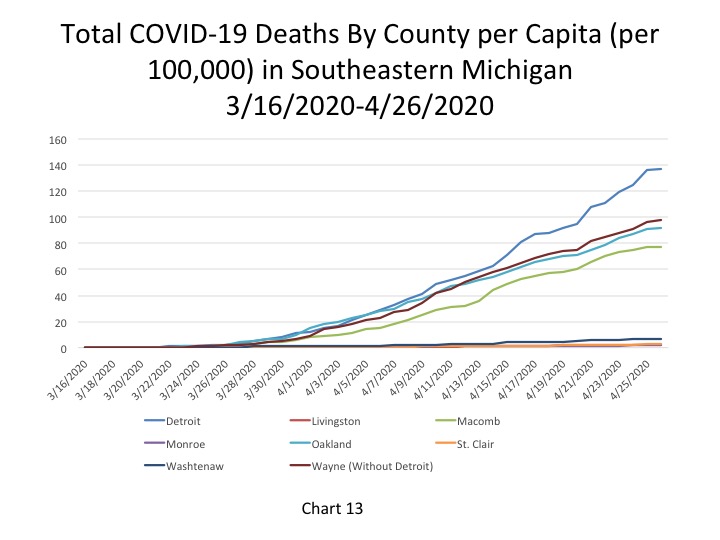
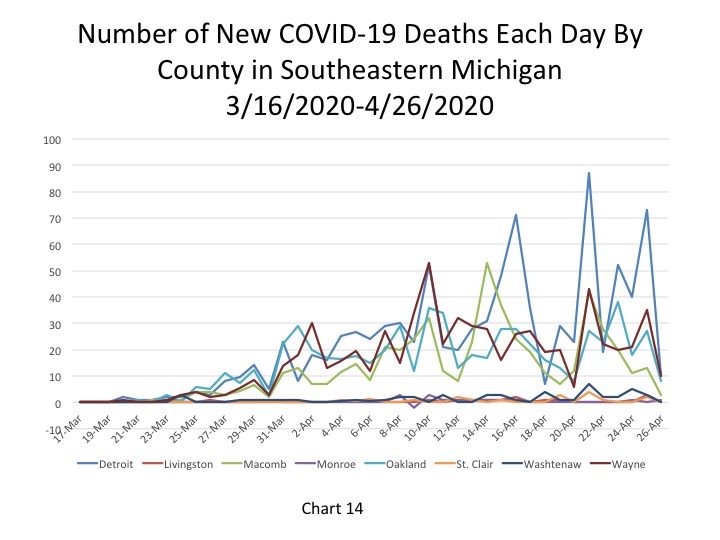
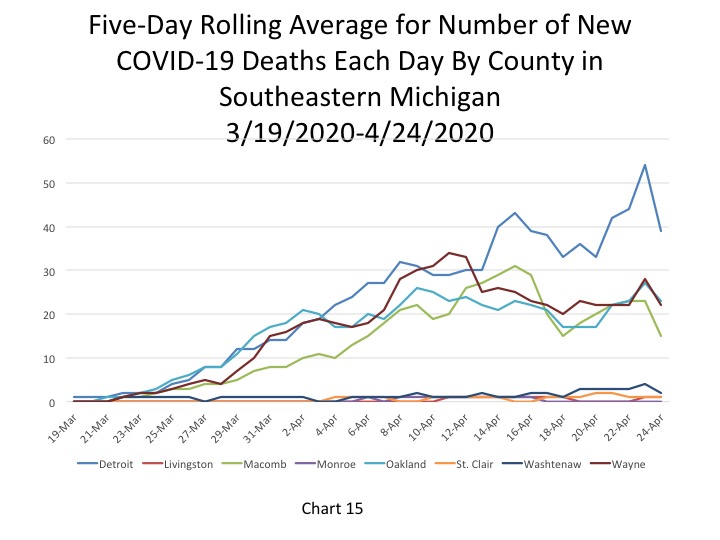
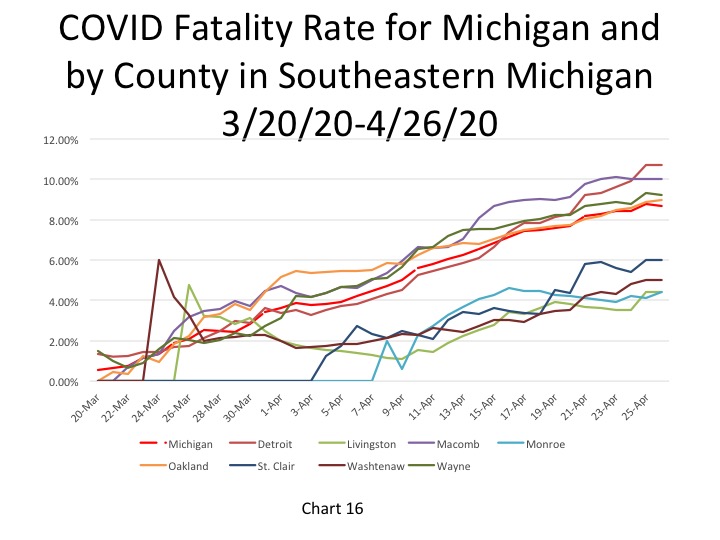
Chart 16 shows that the fatality rate for Michigan slightly decreased to 8.7 percent; it was at 8.8 percent the day prior. The fatality rates for Macomb County, Detroit and Wayne County all remained above the State’s rate (the dotted red line) on April 26. Detroit’s fatality rate became the highest in region at 10.7 percent while Macomb County’s decreased to 10 percent. Oakland and Wayne counties had fatality rates at 9 and 9.2 percent, respectively.
The data has shown possible slowing of the spread of the virus in Michigan has slowed down. However, a Free Press article from April 26 said testing has slowed down in Michigan due to a shortage of supplies, such as swabs and reagents. With a decrease in the number of tests available this will certainly impact the number of cases the state reports.