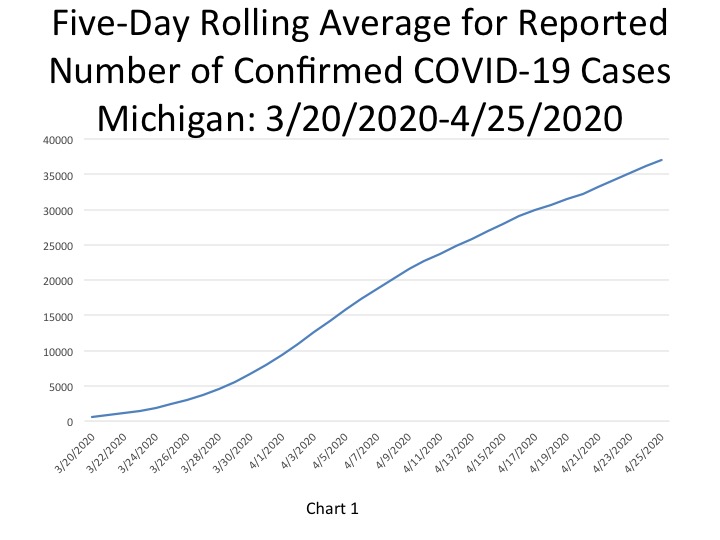
According to the State of Michigan, the total number of COVID cases in Michigan increased to 38,210 on April 27, which was an increase of 432 cases from the previous day. This total was equivalent to 382 cases per 100,000 people (Chart 3) on April 27. The five-day rolling average for the total number of (Chart 1) reflects a smoother curve and adjusts for fluctuations in testing or the quality of reporting or failure to report. The five day rolling average means our daily case and death charts will lag two days behind. The COVID cases increased to 37,025, based on this approach. Even with the smoothing, however, there is no decline.
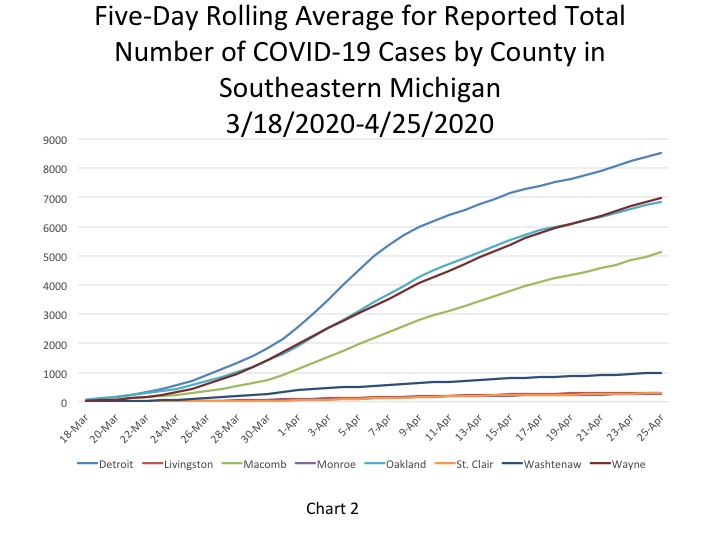
Chart 2 reflects the five-day rolling averages at the County level and for the City of Detroit. As was shown in Chart 2, Detroit continues to have the highest number of confirmed cases, recorded at 8,526 on April 25. The number of cases in Wayne County increased to 6,988 for a five-day rolling average on April 25 while in Oakland County the number of cases increased to 6,832 and in Macomb County it increased to 5,114.
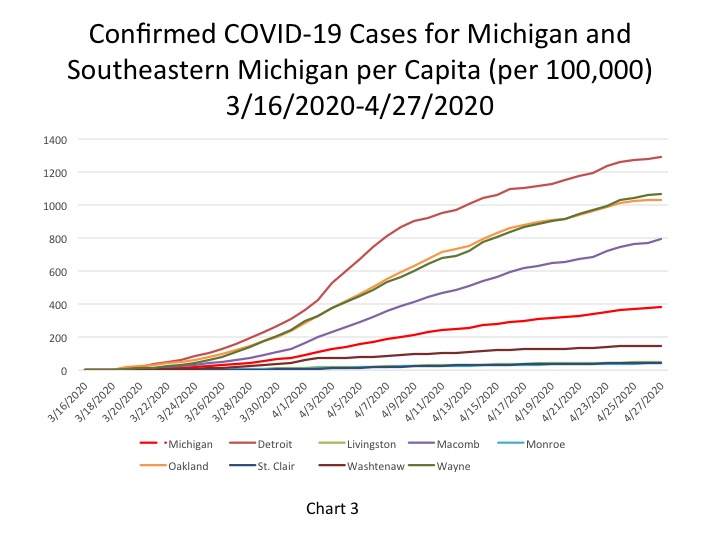
The City of Detroit showed total COVID per capita cases of 1,289 per 100,000 people on April 27, an increase from 1,280 the day before (Chart 3); this represents a reported increase of 66 new cases. Wayne County reported 1,069 cases per 100,000 people, and Macomb County had 795 cases per 100,000. The per capita rate in Oakland County dropped to 1,028 cases per 100,000 people, when it was 1,030 the day prior. This is a result of the State reporting a decrease in the total number of cases between April 26 and 27. This is likely a lapse in reporting reflected in Chart 3, Chart 4 and Chart 5. Macomb County had the highest per capita increase between April 26 and April 27 at 22 new cases per 100,000 people.
The daily data highlighted in these posts is from Michigan.gov/coronavirus, where data is updated daily at 3 p.m. Historical data was supplied from covidtracking.com, which republishes COVID data from the State.
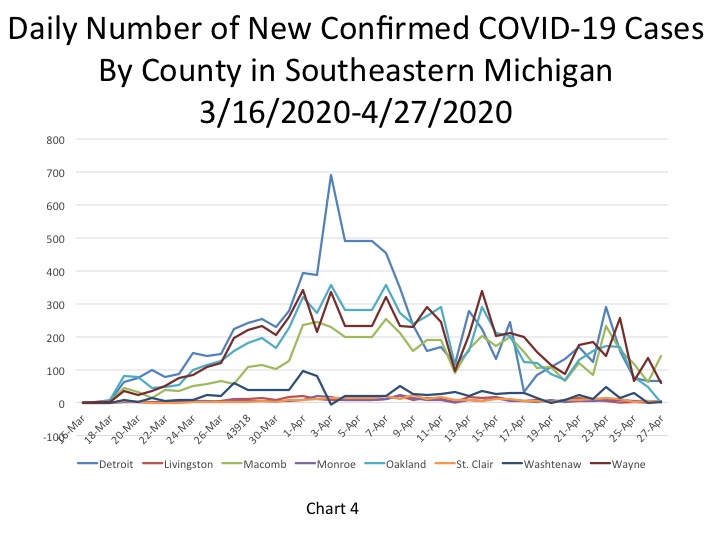
As noted, Chart 4 shows that Oakland County had 0 new cases reported on April 27; this is due to the State reporting a decreased number of cases between April 26 and 27. To reflect this we show no new cases being reported on April 27 for Oakland County. (We’ll be checking on this number.) Macomb County reported the highest number of new COVID cases on April 27 at 142, Detroit reported 66, and Wayne County reported 58.
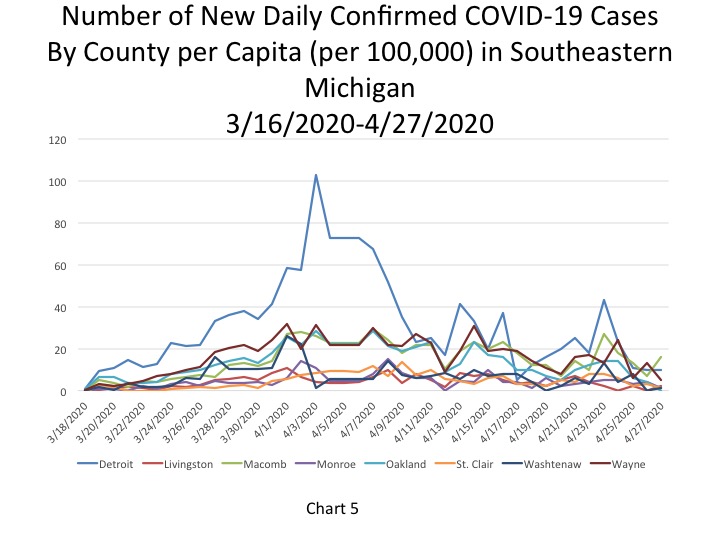
Chart 5 again shows that Macomb County had the highest increase in the number of new COVID cases between April 26 and April 27. On April 27 Macomb County reported 16 new COVID cases per 100,000 people; that County reported 7 new COVID cases per 100,000 on April 26. In Detroit there were 10 new COVID cases per 100,000 people from April 26 to April 27. In Wayne County there were 5 new COVID cases per 100,000 people on April 27 compared to 13 on April 26.
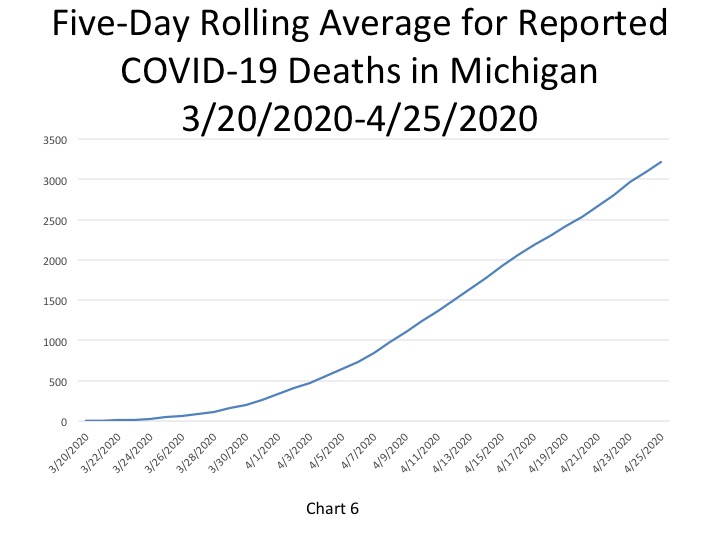
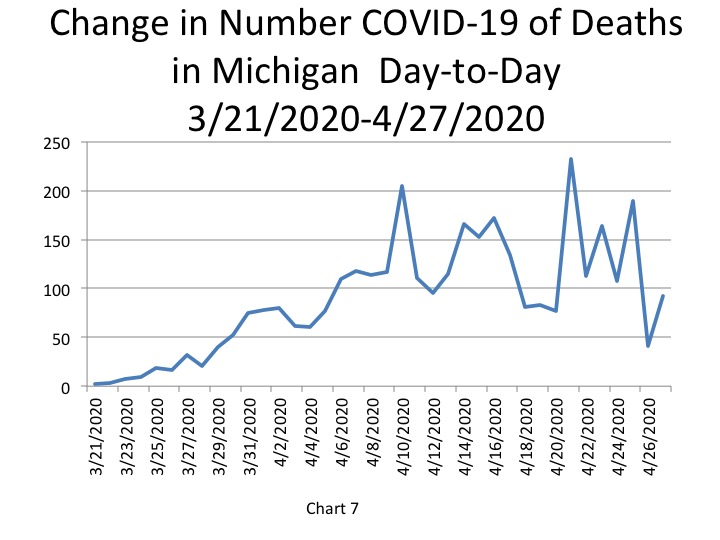
In Chart 6 the five-day rolling average for the number of deaths shows a continuing steady increase (a lagged number of 3,212 deaths, an increase of 119 deaths). The actual reported COVID-19 deaths reached 3,407 on April 27, an increase of 92 deaths from the day prior (Chart 7).
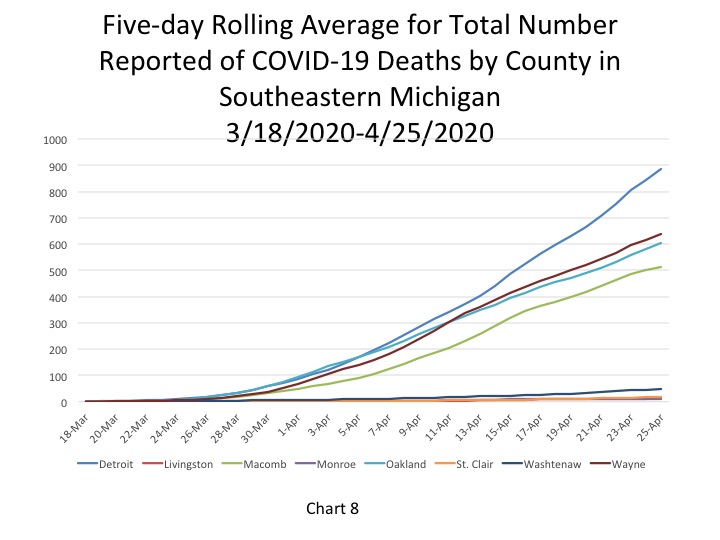
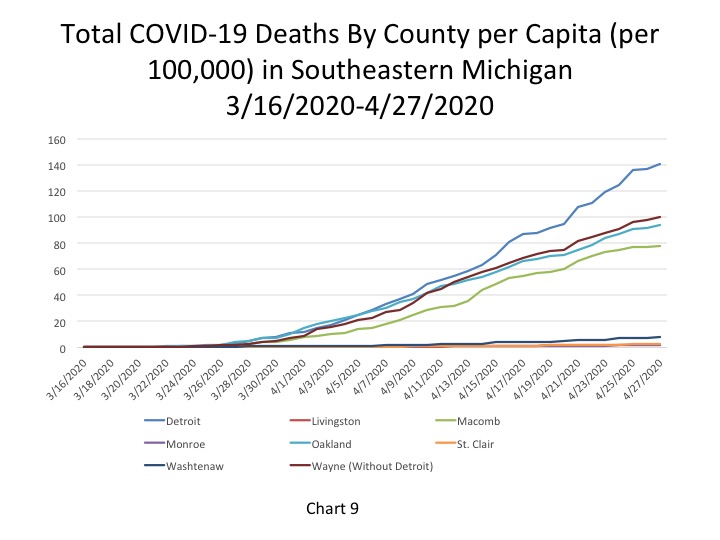
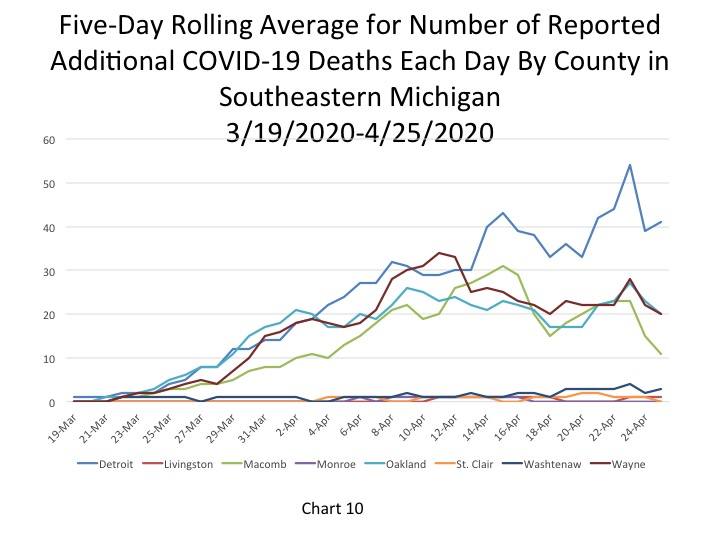
Breaking down the five-day rolling average of COVID deaths, Detroit still has a far higher rate of increase than the other units. Wayne County is second, followed by Oakland and Macomb counties. Each county but Monroe and St. Clair experienced an increase in the total number of deaths. These increases continue to be represented in Charts 9 and 10.
Chart 9 represents the total number of COVID deaths per 100,000 people. For Detroit on April 27 there were 141 COVID deaths per 100,000 people (equivalent to 950 deaths). In Wayne County there were 100 COVID deaths per 100,000 people (672 total deaths), in Oakland County there were 94 deaths per 100,000 people (631 total deaths) and in Macomb County there were 78 COVID deaths per 1000,000 people on April 27 (672 total). Detroit, Macomb, Oakland, Washtenaw and Wayne counties all experienced a small increase in the number of new deaths, with Detroit experiencing an increase of 28 and Wayne County experiencing an increase of 14.
Chart 10 shows the five-day rolling average for the number of new COVID deaths, Here we see a number of counties showing a decline in additional deaths, a good sign if this trend continues.
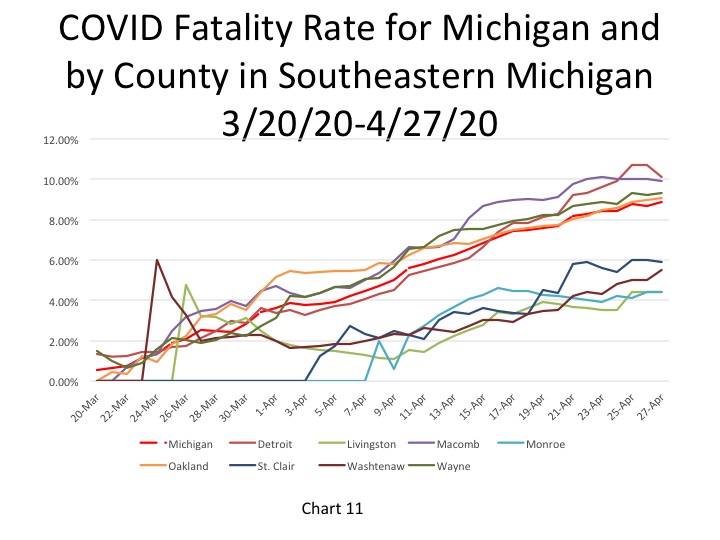
Notably in Chart 11 we see that the fatality rate in Detroit on April 27 decreased from 10.7 percent to 10.1 percent. The data also shows that the fatality rate in Macomb County is slowly decreasing. Just last week it was the highest in the region and now it has decreased below Detroit’s rate and from its peak of 10.1 percent to 9.9 percent. The State’s fatality rate on April 27 was 8.9 percent, a small decrease from the fatality rate the day prior. These declines may represent real changes or simply an increase in testing (the denominator here).
It appears as though the number of deaths is slowing, however we also know that the State releases additional COVID death numbers through another method of confirmation sporadically throughout the week. Such data releases could reveal that we are not slowing the spread and impact of the virus as much as we think. The Governor did note yesterday that they believe there is a plateauing in the number of cases and deaths in the State.