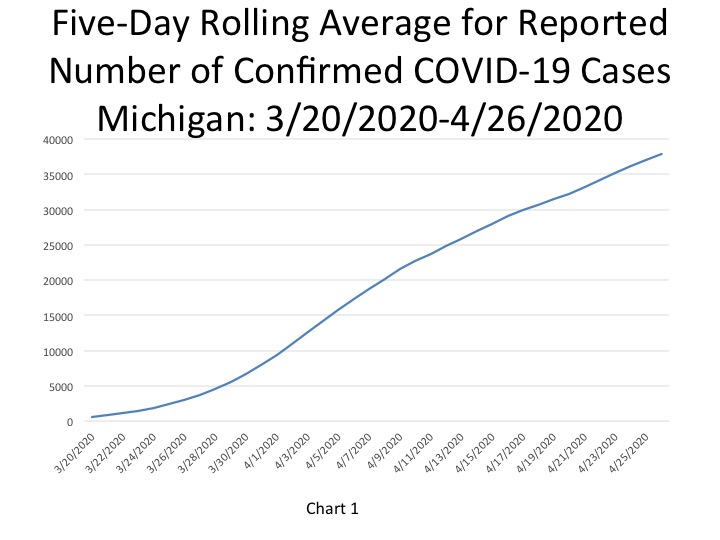
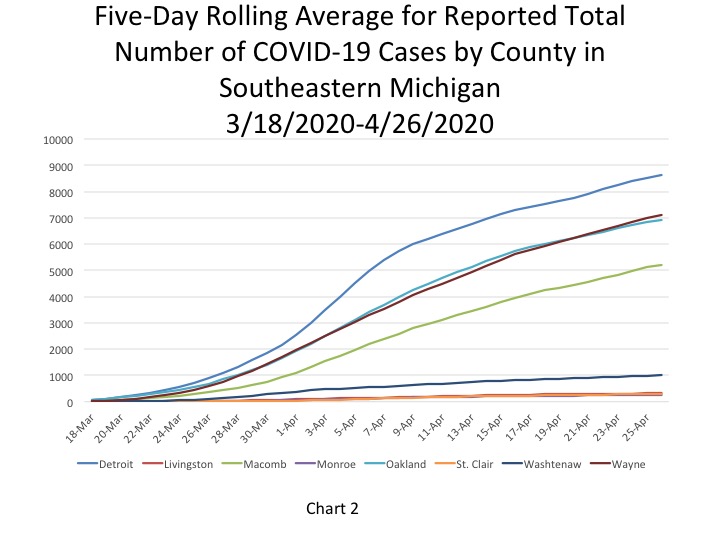
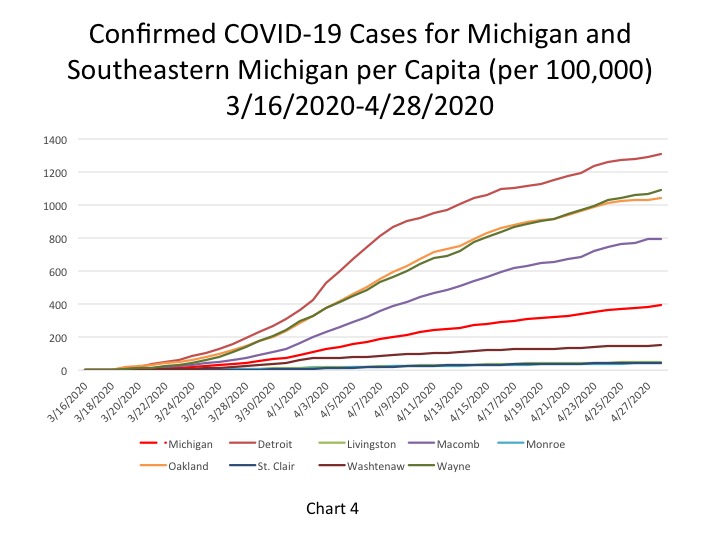
According to the State of Michigan, the total number of COVID cases in Michigan increased to 38,210 on April 28, which was an increase of 432 cases from the previous day. This total was equivalent to 393 cases per 100,000 people (Chart 4) on April 28. The five-day rolling average for the total number of COVID cases (Chart 1) reflects a smoother curve and adjusts for fluctuations in testing or the quality of reporting or failure to report. The five day rolling average means our daily case and death charts will lag two days behind. Based on this approach, the COVID cases increased to 37,819. While the increase in the number of cases has slowed down, both Charts 1 and 2 show that we have yet to reach a plateau at the State level and for the largest counties in Southeastern Michigan. In Chart 2 it appears the counties (Wayne, Oakland and Macomb) and Detroit are experiencing a slower rate of increase now than the State of Michigan, but the increase is still there. The State’s continued increase is likely a result of increased COVID spread in areas such as Kent County, where health officials said they don’t expect a peak for another few weeks, according to Bridge Magazine.
Chart 2 reflects the five-day rolling averages at the County level and for the City of Detroit. Detroit continues to have the highest number of confirmed cases, recorded at 8,625 on April 26. The number of cases in Wayne County increased to 7,125 for a five-day rolling average on April 26 while in Oakland County the number of cases increased to 6,908 and in Macomb County it increased to 5,210.
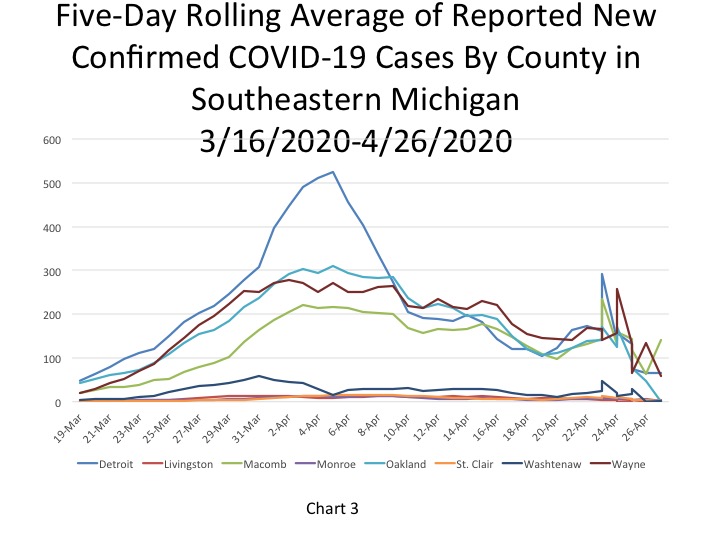
Chart 3 does show though an overall decline in the number of new daily COVID cases, with exception of a couple single day spikes for Detroit, Oakland, Macomb, Washtenaw and Wayne counties. With the continued increase in attempts to test more people for the virus it is very likely these spikes are a result of increased testing.
The daily data highlighted in these posts is from Michigan.gov/coronavirus, where data is updated daily at 3 p.m. Historical data was supplied from covidtracking.com, which republishes COVID data from the State.
The City of Detroit had 1,310 COVID cases per 100,000 people on April 28, an increase from 1,290 the day before (Chart 4). This is based upon a reported increase of 132 new cases, bringing the total number of COVID cases in Detroit to 8,811. Wayne County reported 1,094 cases per 100,000 people, and Oakland County had 1,042 cases per 100,000. These per capita rates were based upon 7,362 and 7,012 COVID cases on April 28, respectively. Macomb County reported 794 cases per 100,000 people, which is based upon 5,339 cases.
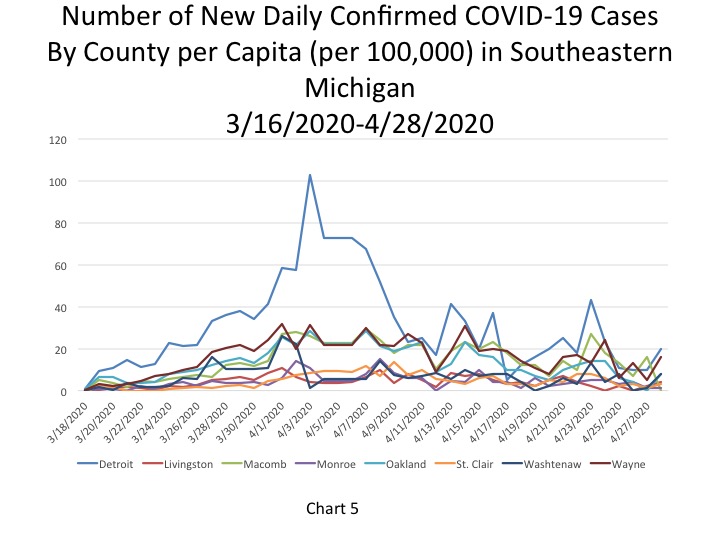
Chart 5 shows that Detroit and Wayne County had the highest number of new COVID cases per 100,000 people on April 28. Detroit had 20 new COVID cases on April 28 per 100,000, which was equivalent to 132 new cases, and Wayne County had 16 new cases per 100,000 people which was equivalent to 169 new cases.
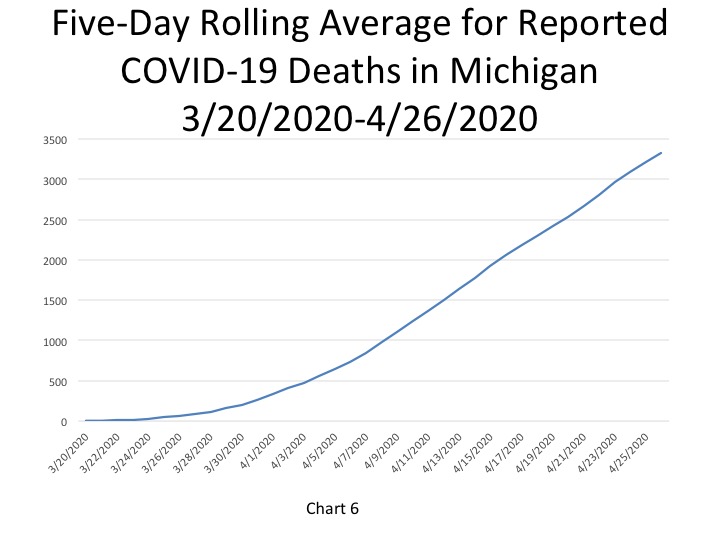
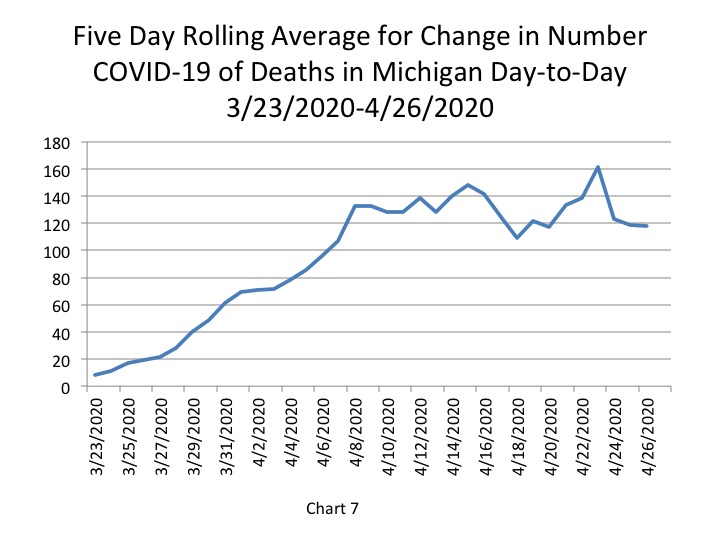
In Chart 6 the five-day rolling average for the number of deaths shows a continuing steady increase (a lagged number of 3,330 deaths, an increase of 118 deaths). The actual reported COVID-19 deaths reached 3,567 on April 28, an increase of 160 deaths from the day prior. Of the 160 reported new deaths, 40 of them were added to the April 28 daily total because of Vital Records and coronavirus database comparison the Michigan Department of Health and Human Services does three times a week. Chart 7, a five-day rolling average chart, reflects a smoother data set for instances such as this. Overall, Chart 7 indicates a recent decline in the number of new daily COVID deaths.
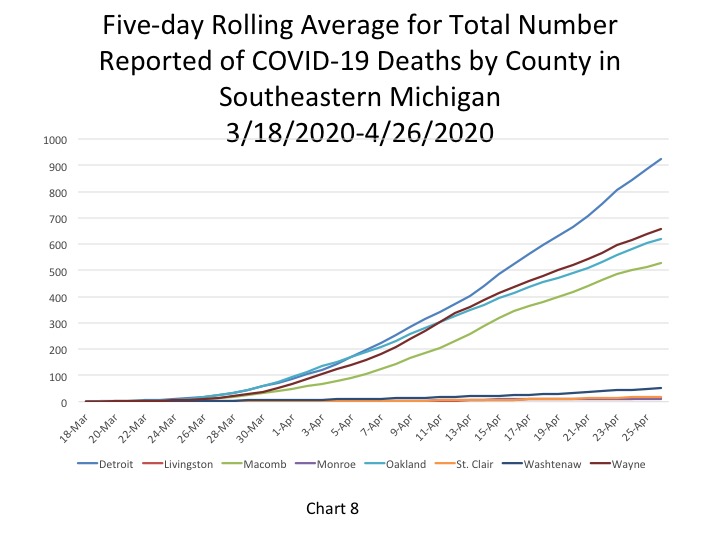
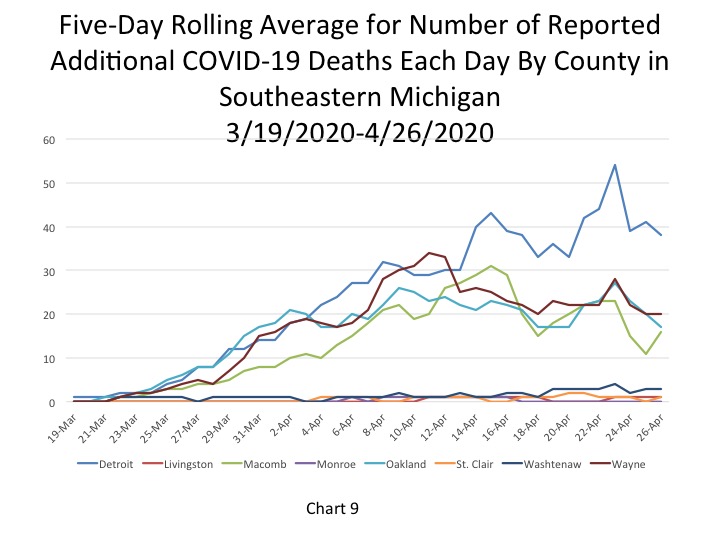
Chart 8, a five-day rolling average for the number of COVID deaths by each county, shows that the total number of deaths in Detroit continues to have a far higher rate of increase than the other units. Wayne County is second, followed by Oakland and Macomb counties. Each county but Monroe and St. Clair experienced an increase in the total number of deaths. These increases continue to be represented in Chart 9, but show a recent decline in the number of daily deaths for Detroit and Oakland County. Macomb County on the other hand has experienced a recent increase.
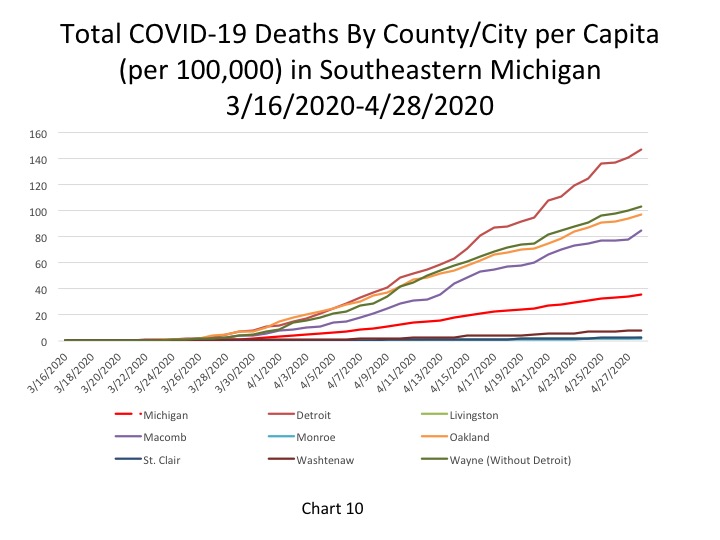
Chart 10 represents the total number of COVID deaths per 100,000 people. For Detroit on April 28 there were 147 COVID deaths per 100,000 people (representing 988 deaths). In Wayne County there were 103 COVID deaths per 100,000 people (694 total deaths), in Oakland County there were 97 deaths per 100,000 people (654 total deaths) and in Macomb County there were 85 COVID deaths per 1000,000 people on April 28 (572 total). The State of Michigan had 36 COVID deaths per 100,000 people, a rate which was lower than the four entities discussed above. Additionally, Macomb County experienced the highest number of new daily COVID deaths at 45 on April 28; Detroit had 38 new deaths.
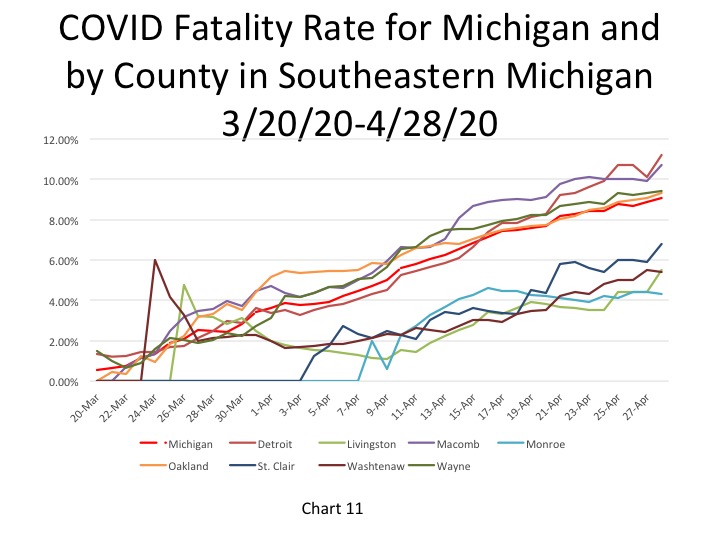
The fatality rate in the City of the Detroit increased to 11.2 percent on April 28, which is higher than the State’s fatality rate (9.1 percent) and the rates of the counties in Southeastern Michigan. The fatality rate in Macomb County also spiked up on April 28 to 10.7 percent. The increases in these rates may be reflective of the additional 40 deaths the State reported on April 28 as a result of their database comparison method to discover additional COVID deaths. Monroe and Washtenaw counties experienced small decreases in their fatality rates.
The rate at which the virus is spreading in Southeastern Michigan appears to be declining at a faster rate than the spread statewide. This is likely because areas such as Kent County are not expecting their peak until mid-May. Such factors will certainly a play a role in determining what regions of the state will re-open when. Just because one area lags behind in terms of the rate of spread does not mean another area can’t experience a second peak due to travel, even within the state.