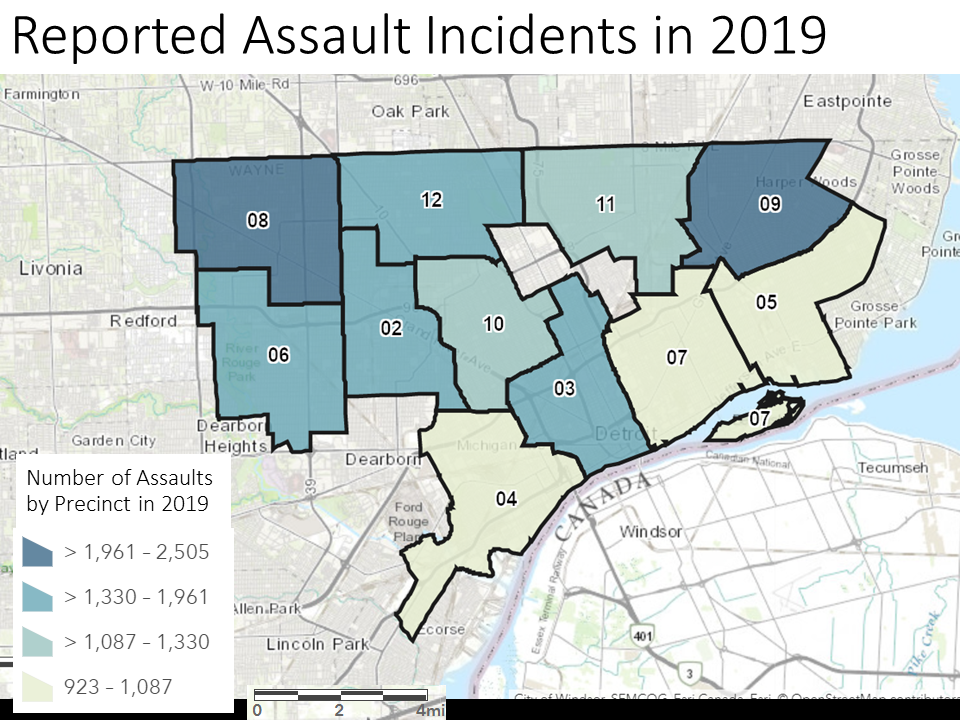
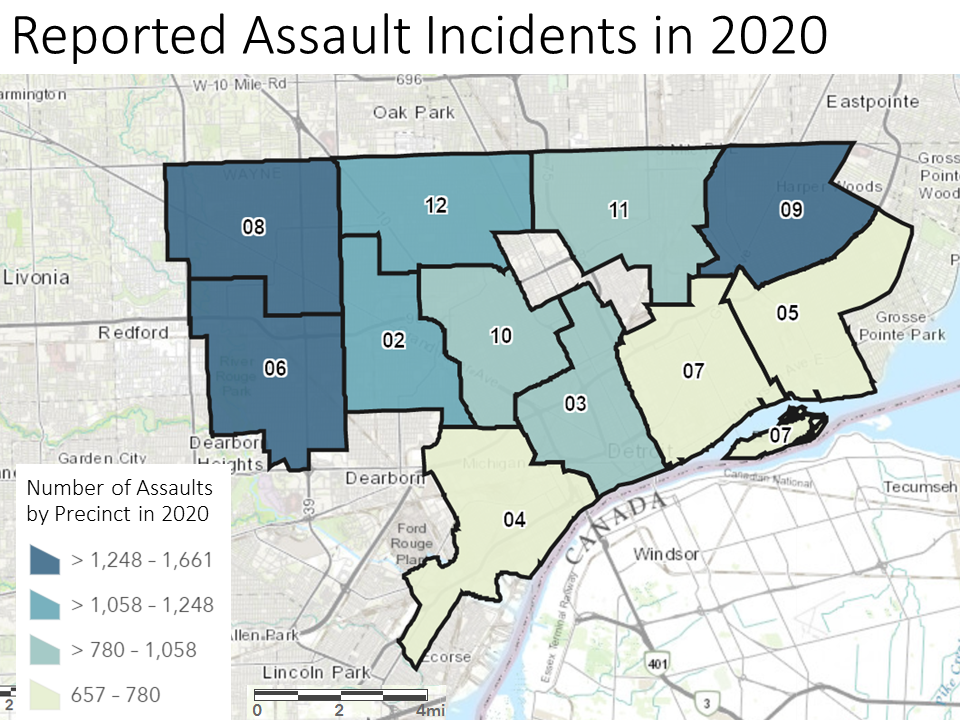
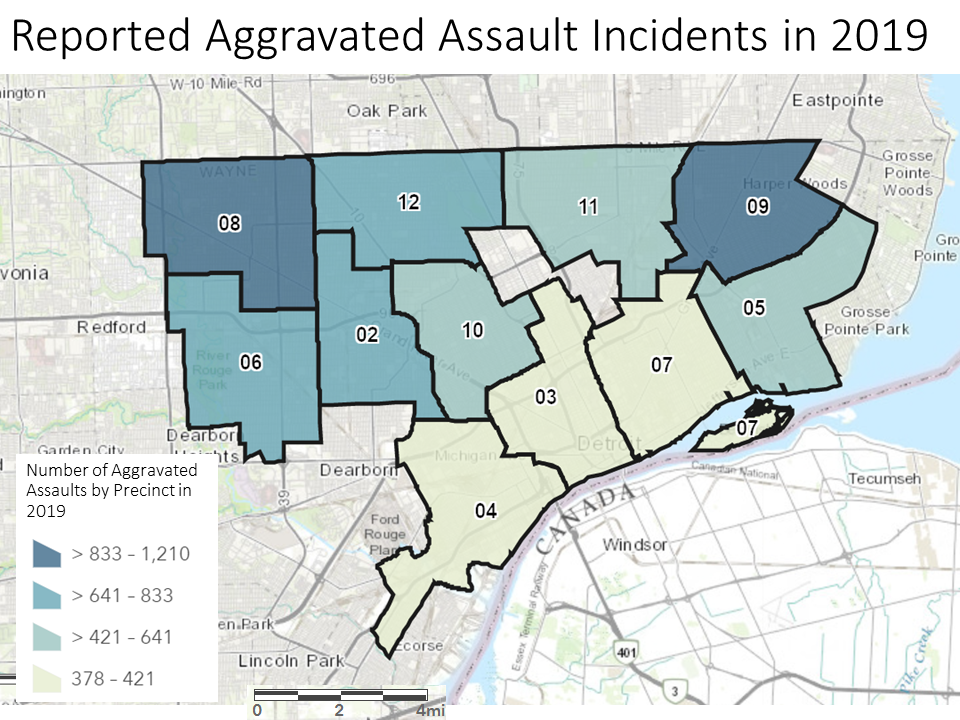
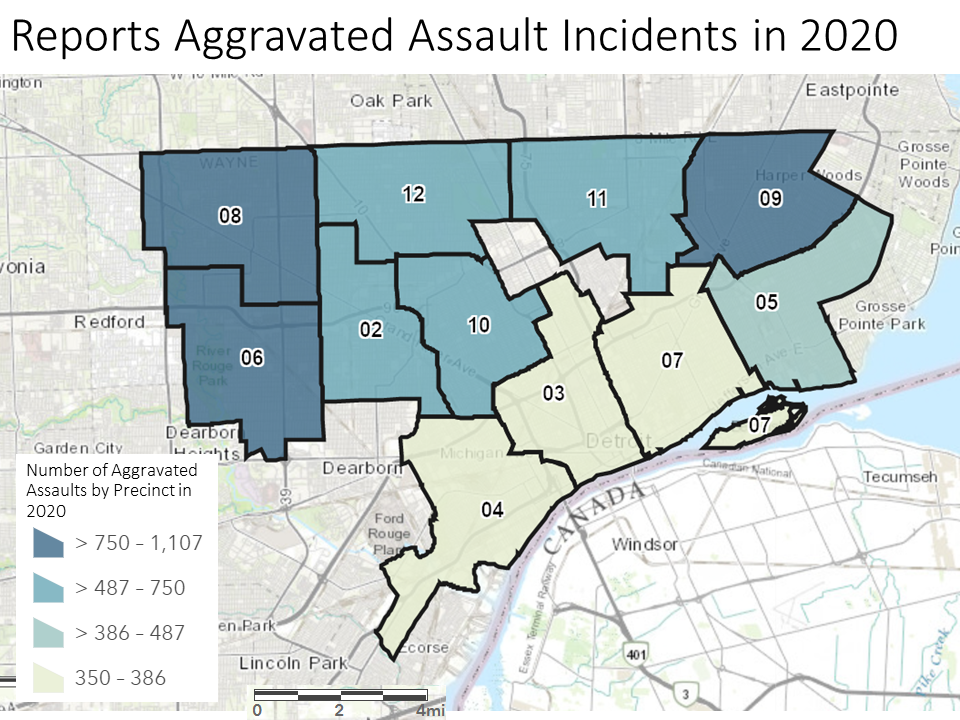
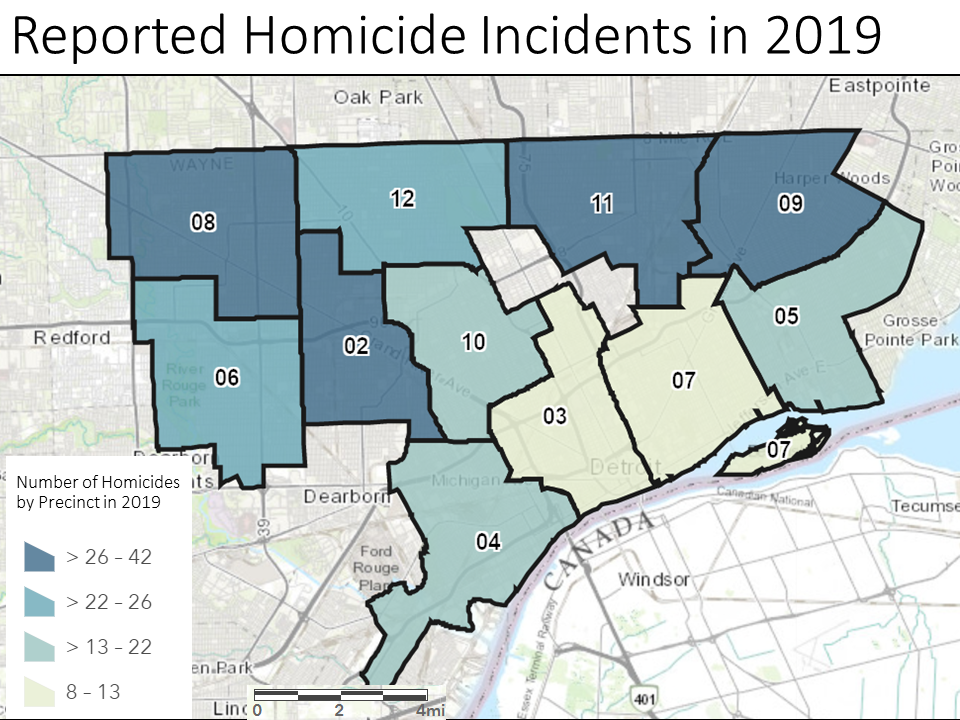
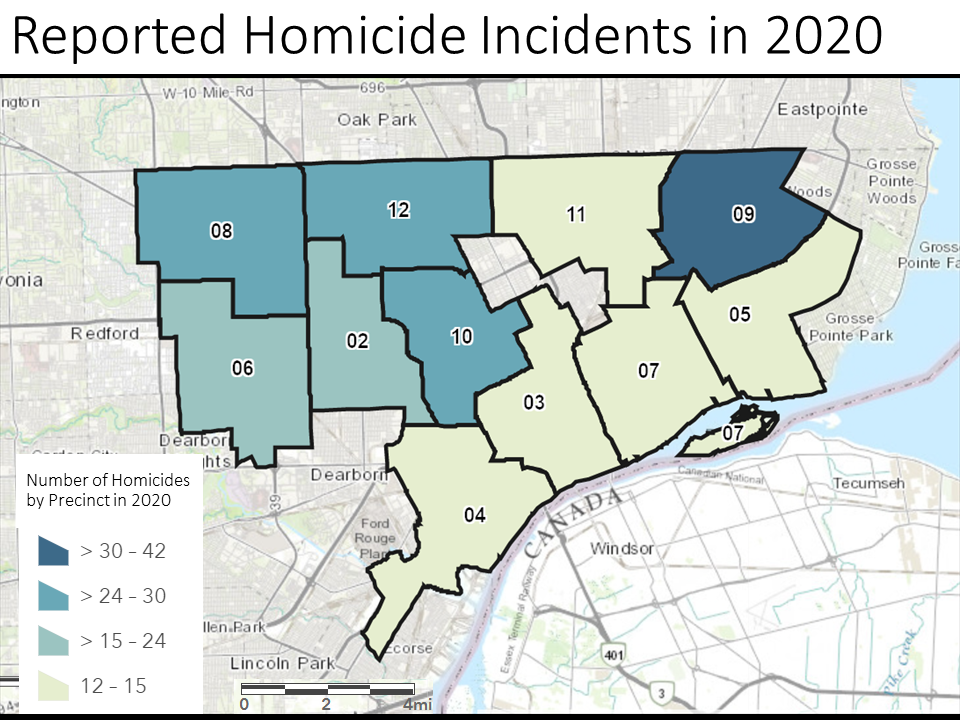
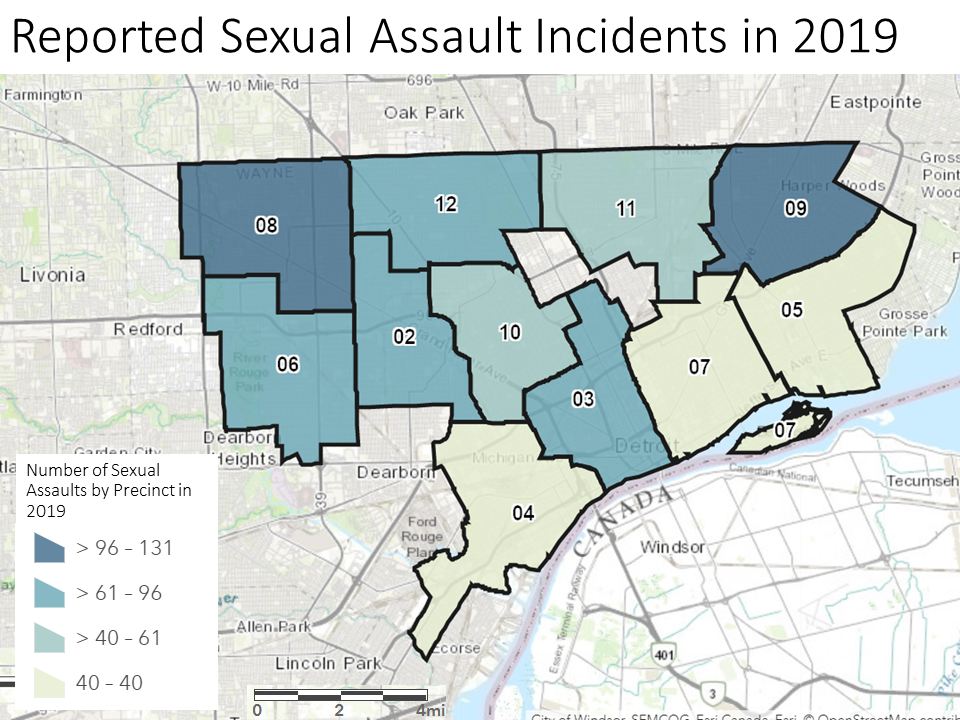
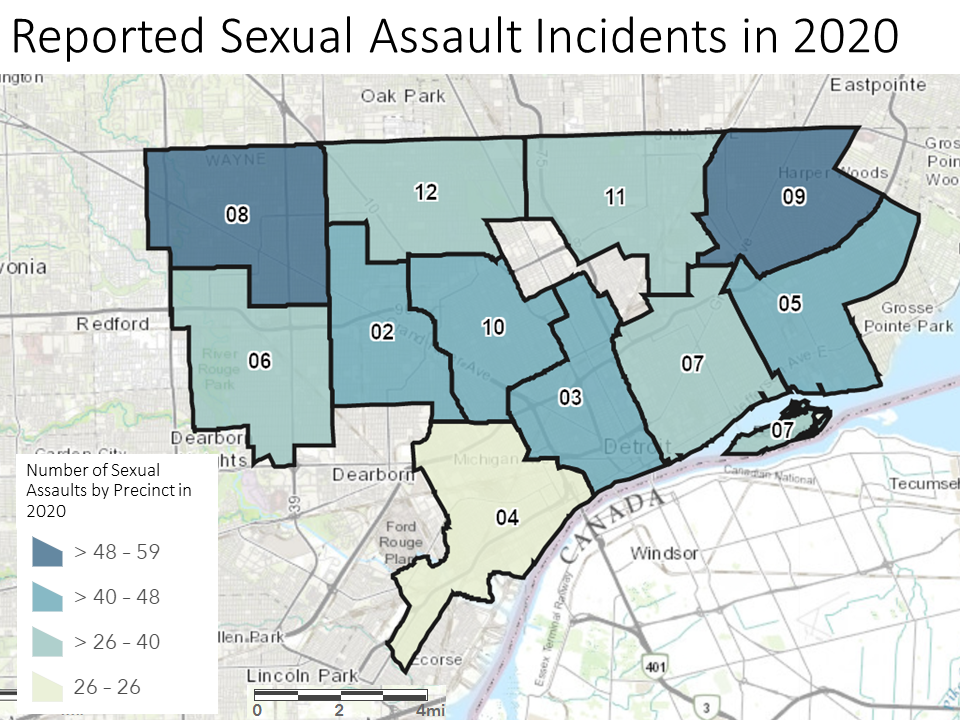
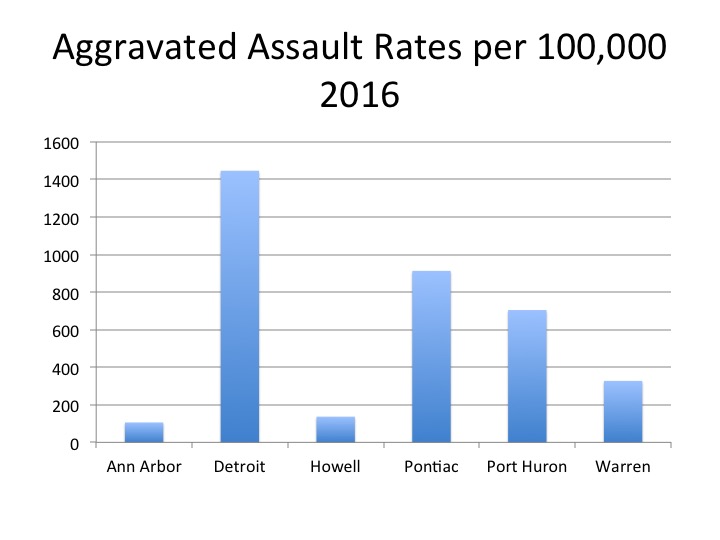
Crime in Detroit is declining again. Nearly all major categories of crime decreased in the first six months of this year. Murder, sexual assault and robberies, were all down — by double digits year to date. Among violent crime, only simple assault increased. Aggravated assault is down recently, but not below pre-Covid levels.
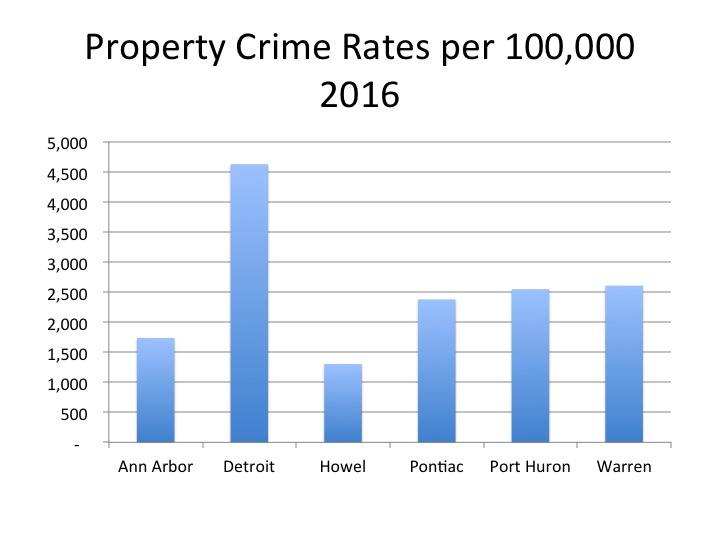
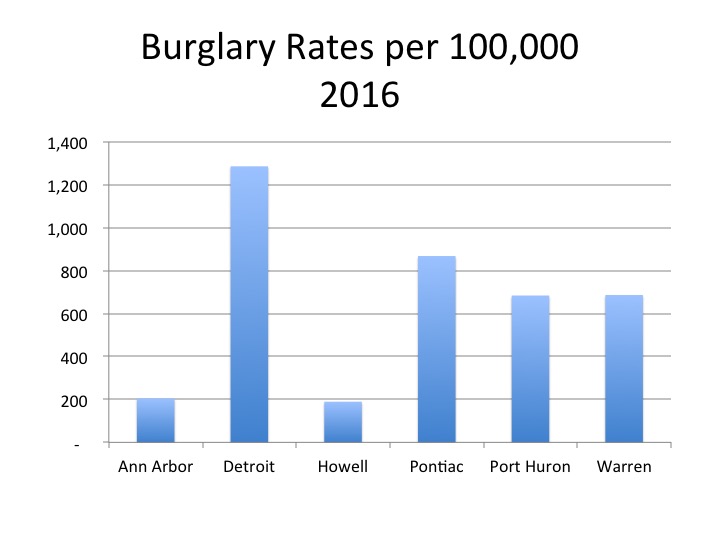
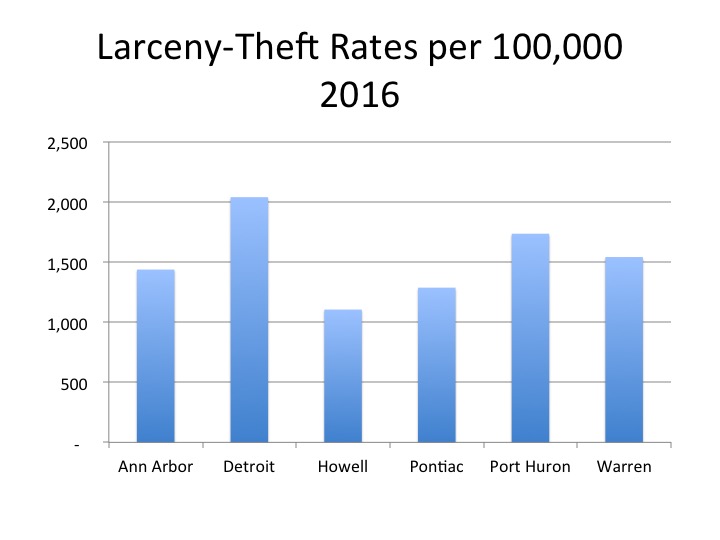
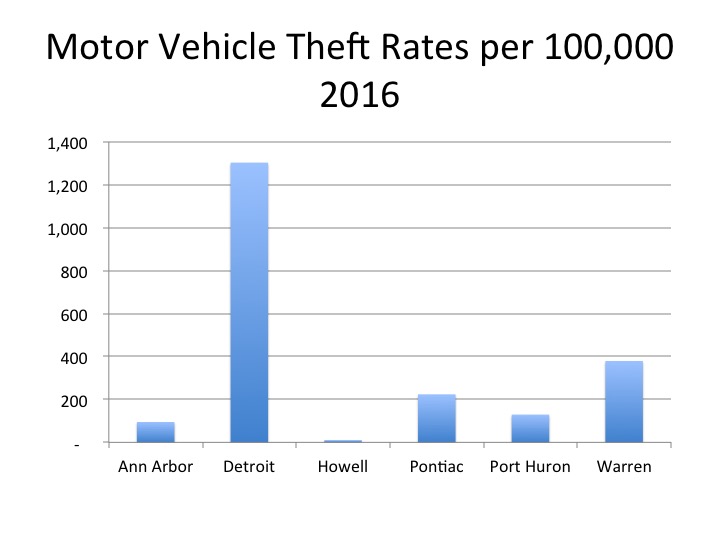
Among property crimes, damage to property dropped by double digits, while burglary and larceny fell by single digits so far this year. Auto theft peaked in late 2022, but has come down since then, though police are challenged by new technological techniques that thieves are using.
These declines are good news for Detroit, helping to overcome a bad reputation that has held Detroit back for decades.
Note, though, the “again.”
Detroit, like many major cities, had seen massive declines in crime over recent decades until these were halted by the COVID-19 pandemic and its aftermath. Covid reversed the decreases for several years, but then crime levels headed back down. FBI data on crime levels lags somewhat, but it confirms a temporary COVID increase that has been replaced by a post-COVID decrease in crime rates in Detroit.
The FBI data also suggests one cause for decrease, an increase in clearance rates (i.e., the extent to which a perpetrator is caught). This is one several causes of the drop in crime. The clearance rate increase indicates that the police are getting better at their jobs.
They don’t catch every perpetrator, but they are catching about double the number they were—a huge improvement. This, in turn, points to other things Detroit’s police are doing well. These include:
Targeting high crime areas. For over a decade now they have been identifying hot spots for crime and completing proactive patrols in those areas, providing more protection for citizens and increasing the risk for criminals who might be planning a crime. The criminals often decide that the crime is too risky, and those decisions lead to reduced crime rates.
Using technology and working with community organizations to reduce violence. The city has experimented with using cameras at gas stations and other locations, and it has used a gunshot detection system to identify where guns are fired in the city so they can target crimes as they occur. At the same time they have engaged residents in some neighborhoods to identify and engage people at the greatest risk of violence, who are then helped to pursue a different path.
Tracking down repeat offenders. Criminals on parole or probation, who commit additional crimes, now are far more likely to find themselves back in police custody. Partly this because of increasing close cooperation between police and corrections officers. Higher quality data tracking of the probationers and parolees and their crimes accelerates this process.
Sustained partnerships with federal, state and local agencies that include aggressive investigation and prosecution of the relatively small number of individuals responsible for the most violence in the community.
One important reason that crime is falling in Detroit is beyond the control of the police. This is a reduction in the number and percentage of youth in the city. The 2010 Census and the 2022 American Community Survey document a decline in the number of children in Detroit and a stronger decline in youth 15 to 24. This is the cohort that has historically had the most difficulty getting jobs and who have long been represented disproportionately in crimes. These trends are projected to continue with Detroit’s population gradually getting older with fewer and fewer youth.
A final question: Are Detroiters recognizing these changes? Two surveys by the University of Michigan indicate that Detroiters are seeing the declines that the crime statistics show. Comparing 2019 data to 2021 data the UM data indicates that fewer Detroiters were victims of crime in each category from auto theft to physical attacks. A majority or nearly a majority said police were doing a good job in 2018, 2020 and 2021.
Not all were so positive. Younger people, in particular, were far less likely to believe that the police were doing a good job. The data indicate young people are more likely to have had “forceful” interactions with the police.
Overall, Detroit police are now more representative of the people they police. They are better trained. They use more technology. Many are good at engaging with the community. They have fewer youth to police. The economy has been good, reducing the negative impact of unemployment on crime. All these trends are converging to reduce crime levels. It’s time to applaud the progress and find ever more new and inventive ways to continue the positive trends in the city.
This piece can also be found in Crain’s Detroit here, as an Op-Ed written by Lyke Thompson.