Alcohol Causes Most Traffic Deaths in Southeastern Michigan, Distracted Driving Causes Most Injuries

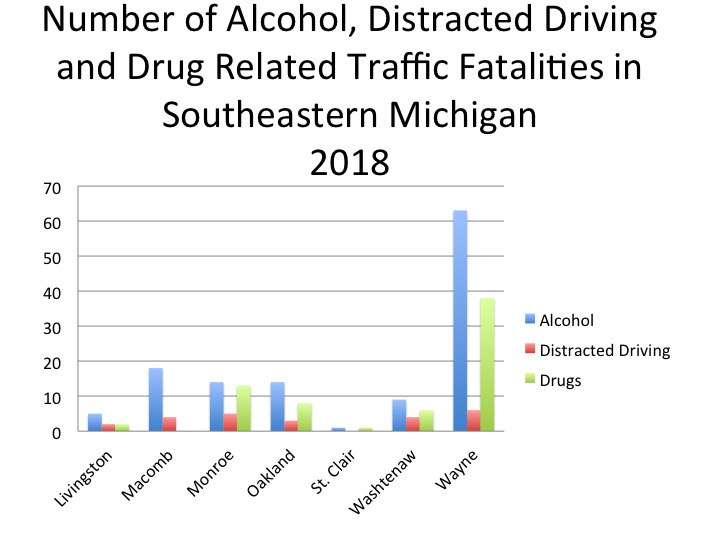
Traffic fatalities in Michigan totaled just under 1,000 in 2018, a number that officials from the Michigan State Police said is too high. However, that number was below the 2016 and 2017 traffic fatality numbers which rose above 1,000. Below we examine the number of traffic fatalities and injuries in Southeastern Michigan, along with the number of fatalities and injuries related to alcohol, distracted driving and drugs. As the charts show, of the factors examined, alcohol is the largest contributor to traffic fatalities in the region.  

Wayne County, which is also the largest county in the state, had the highest number of traffic fatalities at 164, 63 of which were alcohol related. Distracted driving contributed to 6 of the164 deaths and drugs contributed to 38. Oakland and Macomb counties had the second and third highest number of traffic fatalities in the region at 54 and 53. In Oakland County, of the 54 traffic fatalities, 13 were alcohol related, 3 were related to distracted driving and 8 were related to drugs. For Macomb County, alcohol contributed to 18 of the 53 traffic deaths and distracted driving contributed to 3 of the deaths; there were not any drug related traffic deaths.

When looking at the percentage of alcohol related traffic deaths compared to the total number of traffic deaths, Monroe County had the highest rate. Of the 29 traffic deaths in Monroe County in 2018, 48 percent of them (14) were alcohol related. St. Clair County had the lowest percentage at 6 percent. In 2018 there were 16 traffic deaths in St. Clair County and 1 was alcohol related. With those two exceptions, the percentage of alcohol related traffic deaths ranges between 24 and 38 percent.

Of the other two factors, drugs contributed more to traffic fatalities than distracted driving.

Injuries related to vehicle accidents are higher than fatalities and while Wayne, Oakland and Macomb still had the highest numbers in the region, the data shows that distracted driving was reported to be the largest contributor of the factors examined. Overall, data indicated that distracted driving contributed to an average of 10 percent of the traffic related injuries in Southeastern Michigan in 2018. In Macomb C, Monroe and Washtenaw counties distracted driving contributed to 11 percent of the traffic related injuries and in Wayne County distracted driving contributed to 7 percent.

 Although Wayne County had the lowest percentage of distracted driving related traffic injuries in the region, it had the highest number at 1,082 (there were 16,578 total injuries). Alcohol was related to 897 traffic injuries in Wayne County and drugs were related to 281 injuries. In Oakland County there were 10,105 total traffic related injuries, 572 of which were alcohol related, 1,013 of which were related to distracted driving and 199 of which were related to drugs. In Macomb County there were 7,360 traffic related injuries, 391 of which were related to alcohol, 813 of which were related to distracted driving, and none of which were related to drugs. And, while Macomb County did not report any drug related traffic injuries in 2018, St. Clair County was the only county in the region where there were more drug related traffic injuries than alcohol or distracted driving injuries. In 2018 there were 931 traffic injuries in St. Clair County, 122 of which were related to drugs. 

While the full 2019 Michigan State Police Report on traffic fatalities and injuries has not been released, officials maintain that they continue to strive for fewer than 1,000 fatalities each year. Additionally, officials have said they believe the lower 2018 number is related to additional efforts made to educate drivers and stricter enforcement. The 2019 numbers will be released in March, and at that time we will examine the new data and compare it to historical data.
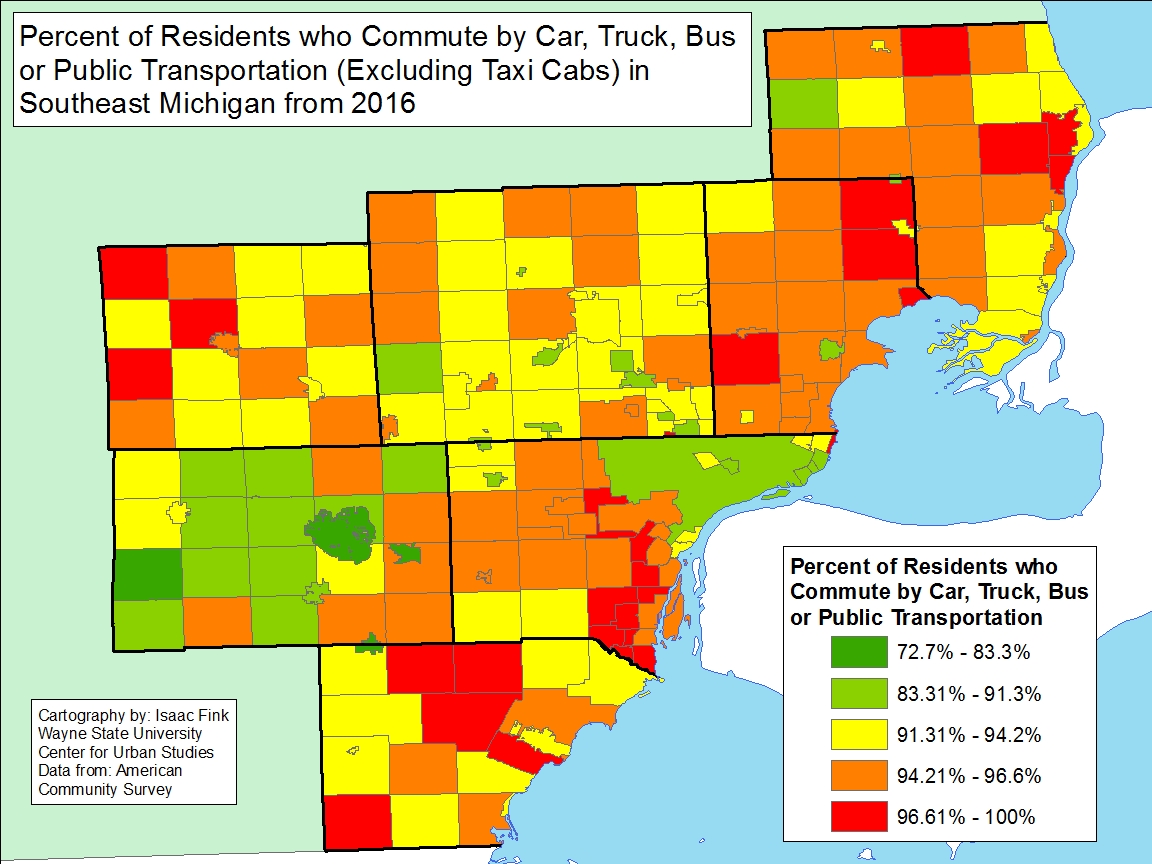
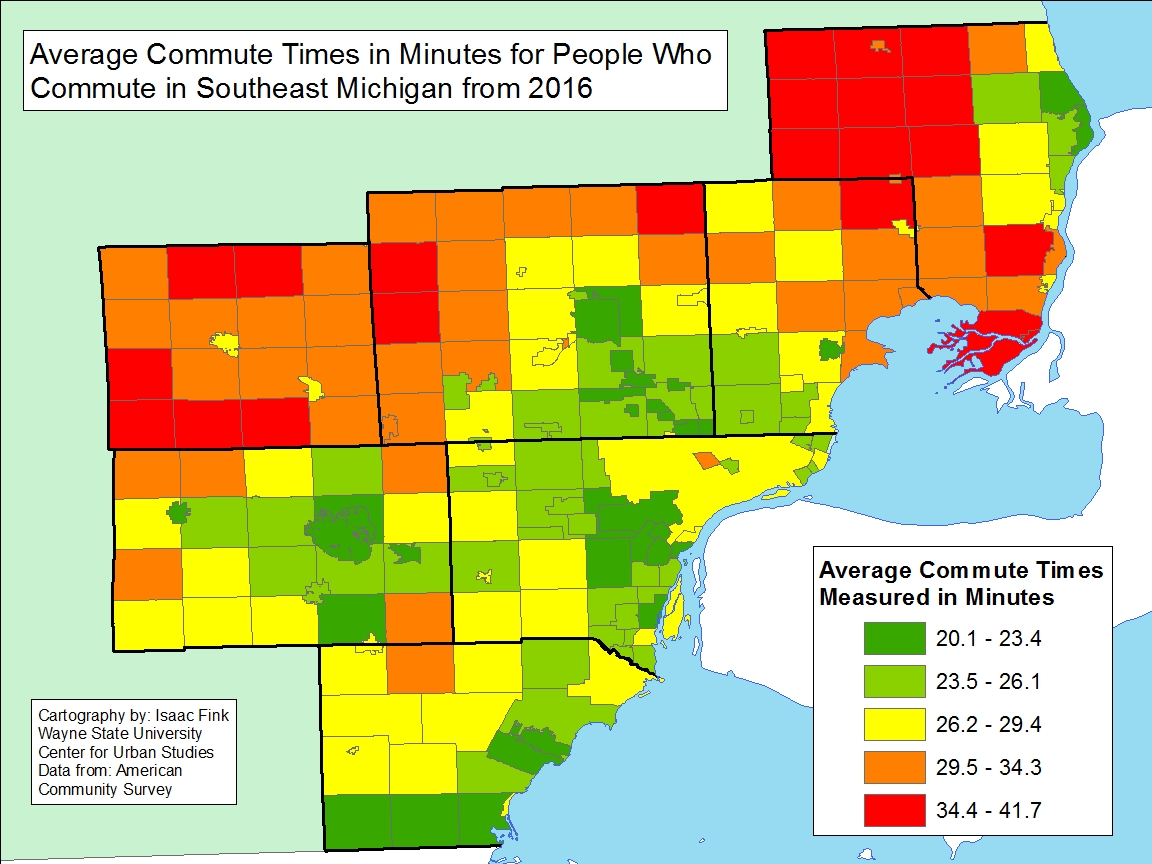
Commute Times in Southeastern Michigan Slightly Increase


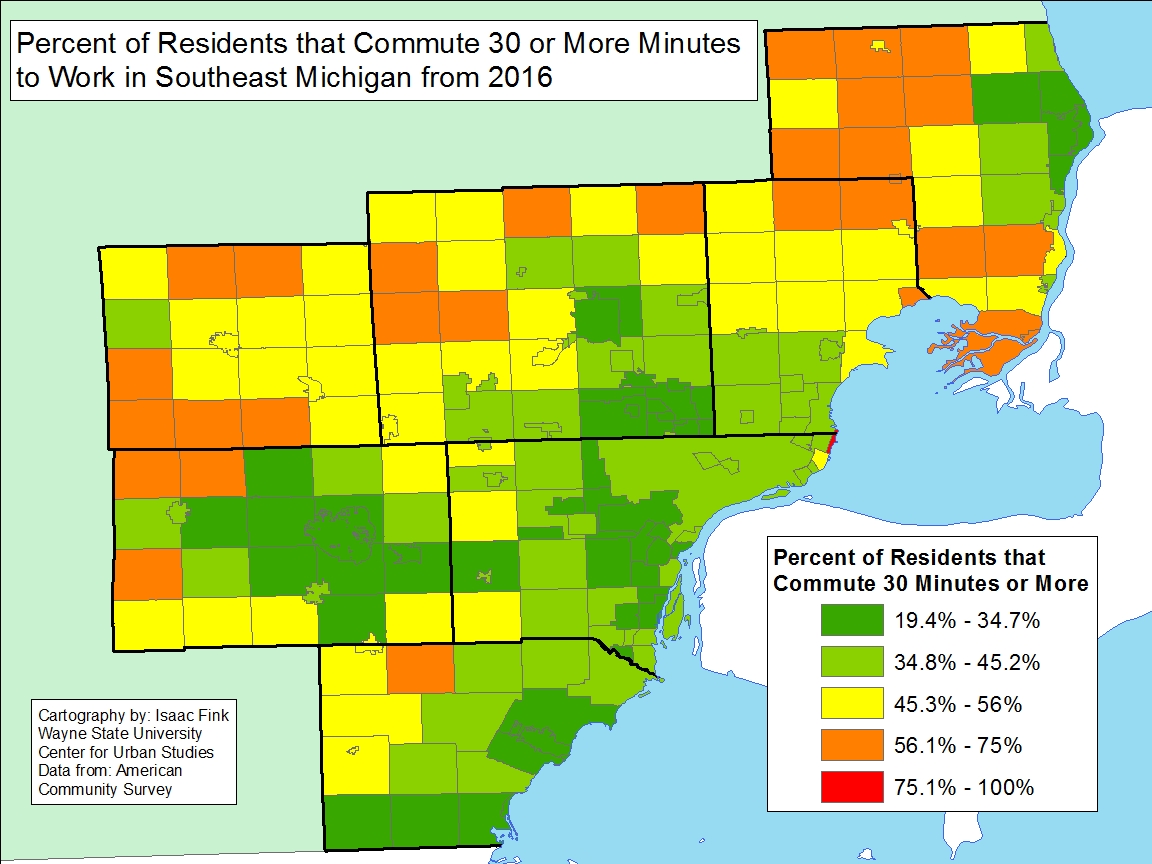
In all Southeastern Michigan communities more than 70 percent of residents with a job commuted to work by some mode of transportation, whether it be by vehicle or a mode of public transportation in 2016, according to U.S. Census data. In our sprawling region, where cars are king, suburban life has long dominated and road infrastructure is failing, it is no surprise that the average commute time for the region is 30 minutes. However, in 61 of the region’s communities more than 50 percent of commuters experienced a commute time above 30 minutes in 2016.

At the level of counties, Livingston County had the longest average commute time in 2016 at 32 minutes, followed by St. Clair County at 29 minutes. When considering individual communities, there were only three communities where the average commute time was above 40 minutes; these communities were: Berlin Township (40 minutes), Riley Township (41 minutes) and Emmett Township (41 minutes). All three of these communities are located in the more rural areas of the region.

As noted, the data for 2016 shows that 61 communities in Southeastern Michigan have more than 50 percent of commuters experiencing a commute above 30 minutes. Unadilla Township had the highest percent of residents experiencing more than a 30 minute commute at 75; the average commute time for residents in that township was 39 minutes. No city had an average commute time below 20 minutes, and the communities with the lowest commute times either had large employment hubs or were located very close to them. For example, in 2016 commuters in Ann Arbor had the lowest commute time at 20 minutes. Both the University of Michigan and University of Michigan Health Care System are located in Ann Arbor, a relatively compact city.

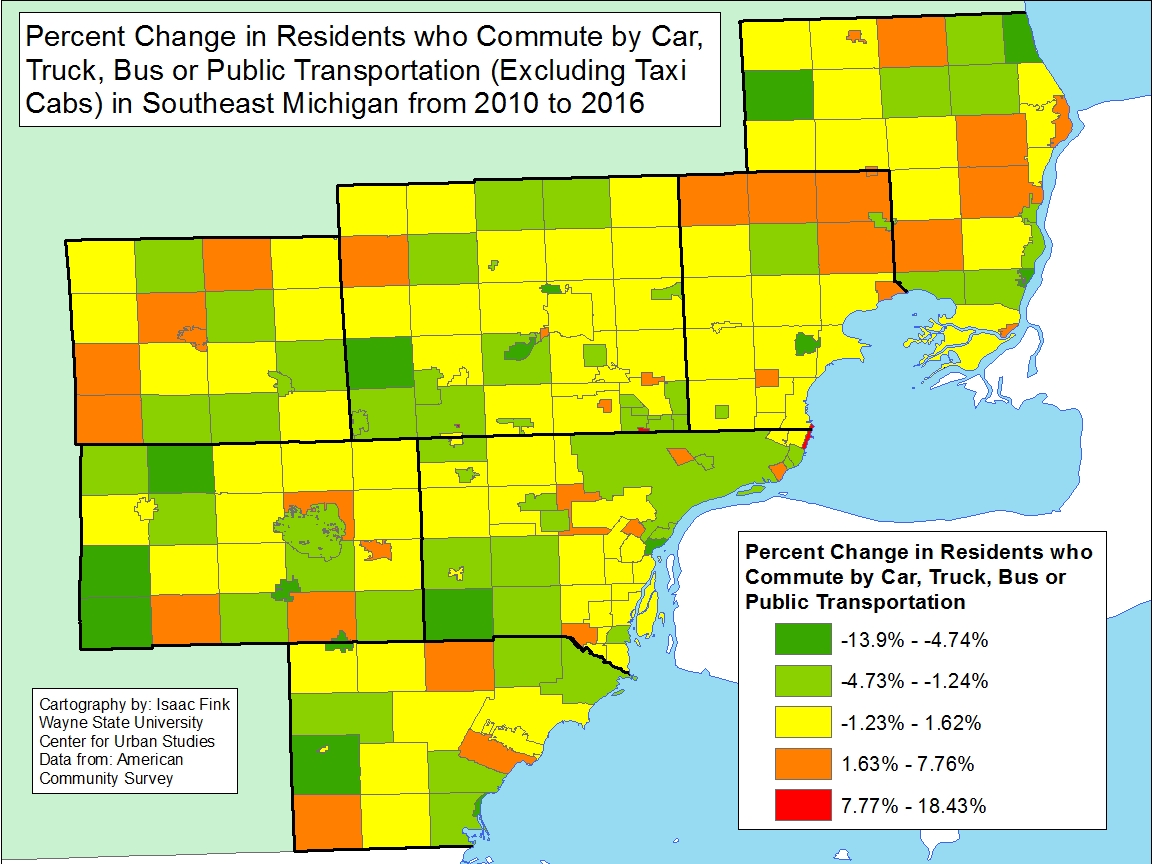
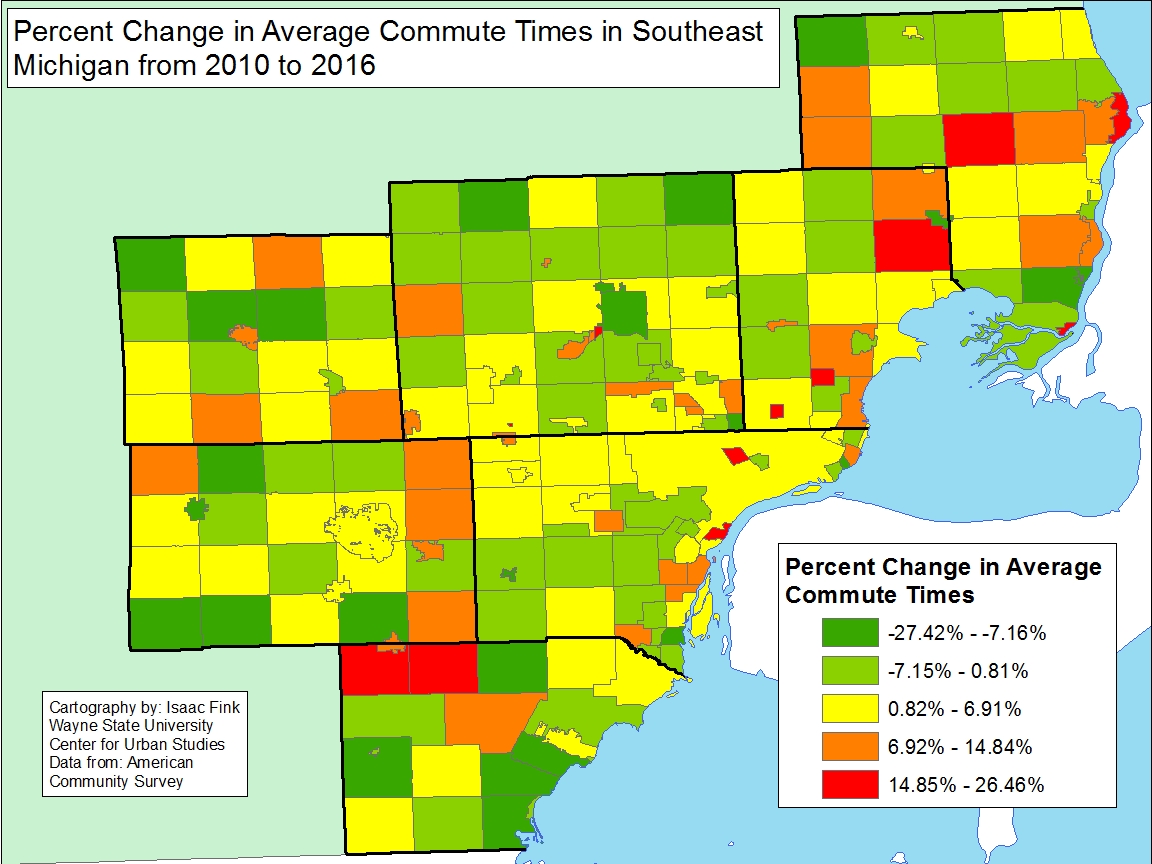
Between 2010 and 2016 the average percent of residents who commuted to work increased only slightly, by 0.3 percent. While this shows that the number of commuters on the road remained relatively the same between 2010 and 2016, other data shows that, arguably, congestion on the roads have increased. According to the data, the average commute time for residents in Southeastern Michigan increased by about two minutes.

There were 30 communities in the region though where the commute time increased by more than 10 minutes. Overall, there were 127 communities that experienced a percent change increase in average commute times between 2010 and 2016. The communities with the largest percent increase in average commute times between 2010 and 2016 were spread across the region, which could very well mean road congestion was increasing due to the region’s road system. For example, the City of Northville had the largest percent change increase in commute time between 2010 and 2016 at 31 percent. Northville is located near to I-275, I-696 and I-96 in the areas where these highways are often under construction and experience regular traffic backups due to congestion.

River Rouge had the second largest increase at 26 percent. Jefferson Avenue runs through River Rouge, but was not easily accessible in the city between 2013 and 2016 due to the Jefferson Bridge being closed. This traffic shift would have caused commuters in River Rouge, and other downriver communities, to have to utilize Fort Street and/or I-75 to commute, meaning there were additional vehicles on these alternate routes.

On the opposite side of the spectrum, there were 78 communities in the region where average commute times decreased between 2010 and 2016. Of those communities, 14 had a decrease in the average commute time by more than 10 minutes.

While construction and constricted road systems attribute to traffic congestion, so does the number of vehicles on the road. In Southeastern Michigan we know that there is no comprehensive regional transit system, and instead majority of commuters rely on driving themselves to and from work. A way to decrease traffic congestion is to create a reliable, connected regional transit system that residents would be able to utilize to get to and from work. Increased use in public transportation would decrease congestion, particularly at peak hours, and put less stress on our existing road infrastructure.