Veterans in SE Michigan tend to fare better with income and employment

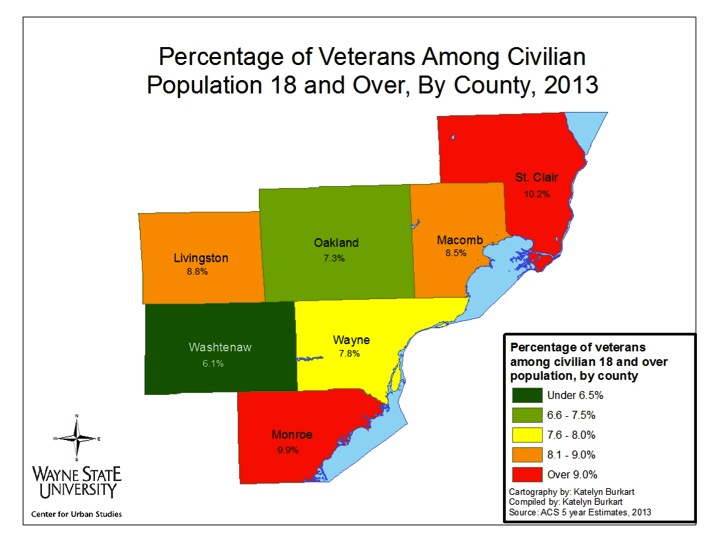
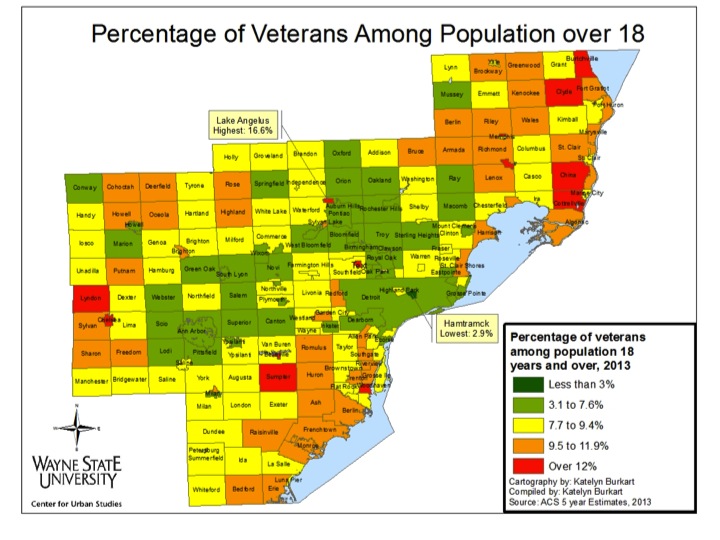
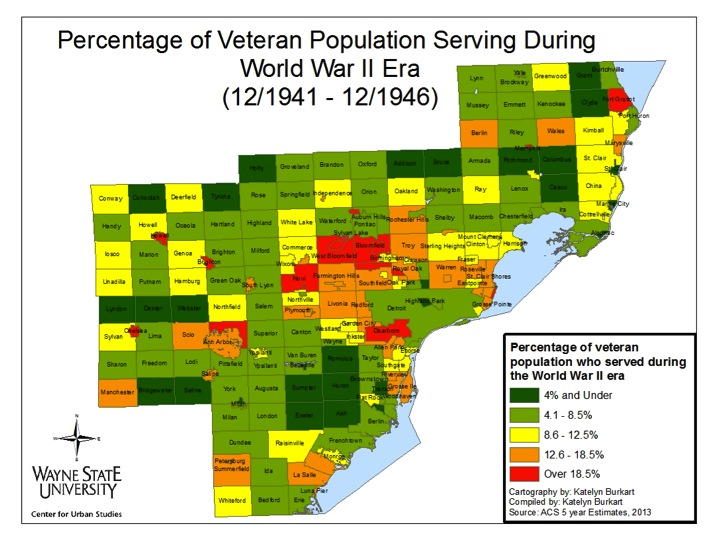
Last week we examined where veterans live throughout the seven-county region of Southeastern Michigan and this week we take a deeper look into the socioeconomic picture for the region’s veterans. Overall, we see that veterans in the region in 2013 tended to have a higher median income level than non-veterans. Also we see that a lower percentage of veterans in the area fell under the poverty line in 2013 than non-veterans. Unemployment status for veterans throughout the region, however, varied.

This data presented in the maps below is from the 2013 American Community Survey.

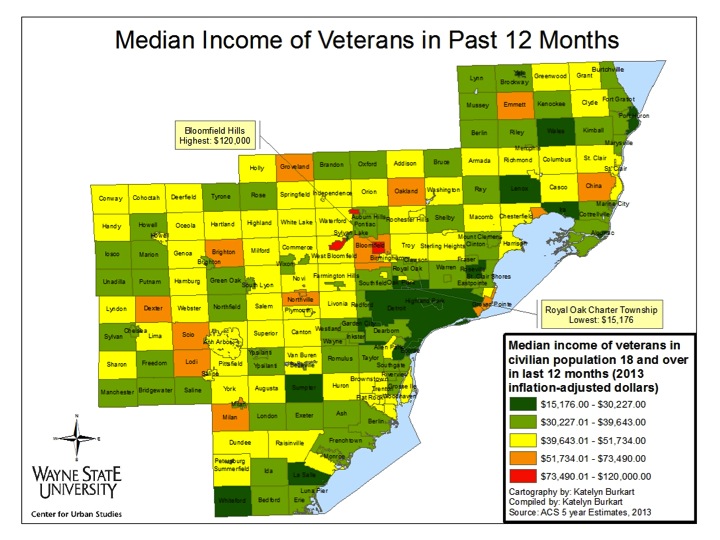
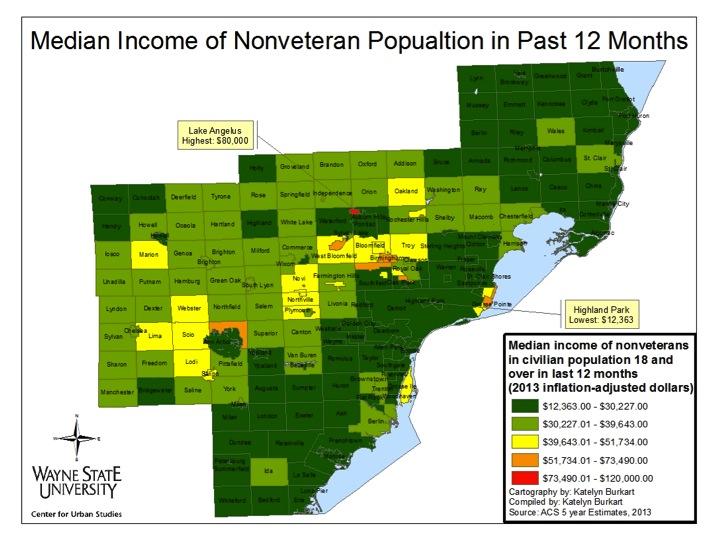
When looking at median income in Southeastern Michigan at the municipal level, we see that it tended to be higher for veterans than it was for non-veterans. Municipalities such as Bloomfield Hills, Orchard Lake, and Lake Angelus – all of which have higher median income levels than the region as a whole (link to post) – also had higher veteran median income levels than a city such as Highland Park, for example, which has low median income levels.

It should be noted, however, that veterans make up a smaller portion of the population than non-veterans, and as a result, sample size may have had an influence on these numbers.

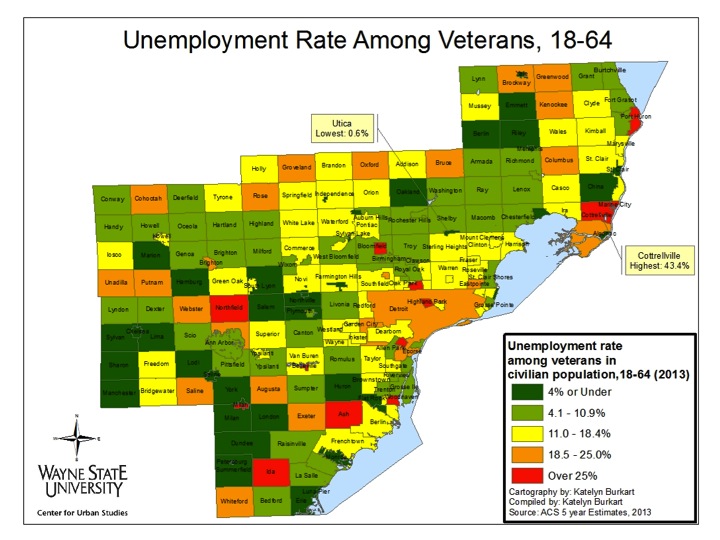
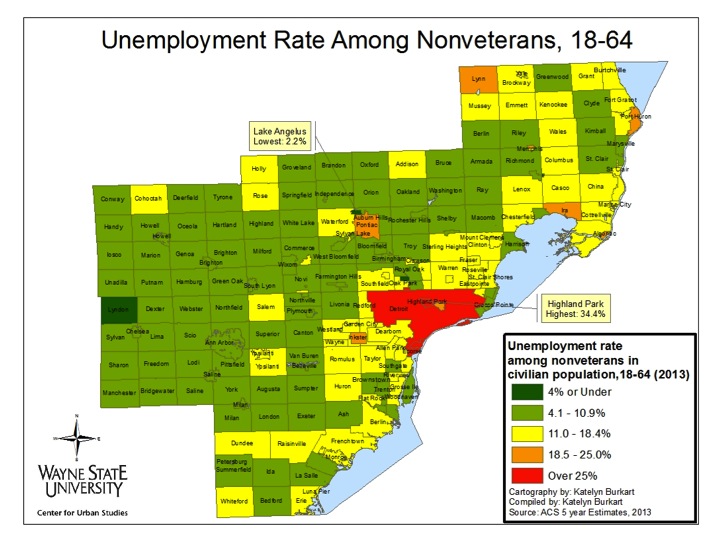
The unemployment rate among veterans varied much more than it does among non-veterans. The rate among veterans varied from 0.6 percent to 43.4 percent For non-veterans, it ranges from 2.2 percent to in 34.4 percent The locations with high unemployment also varied significantly between veterans and non-veterans, with 12 locations across five counties having over 25 percent unemployment among veterans – rates that were only seen in Detroit and Highland Park among non-veterans.

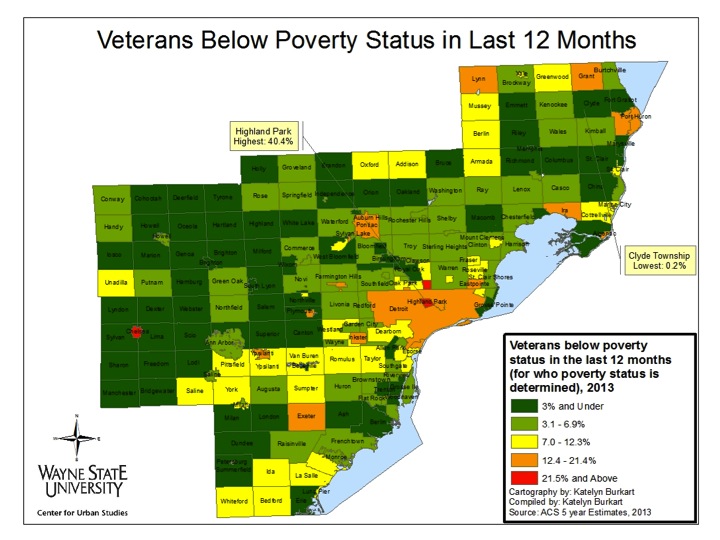
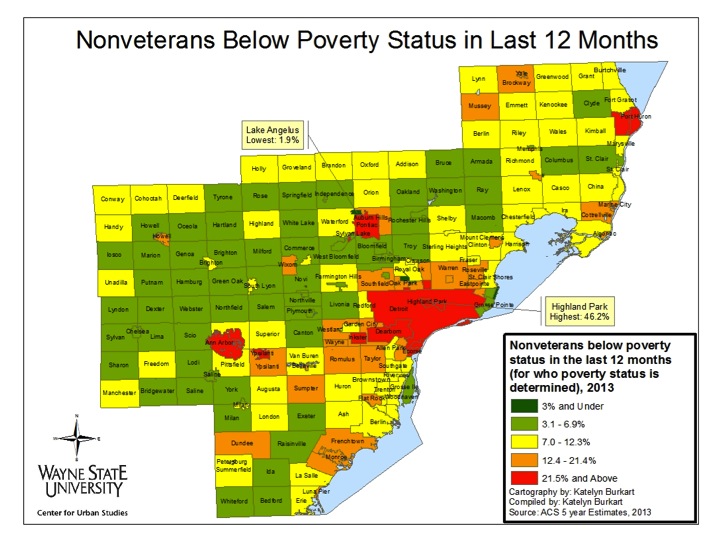
A lower percentage of veterans were below poverty status, compared to non-veterans throughout Southeastern Michigan. For both veterans and non-veterans, Highland Park had the highest percentage of residents below the poverty line: 46.2 percent of non-veterans and 25.2 percent of veterans. Only two other municipalities had more than 21.5 percent of veterans living below the poverty line: Chelsea (37.9%) and Hazel Park (27.7%). Clyde Township (0.2%) had the lowest percentage of veterans living below the poverty line.

While there were only three municipalities with 21.5 percent or more of veterans living below the poverty line, there were nine municipalities throughout the region where 21.5 percent or more of the non-veteran population was living below the poverty line. Such municipalities included Ecorse, Detroit, Pontiac, Ypsilanti and Port Huron.

Overall we see that while veterans appeared to fare better than non-veterans in terms of income and poverty status, and in some cases employment.

St. Clair County home to largest percentage of veterans in SE Michigan

Next weekend is the Fourth of July, so it’s a good to seek understanding of the veterans in Southeastern Michigan. The map below shows veterans as a percentage of the civilian population in the seven-county region in 2013. According to American Community Survey (ACS) five-year estimates, at the county level, St. Clair County had the highest percentage of veterans in 2013 (10.2%) while Washtenaw County had the lowest (6.1%). Broken down by municipality, the highest percentage of veterans were found in Lake Angelus in Oakland County (16.6%) and the lowest in Hamtramck in Wayne County (2.9%).

Nationally, veterans make up about 9.0 percent of the civilian population over 18. Michigan is average in this regard – veterans make up about 8.9 percent of the civilian population over 18 in the state.

In addition to recording whether or not a respondent served in the armed forces, the ACS further notes what era they served, with data available for five specific time periods: Gulf War II (defined as September 2001 and later), Gulf War I (August 1990 to August 2001), Vietnam War (August 1964 through April 1975), Korean War (September 1950 through January 1955), and World War II (December 1941 to December 1946).

For the state of Michigan as a whole, those who served during Gulf War II make up 7.1 percent of the total veteran population, those who served during Gulf War I make up 12.5 percent, Vietnam veterans make up 36.5 percent, Korean War veterans make up 12.1 percent, and those who served during WWII comprise 9.7 percent of veterans. (This does not add up to 100%, since there are many others who served outside of these specific time periods.) The maps below show the percentage of the veteran population by municipality who served in these various conflicts.

FOOTNOTES

According to National ACS 5-year estimates (2013), there was an adult civilian population of 236.5 million (adult meaning 18 years and over, civilian excluding active-duty service members et al.), and of that, 21.2 million were veterans = ~8.96%.

According to ACS 5-year estimates for the state of Michigan (2013), there was an adult civilian population of 7,577,743, of which 672,213 were veterans = ~8.87%.

Below is a chart listing the municipality in each county from which the highest percentage of the veterans served during each conflict. The percentages are of the total veteran population in that municipality for the period of conflict it is listed in.

One item of note is that although Hamtramck had the lowest percentage of veterans in their population, it had the highest percentage of Gulf War I veterans in Wayne County. This may be a product of refugees from Gulf countries that participated in that war. Similarly, although Washtenaw County as a whole has a low percentage of vets, Chelsea has a high percentage – with nearly half of all Chelsea veterans serving during either World War II or the most recent conflicts in the Middle East. Other clusters with a high percentage of vets across all eras include Memphis (St. Clair/Macomb counties) and the Orchard Lake/Sylvan Lake/Lake Angelus area of Oakland County.

The data presented in this post can be useful when planning specific outreach programs for veterans based on age or time period of service.