How Much of Your County Budget Goes to the Sheriff’s Department?

A government entity’s budget is the document that spells out its priorities, both for the coming year and the future. The general fund is the primary fund used by a government entity and includes all general purpose in-and-out flows of revenues and expenditures that do not include special purpose, or enterprise, funds. At the county level in Southeastern Michigan the general fund budgets may be hundreds of million dollars, being larger for counties with larger population sizes. For example, in Wayne County the projected general fund budget for fiscal year 2021 is about $580 million while Macomb County’s proposed general fund budget for 2021 is $274.5 million, and Monroe County’s is about $46.8 million. Those general fund budgets, and the budgets of the other counties in the region, include personnel and operational costs for the counties. Typically, sheriff’s departments have among the highest departmental budgets in a county, with personnel and related costs making up majority of their expenditures. From road patrol to jail personnel to marine patrol to office support, the amount allocated out of a sheriff’s department budget covers various aspects. According to Statisa, major municipalities spend 20-45 percent of their general fund budgets on police related matters. The data in this post shows the general fund share of Sheriff’s Departments and is in line with that statistic.  It further shows that policing and jail operations at the County level are high-level priorities, according to  the percentage each sheriff’s department in Southeastern Michigan makes up of the corresponding general fund.

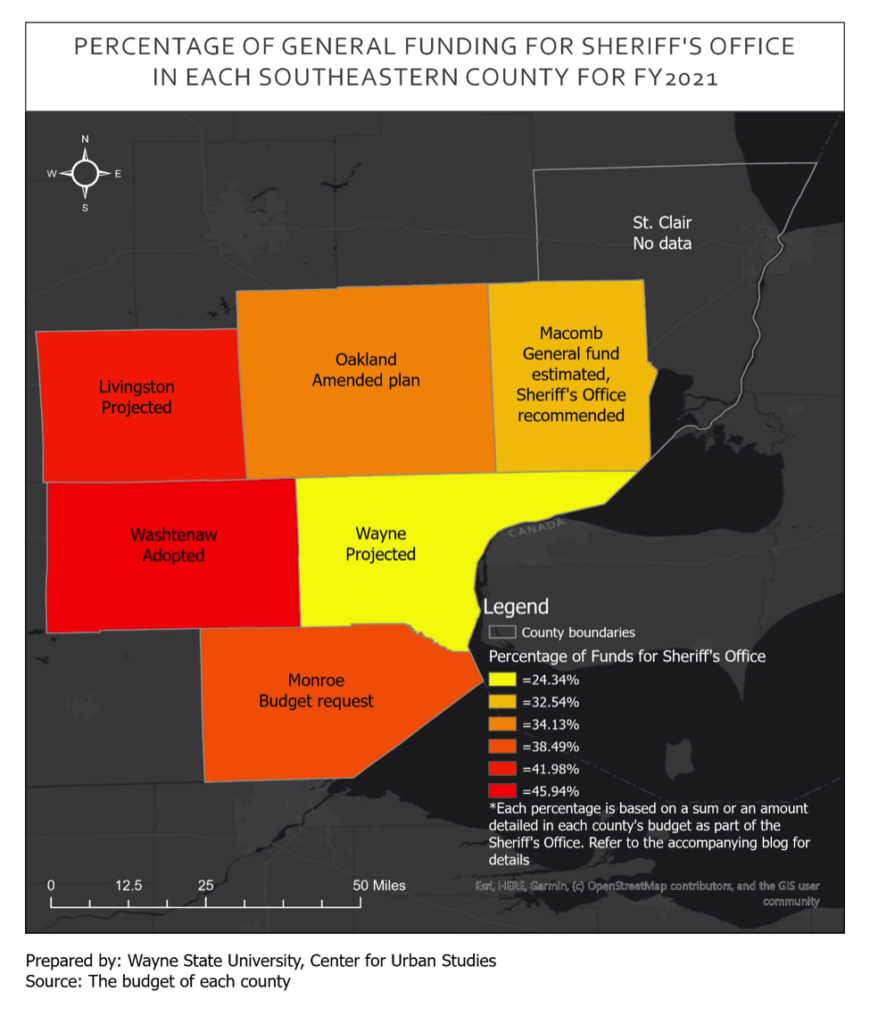
As shown in the map above 24-46 percent of each county’s general fund is allocated to the sheriff’s department (only Washtenaw and Oakland counties currently have adopted budgets for 2021, the others are proposed and/or projected). It should also be noted that much of those allocated funds do not include forfeiture or other special enterprise funds a sheriff’s department may have access to. Each department’s budget isn’t identical to its neighboring counties’, so while comparing each local sheriff’s department’s spending out of the General Fund is not apples-to-apple, it does provide a solid glimpse into each county’s priorities in spending. According to our research, the percentage of funds allocated to the sheriff’s department from the general fund in Washtenaw County is the highest at 46 percent; this is equivalent to about $57.1 million and includes the sheriff’s department, the corrections department and the emergency services department. Washtenaw County does not present its budget in a roll-down line item manner, which provides the greatest amount of detail, so exact reasons as to why it has the highest percentage of its general fund allocated to the sheriff’s department is not explicitly known. In the Washtenaw County budget though it did address how the department contracts with various municipalities for policing services; this brings in revenue but also in response causes expenditures as well. Contracted policing services are likely one of several reasons why the budget allocation percentage is 46 percent. Revenue from a public safety and mental health millage to support sheriff’s operations could also be related to the corresponding expenditures. Finally, the county also runs a central dispatch center. The Livingston County Sheriff’s Department is the only other one locally where more than 40 percent of the county’s general fund is allocated to the sheriff’s department. In Livingston County 42 percent of the general fund, or $51.4 million, is allocated.

Wayne County has the lowest percentage of general funds allocated to the sheriff’s department at 24 percent, or $141.3 million. For Wayne County, these allocated funds include those for the operation of the county jail (the building of the new jail is funded separately), non-jail services, sheriff court services and those related to the sheriff’s executive team. Macomb County has the second lowest percentage allocated at 33 percent, or $89.3 million. The funds allocated to the sheriff’s department in Macomb County include the patrol, jail and marine personnel, jail operations and other related items. In Oakland County 34 percent of the general fund ($165.9 million) is allocated to the sheriff’s department, and this includes corrective services, emergency communication services and emergency response and preparedness. Monroe County allocates 38 percent of its general fund budget to the sheriff’s department. Monroe County’s allocation includes road patrol, contracting with local municipalities and school units, marine safety and the jail; this totals $18 million.

The budget information available for St. Clair County was from previous years; current data was requested but not received.

While this post highlights budget spending priorities on policing and jail services in Southeastern Michigan, it also shows how budgeting from one local unit of government to another differs and can distort how much one department is actually receiving or expending. Reasons such as these are among many that explain why the public should pay close attention to how their local governments’ budgets and what the funds are allocated to. A budget document sets the priorities, and if the public speaks up, the priorities in your community can be shifted, as can the funds to support them. 

WSJ: 28 percent of Wayne County homes are worth less than their mortgage balance

The Wall Street Journal recently posted an interactive map that shows the percentage of homes in counties across the nation that were worth less than what was owed on them during the first quarter of 2015. Here, we see that in Wayne County 28 percent of homes were worth less than the mortgage balance on them. In Oakland County that number was 13 percent and in Macomb County 17 percent of homes were worth less than what is owed on them.

More than 50 percent of Wayne County children on Medicaid

Medicaid and MI Child are two different programs that provide children in the state of Michigan with the opportunity to have health care coverage. Medicaid is a federal health care coverage program that provides services to about 43 million children nationally; it is jointly funded by the federal government and each state. In Michigan, a child is automatically referred to the Healthy Kids Medicaid Program (Michigan’s child Medicaid program) if their family’s annual income is at or below 150 percent of the Federal Poverty Level, according to the Michigan Department of Community Health.

MI Child is Michigan’s version of the Child Health Insurance Program (CHIP), a federal initiative created by Congress in 1997 that is offered to uninsured children, ages 19 and below, of working parents. This program is also jointly funded by the federal government and states but its match rate, according to Medicaid.gov is typically about 15 percent higher than Medicaid; according to the Michigan League for Public Policy funding for this program is currently at risk. According to the Michigan League for Public Policy, this program was created to provide children with quality healthcare when their family earns too much to qualify for Medicaid but cannot afford private coverage. To qualify for MI Child, the child must have no comprehensive health insurance and the parents must have a gross adjusted income between 160-212 percent of the Federal Poverty Level, according to the MI Child Manual. For a family of four to be eligible for MI Child, the annual income limit is $47,700, according to the Michigan Department of Community Health.

In the maps below we see that there is a higher percentage of children covered by Medicaid in Southeastern Michigan than on MI Child. Also, while Wayne County had the highest percentage of children on Medicaid, Macomb County had the highest percentage of children with MI Child as their health insurance coverage plan. Overall though, each county had a higher percentage of children with Medicaid coverage than with MI Child coverage. This means that among those who applied for government health care coverage for their child, there was a higher percentage of families with income levels at or below 160 percent of the Federal Poverty Level than families with a gross income level between 160-212 percent of the Federal Poverty Level.

In the seven county region of Southeast Michigan, Wayne County had the highest percentage of children with Medicaid coverage in 2013, according to the Michigan League for Public Policy. In total, 55.5 percent of children aged 19 and under in Wayne County received Medicaid coverage in 2013. This amounted to about 258,000 children. The county with the second highest percentage of children receiving Medicaid coverage in the region in 2013 was St. Clair (42 percent or approximately 16,250 children).

Livingston County had the lowest percentage of children receiving Medicaid coverage with 18.5 percent in 2013. That same year, 40.8 percent of Michigan children received Medicaid coverage.

As noted, MI Child is Michigan’s version of the CHIP initiated by Congress in 1997 to provide healthcare to children who don’t qualify for Medicaid but whose families cannot afford private insurance. In the region, the percentage of children with MI Child coverage is smaller than those with Medicaid. For example, Macomb County had the highest percentage of children with MI Child coverage in the region in 2013 at 2.4 percent. During the same time period, 35.8 percent of Macomb County children received Medicaid coverage. Of the counties examined, Washtenaw County had the lowest percentage of children aged 19 and under receiving MI Child coverage in 2013 at .9 percent.

Opting-Out limits manufacturing employment opportunities for the transit dependent

James Robertson, has been coined Detroit’s “walking man” because of his tenacity in earning a perfect attendance mark at his suburban factory job all while walking nearly 21 miles round trip from Detroit to Rochester Hills. Without a car, Robertson must hobble together a defunct set of bus routes, leaving him no choice but to walk most of the distance into the Detroit suburbs. This story is surely one of many in the Metro-Detroit are, begging the question: Why is the public transit system in the Detroit area far less than mediocre?

Drawing Detroit sets out to illustrate the issue and to discuss how allowing communities to opt out of transit service can limit employment opportunities and create a situation of economic injustice.

Below is a map showing the number of manufacturing employees reported to the 2012 Economic Census of the U.S. Census Bureau in 2012 along with the transit status of communities in Wayne and Oakland counties. Aside from the Detroit Department of Transportation, the only existing transit system that is close being considered somewhat regional is Suburban Mobility Authority for Regional Transit (SMART). SMART has bus lines that run throughout Wayne, Oakland and Macomb counties. In Wayne and Oakland counties municipalities have the option to either opt-in or opt-out supporting SMART, and therefor having it run through their community. In Oakland, the majority of communities-55 percent of 33 of 60- have opted out. In Macomb County, all municipalities support SMART; they do not have the option to opt-out. Because of this, they are irrelevant to the discussion.

Some critics of the Free-Press article on Robertson indicated that there has been little need for low-skill workers in Detroit and other poorer communities to travel into these opt-out communities for employment or otherwise, characterizing these suburbs as bedroom communities with limited job prospects for transit-dependent workers. A quick examination of the map below indicates this is a fallacy. Many manufacturing jobs have moved to the suburbs, following its workforce and also seeking out new facilities and campuses in unsettled areas. Opt-out communities including Oxford Township, Novi and Canton have in excess of 2,000 manufacturing jobs located in their boundaries; Livonia had 9,447 manufacturing jobs in 2012.

In total, 38,461 manufacturing jobs were located in opt-out communities in these two counties, representing 34.1 percent of all manufacturing jobs in the two-county area. Broken down by county, it is 29.6 percent (19,484 manufacturing jobs) of Wayne County’s manufacturing employment and 40.6 percent (18,977 manufacturing jobs) of Oakland’s manufacturing employment.