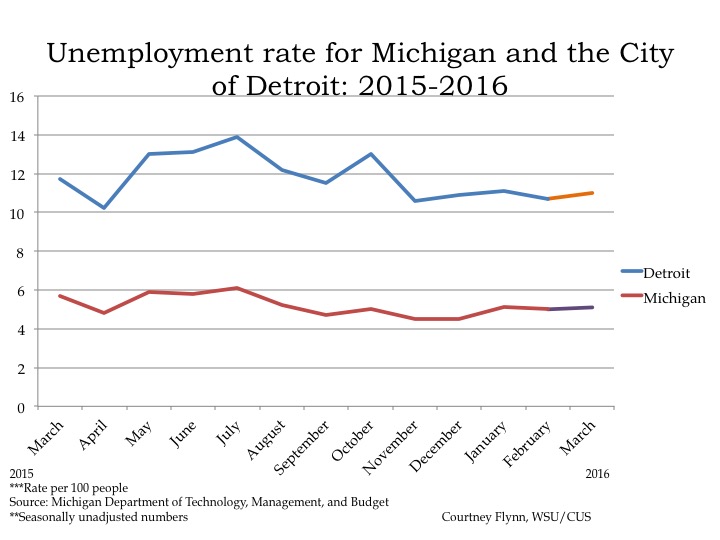
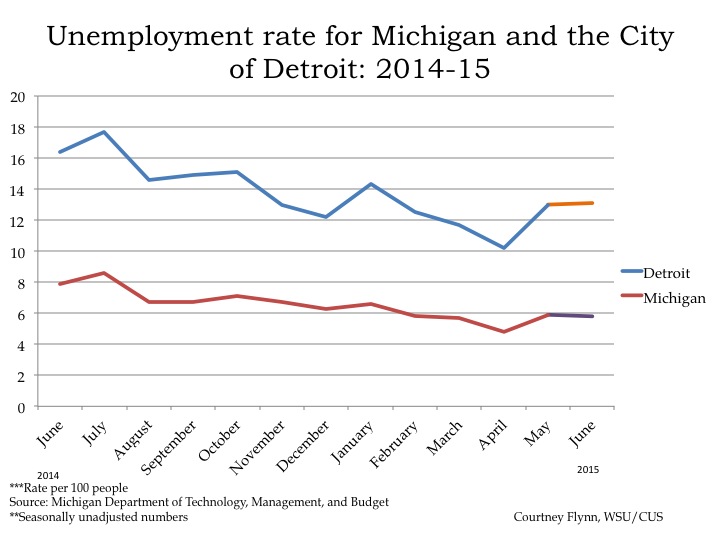
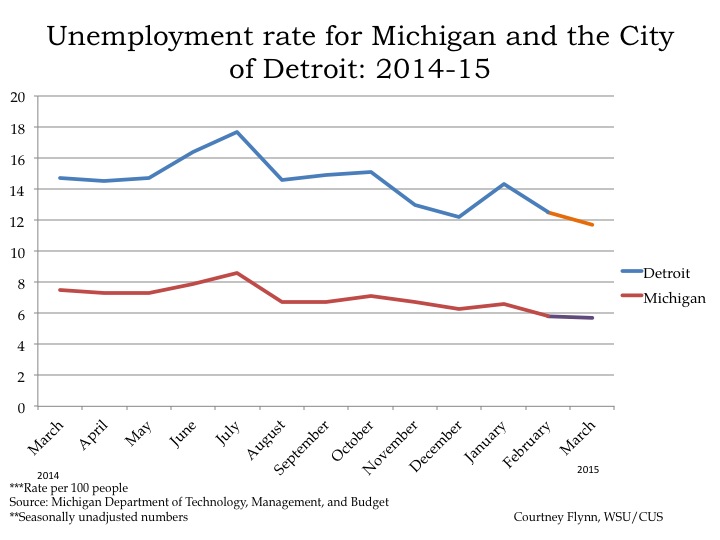
- The unemployment rate across the state remained stagnant while the rate in the city of Detroit decreased (monthly);
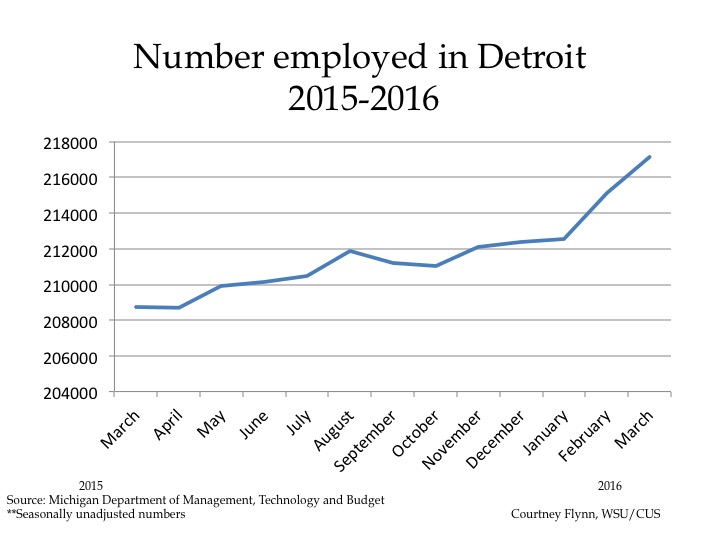
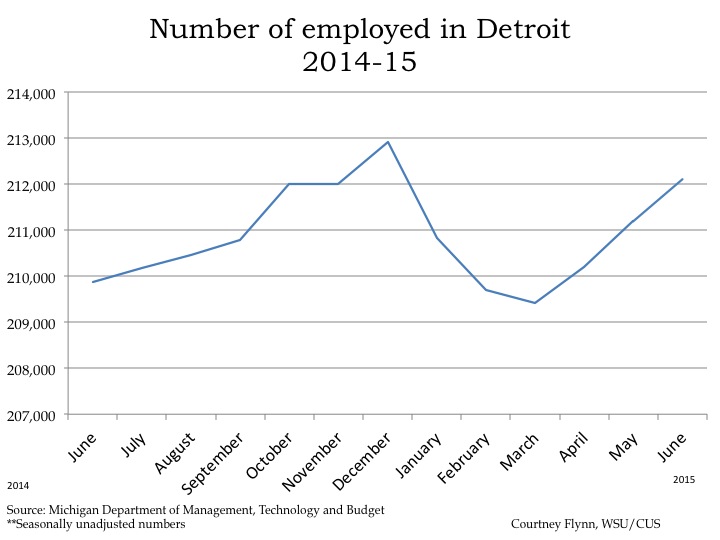
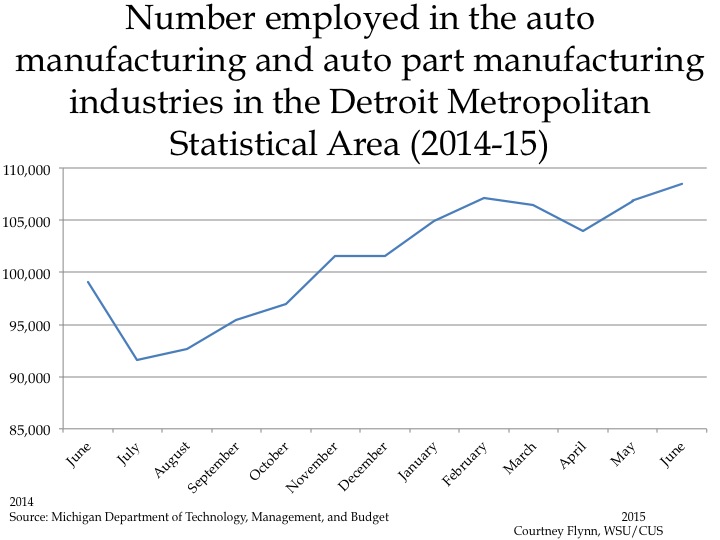
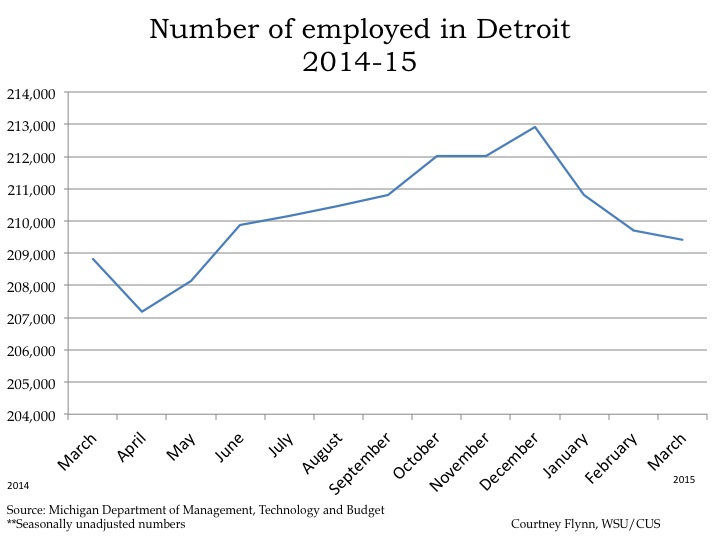
- The number of employed Detroit residents increased, (monthly);
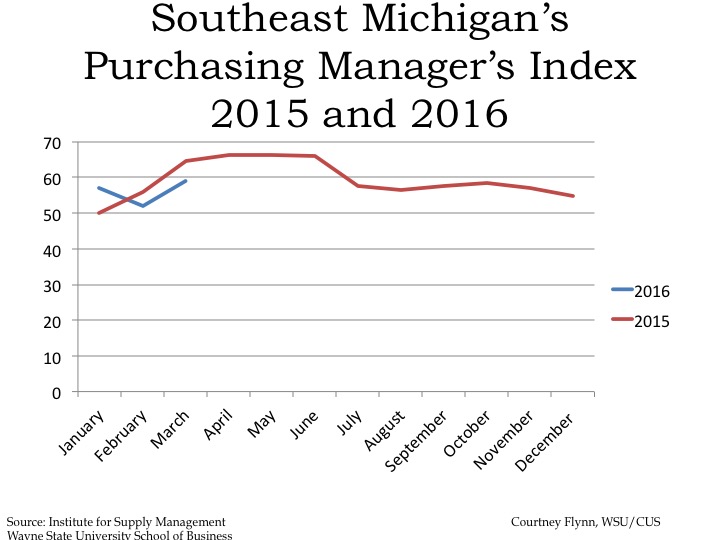
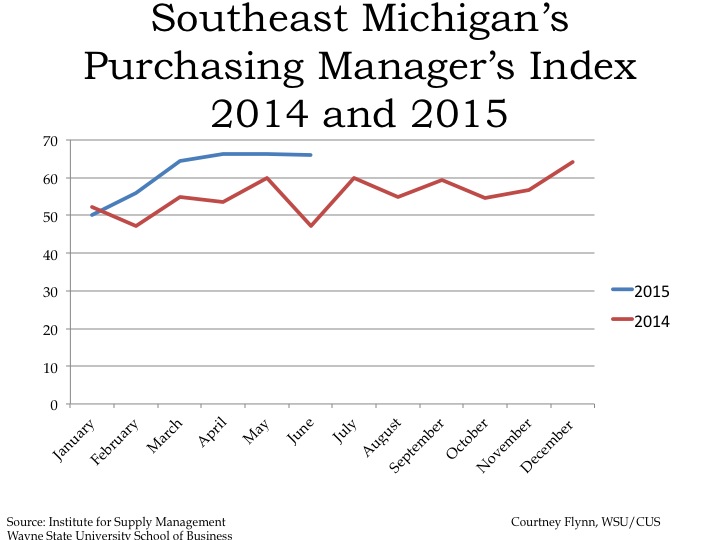
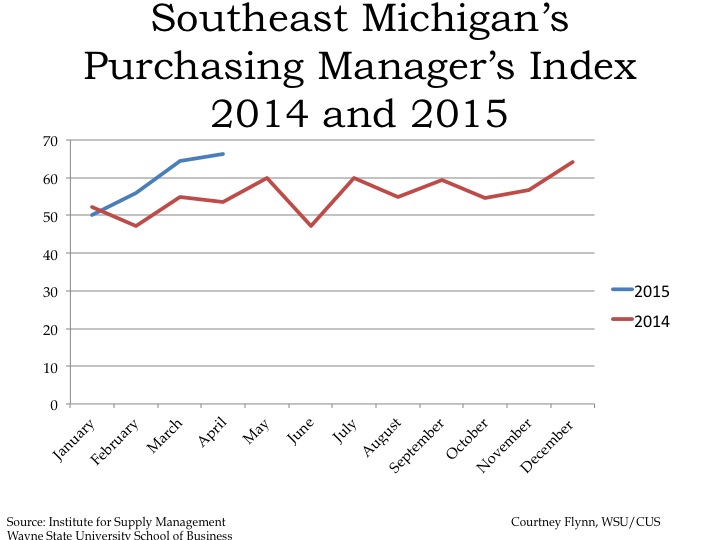
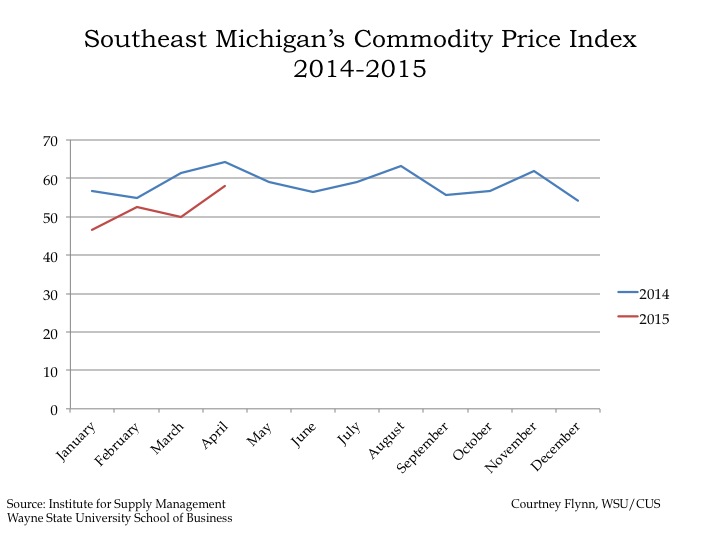
- The Purchasing Manager’s Index for Southeastern Michigan remains strong, especially after increasing 7 points (monthly);
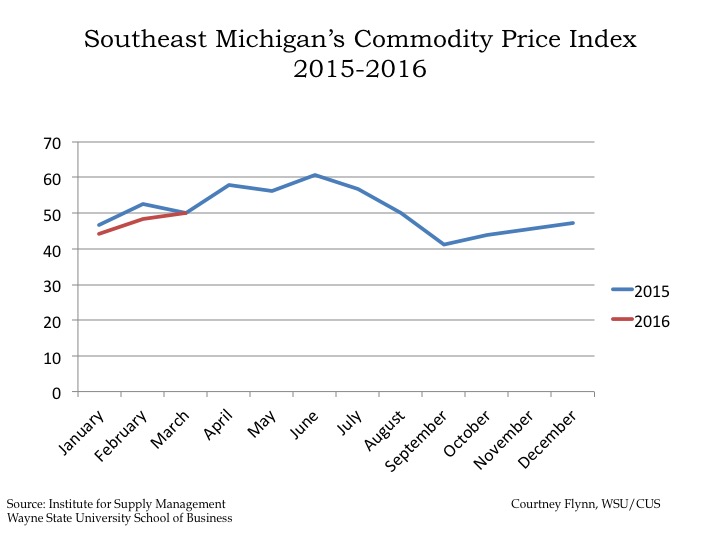
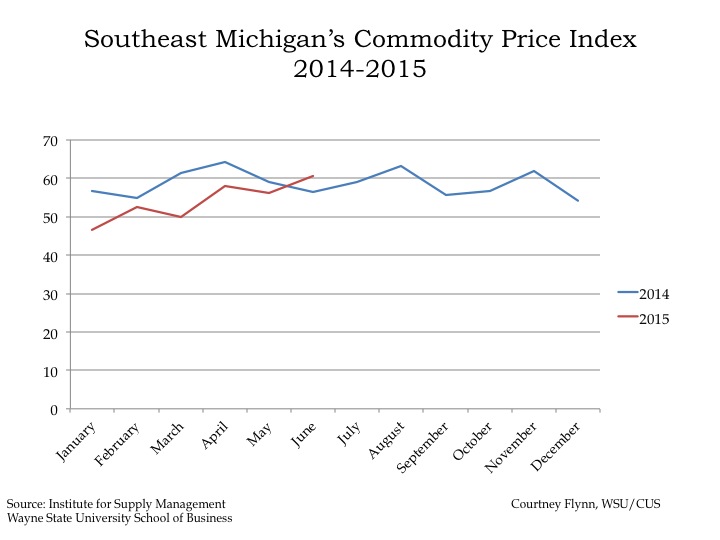
- The Commodity Price Index remained the same (monthly);
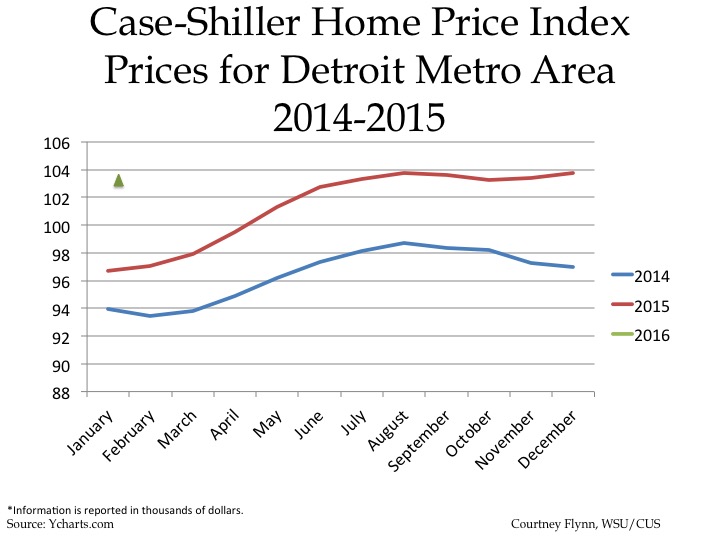
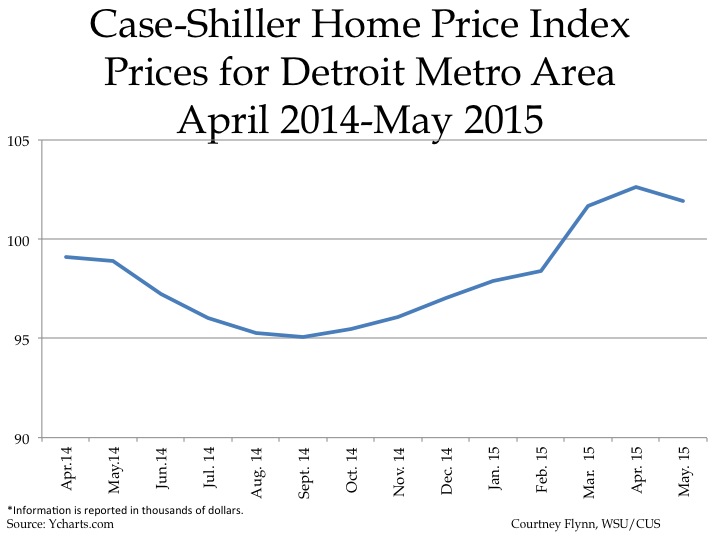
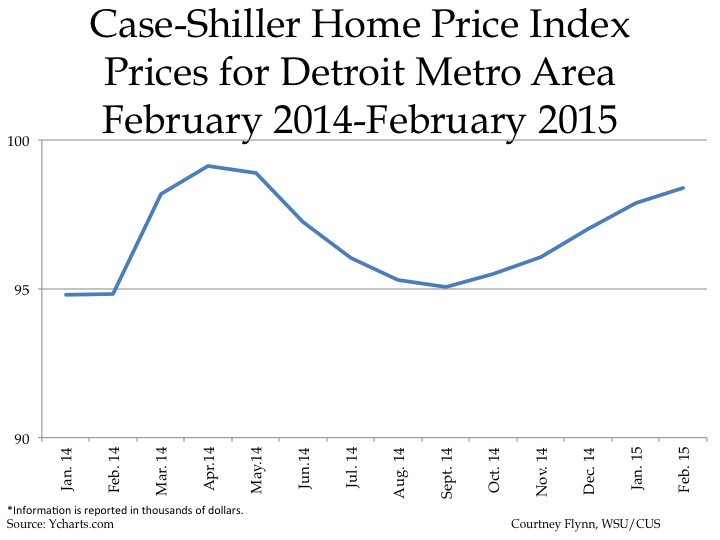
- The Standard and Poor’s Case-Shiller Home Price Index for the Detroit Metropolitan Statistical Area shows home prices continue to increase monthly and annually.
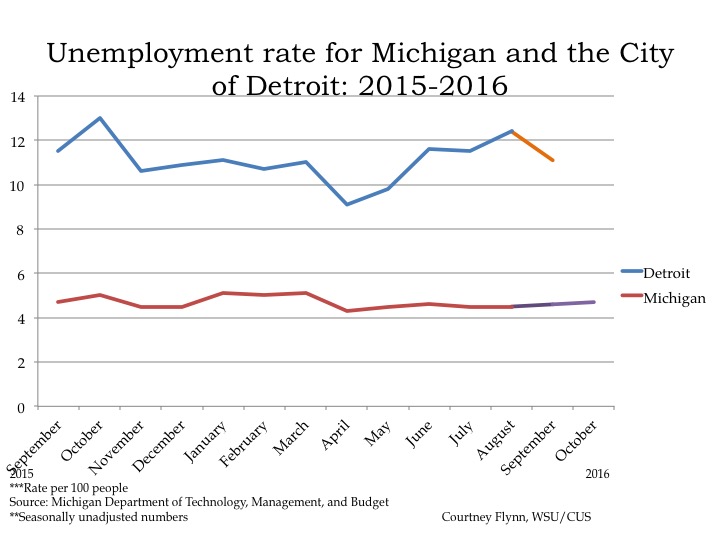
According to the most recent data provided by the Michigan Department of Technology, Management and Budget, the unemployment rate for the State of Michigan slightly increased to 4.7 in October of 2016 from 4.6 the previous month. However, unemployment in the City of Detroit decreased to 11.1 in September, from 12.4 the previous month. The September unemployment rate in 2016 was 0.4 points lower than it was in September of 2015.
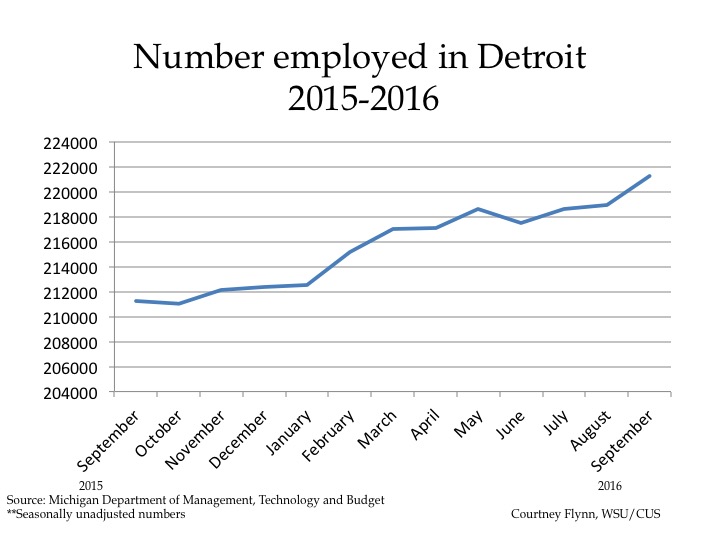
In September of 2016 the number of employed Detroit residents rose to 221,238, an increase of 2,314 from August. Between September of 2016 and September of 2015 there was a total increase of 10,012 employed Detroit residents, according to the Michigan Department of Technology, Management and Budget.
While the number of employed Detroit residents increased between August and September the labor force decreased by 1,067. In August the labor force was reported to be 250,047 and in September it was reported to be 248,971.
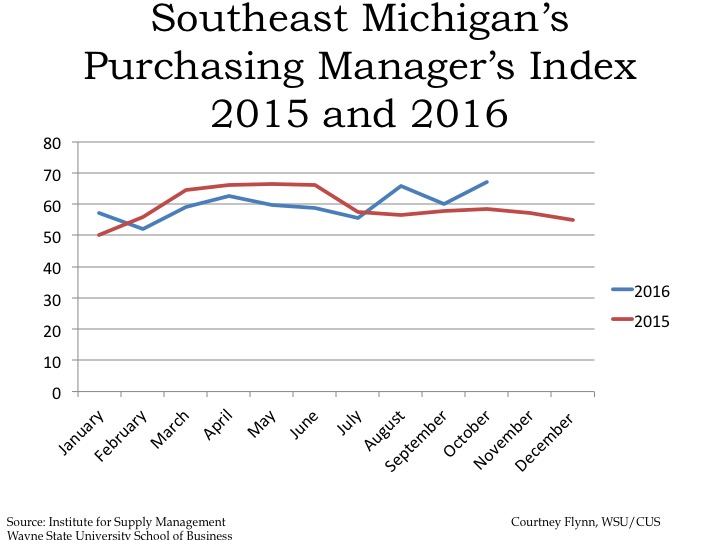
The Purchasing Manger’s Index (PMI) is a composite index derived from five indicators of economic activity: new orders, production, employment, supplier deliveries, and inventories. A PMI above 50 indicates the economy is expanding.
According to the most recent data released on Southeast Michigan’s Manager’s Index, the PMI for October 2016 was 67.2, an increase of 7 points from the prior month. The October 2016 PMI was an increase of 8.4 from the previous year. With this increase, the PMI is considered to be strong, particularly because it has remained above 50 since June of 2014. Much of this growth, according to the Institute of Supply Management of Southeastern Michigan, is due to the resurgence of the auto sector in the region.
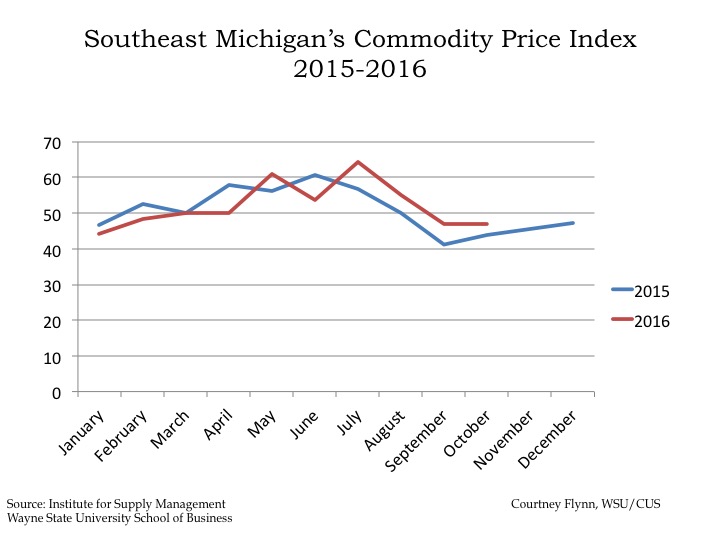
The October 2016 Commodity Price Index decreased 0.2 points from September but increased 3.2 points from the prior year. The three month average for the Commodity Price Index was 48, which the Institute of Supply Management of Southeastern Michigan states is good for short-term profits.
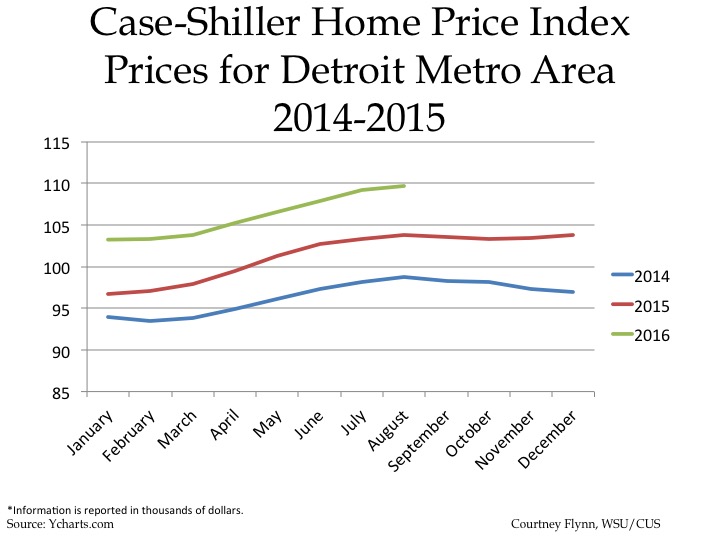
The above charts show the Standard and Poor’s Case-Shiller Home Price Index for the Detroit Metropolitan Statistical Area. The index includes the price for homes that have sold but does not include the price of new home construction, condos, or homes that have been remodeled.
According to the index, the average price of single-family dwellings sold in Metro Detroit was $109,660 in August 2016. This was an increase from $103,750 from August of 2015 and an increase from $98,720 from August of 2014.