Unemployment Rates in Detroit,Region Take Recent Drop, Higher Than Previous Year

  • The unemployment rate decreased in Detroit and at the state level(monthly);
  • Regionally, April 2018 unemployment rates are higher than the prior year;
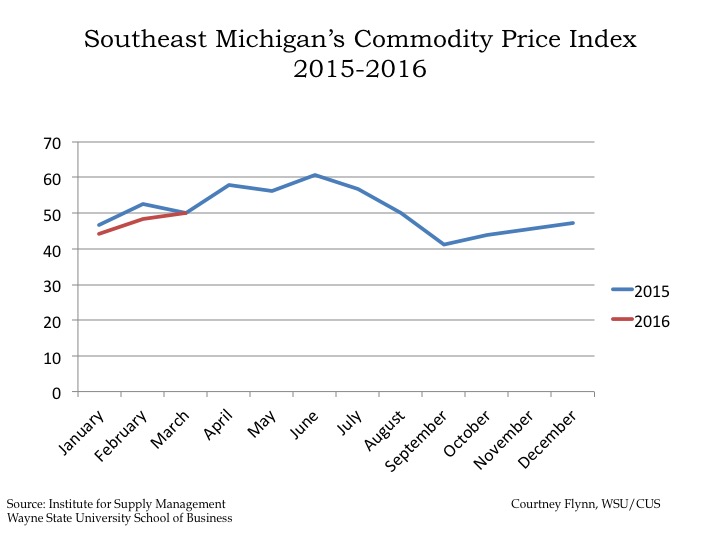
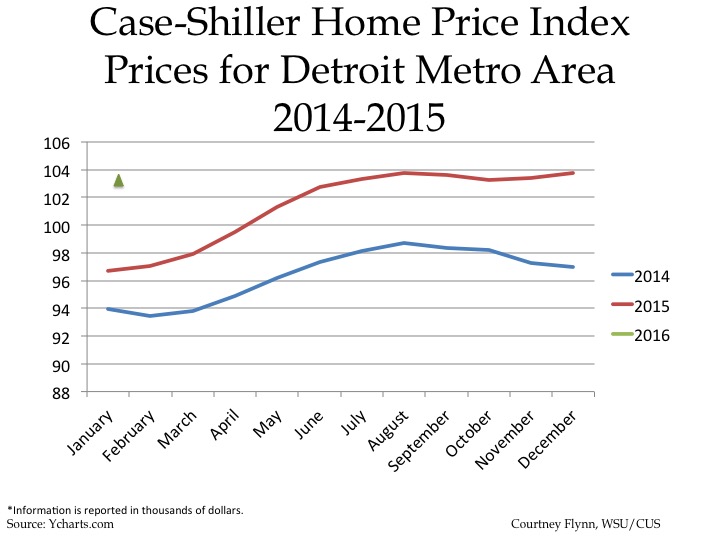
  • Housing prices continue to rise in Metro-Detroit.

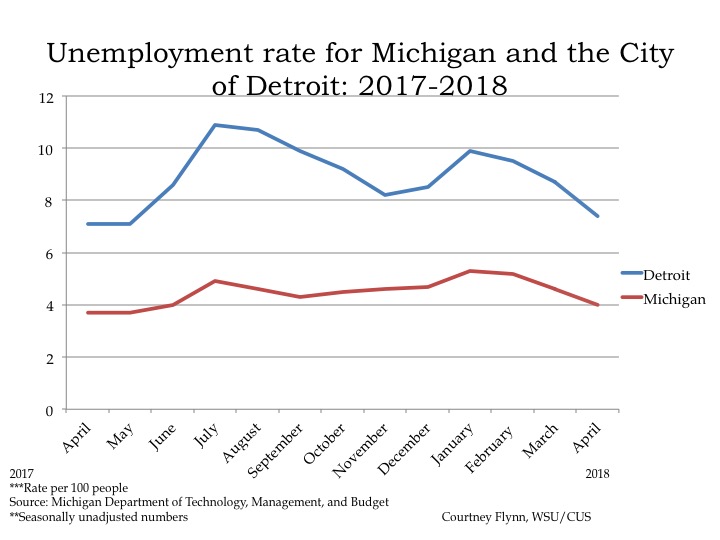
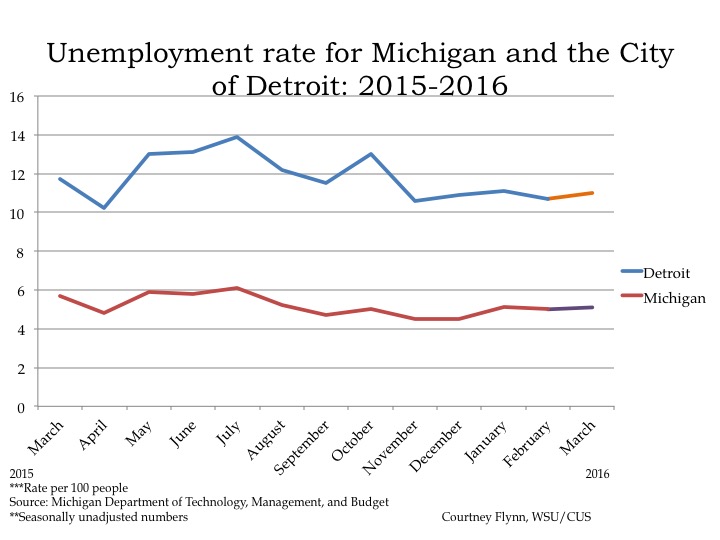
In April of 2018 the unemployment rate for the State of Michigan was 4, a decrease from the March unemployment rate of 4.6, according to the most recent data provided by the Michigan Department of Technology, Management and Budget. The State unemployment rate for April was 0.3 point above what it was in April of 2017.

The Detroit rate was 1.3 points lower in April of 2018 than in March. In April of 2018 Detroit’s unemployment rate was reported to be 7.4, this was .3 points higher than in April of 2017.

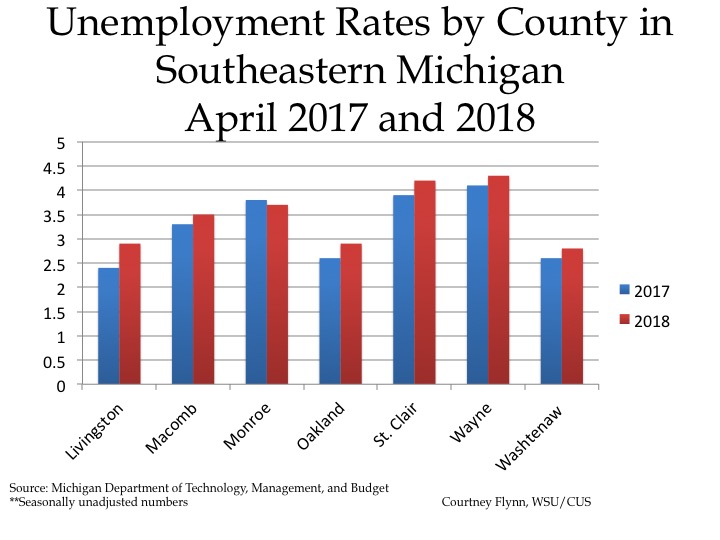
The chart above displays the unemployment rates for each of the seven counties in Southeastern Michigan for April of 2017 and 2018. Monroe County was the only one in the seven county region to have a lower unemployment rate in 2018 than in 2017. In April of 2017 Monroe County’s unemployment rate was 3.7 and in 2018 in dropped slightly to 3.7.

In April of 2018 Wayne County had the highest unemployment rate at 4.3, St. Clair County was only slightly below at 4.2. These two counties were the only two in the region to have unemployment rates about 3.5 in April of 2018. Washtenaw County had the lowest unemployment rate in the region at 2.8. Oakland County and Livingston County were the only other two counties in the region with an unemployment rate below 3.

While Livingston County had among the lowest unemployment rate in the region in April of 2018 it also had the largest increase in its unemployment rate between April 2017 and April 2018. In April 2017 the unemployment rate for Livingston County was 2.4 and in 2018 it increased to 2.9.

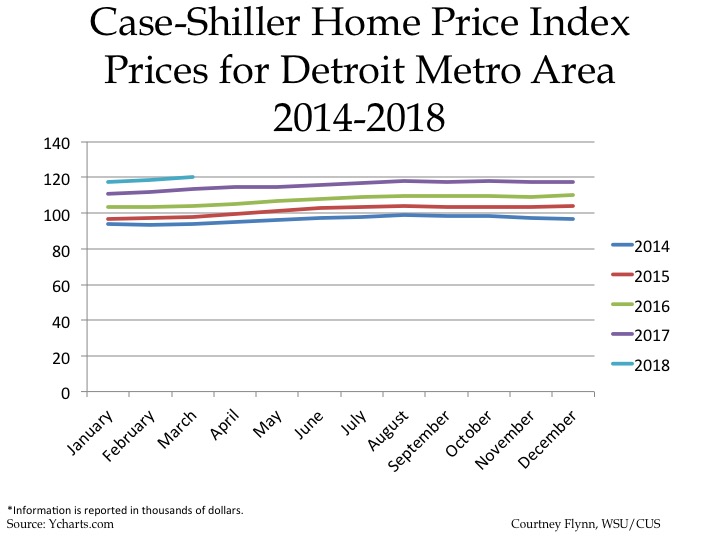
The above chart shows the Standard and Poor’s Case-Shiller Home Price Index for the Detroit Metropolitan Statistical Area. The index includes the price for homes that have sold but does not include the price of new home construction, condos, or homes that have been remodeled.

According to the index, the average price of single-family dwellings sold in Metro Detroit was $120,020 in March 2018; this was $1,220 higher than the average family dwelling price in February. The March 2018 price was an increase of $16,240 from March of 2016 and an increase of $22,120 from March of 2015 and an increase of $26,240 from March of 2014.

Employment in Detroit Growing, While Unemployment also Increased

  • From December 2015 to March 2016, the unemployment rate across the state remained stable while the city of Detroit’s experienced a slight increase (monthly);
  • Employment in the city of Detroit increased by 8,407 from March 2015 to March 2016 (monthly);
  • The Purchasing Manager’s Index for Southeastern Michigan increased from February 2016 to March 2016 (monthly);
  • Commodity Price Index increased from February 2016 to March 2016 for Southeastern Michigan (monthly)
  • Standard and Poor’s Case-Shiller Home Price Index for the Detroit Metropolitan Statistical Area shows home prices are about $6,900 higher than in January of 2015.

Detroit Unemployment

According to the most recent data provided by the Michigan Department of Technology, Management and Budget, the unemployment rate for the State of Michigan increased to 5.1 percent between December of 2015 and March of 2016. During this same period, unemployment in the City of Detroit marginally increased from 10.9 percent in December to 11 percent in March.

Detroit Employed

Since March of 2015 the number of employed Detroit residents in the labor force increased by 8,407, to a total of 217,137 in March of 2016. While the month of March in 2015 had the lowest number of Detroit residents employed in the labor force in the last year, March in 2016 has had the highest number of people employed for 2016.

The conundrum of increasing employment and increasing unemployment likely is a result of more people entering the labor market in the city, creating a situation in which more are employed, but more are also looking for work.

Detroit Manufacturing

The above chart shows the number of people employed in the auto manufacturing industry in the Detroit Metropolitan Statistical Area (MSA) (Detroit-Warren-Livonia) from March 2015 to March 2016. In that time frame the number of people employed in this industry has increased by 300, from 93,100 to 93,400.

PMI

The Purchasing Manger’s Index (PMI) is a composite index derived from five indicators of economic activity: new orders, production, employment, supplier deliveries, and inventories. A PMI above 50 indicates the economy is expanding.

According to the most recent data released on Southeast Michigan’s Manager’s Index, the PMI for March 2016 was 59.1, an increase of 7.1 point from the prior month. This increase is largely representative of the region’s employment, new order and production indexes increasing.

The March PMI was also a decrease of 5.4 from March of 2015.

Commodity Price

The Commodity Price Index, which is a weighted average of selected commodity prices, was recorded at 50 points in March 2016, which was 1.6 points higher than the previous month and exactly the same as what it was in March of 2015.

Detroit Home Price

The above charts show the Standard and Poor’s Case-Shiller Home Price Index for the Detroit Metropolitan Statistical Area. The index includes the price for homes that have sold but does not include the price of new home construction, condos, or homes that have been remodeled.

According to the index, the average price of single-family dwellings sold in Metro Detroit was $103,590 in January 2016. This was an increase of $6,890 from January of 2015 and increase of $9,670 from January of 2014.