Michigan’s Energy Consumption Tops its Production

https://forms.office.com/r/WZB2vvRXNt

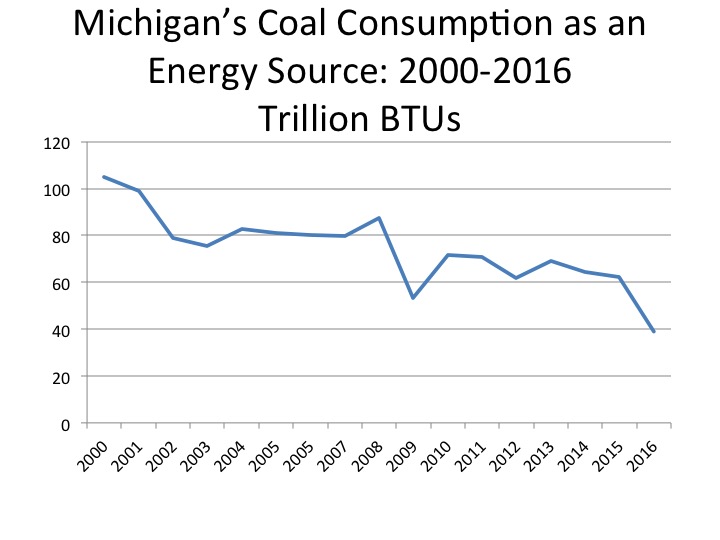
In Michigan, we consume more energy, overall, than we produce, and the type of energy we produce is more limited than the types of energy sources we consume. For example, according to the Energy Information Administration (EIA), Michigan does not produce any coal for energy. However, in 2020, according to the EIA, 334.4 trillion BTUs were consumed. The coal powered energy consumed in Michigan is brought in from elsewhere, primarily Wyoming and Montana.

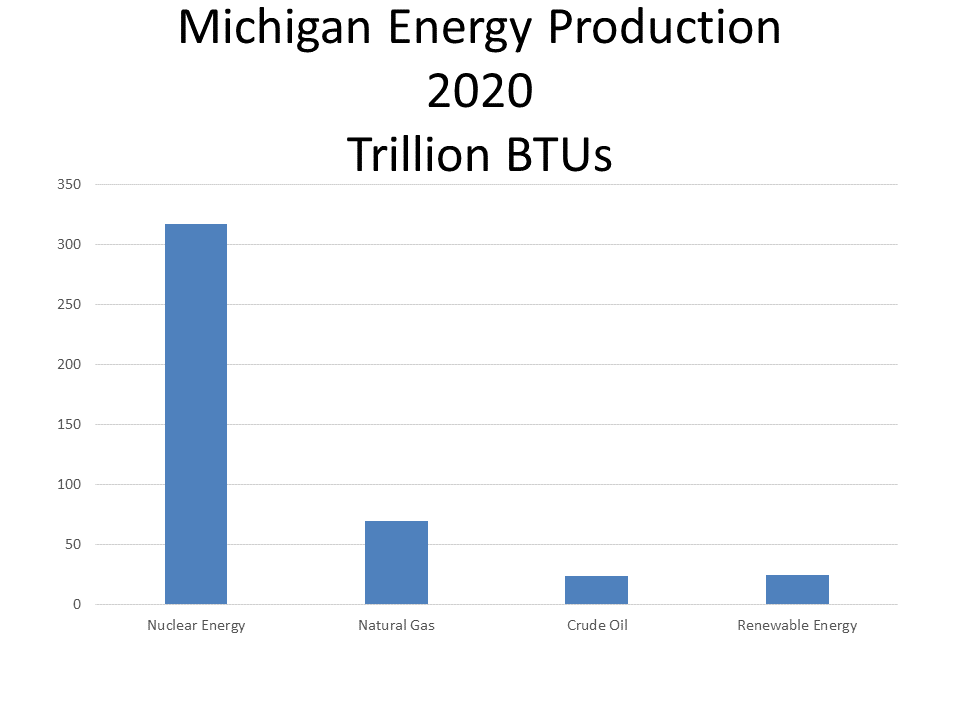
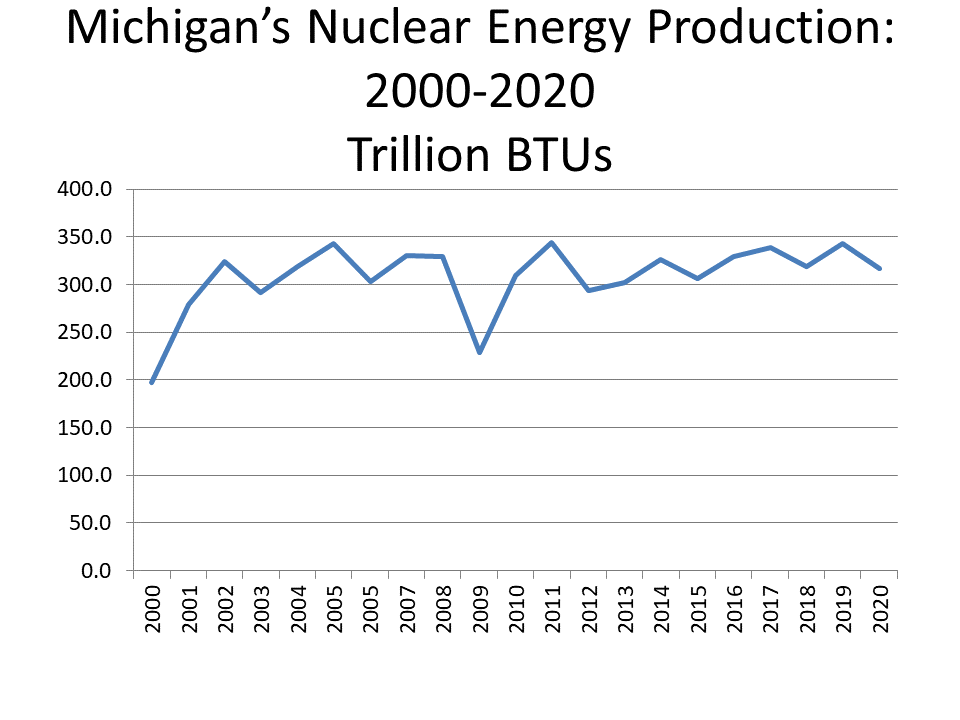
The largest energy source produced in Michigan is nuclear energy, with 316.7 trillion BTUs being produced in 2020. The amount of nuclear energy produced in 2020 is nearly a third more than what was produced in 2000; in 2000 196.9 BTUs of nuclear electricity was produced in Michigan. In the last 20 years, the largest amount of nuclear energy produced in Michigan was 344.2 trillion BTUs in 2011.

In 2020 there were three nuclear power plants in Michigan. However, in May of 2022 one of the nuclear power plants shut down. We will dig deeper into Michigan’s nuclear power next week.

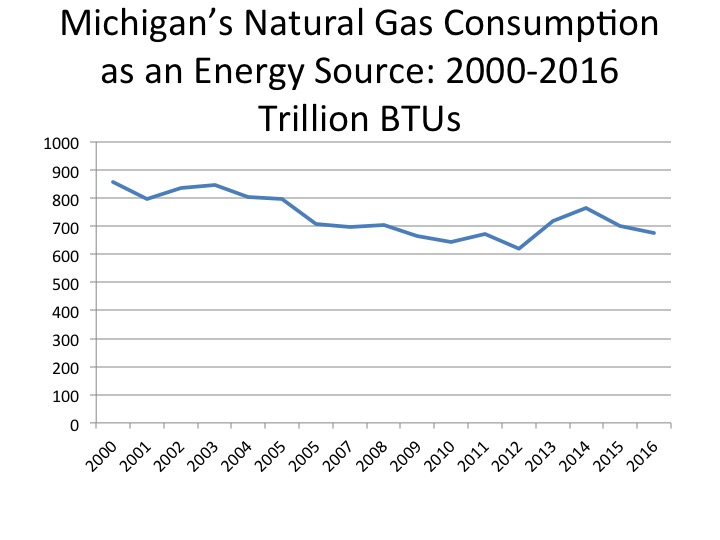
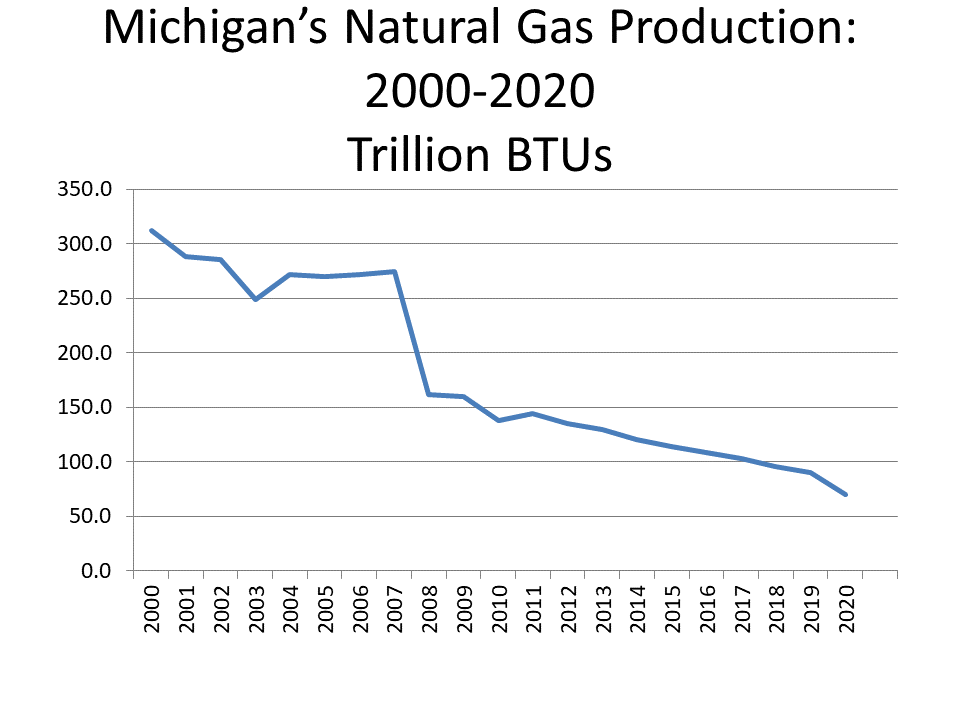
While nuclear energy most recently reigned supreme in energy production totals, at one-point, natural gas was the largest energy source in Michigan. The amount of natural gas energy produced in Michigan reached its peak production at 312 trillion BTUs in 2000. Since then, the amount produced has steadily declined. Between 2007 and 2008 the amount of natural gas produced in Michigan declined from 275 trillion BTUs to 162 trillion BTUs. By 2020, the amount produced was 69.9 trillion BTUs. Overall, between 2007 and 2020 the amount of natural gas produced in Michigan declined by 204.7 trillion BTUs.

In 2020, Michigan ranked 19th in the amount of natural gas produced.

Crude oil production has ranged between 45 and 24 trillion BTUs since 2000, with a steady decline happening since 2013. According to the EIA, Michigan ranked 18th out of the 50 states for crude oil production in 2020. In 2020, 24 trillion BTUs of crude oil was produced.  This is a decrease from the 45.9 trillion BTUs produced in 2000.

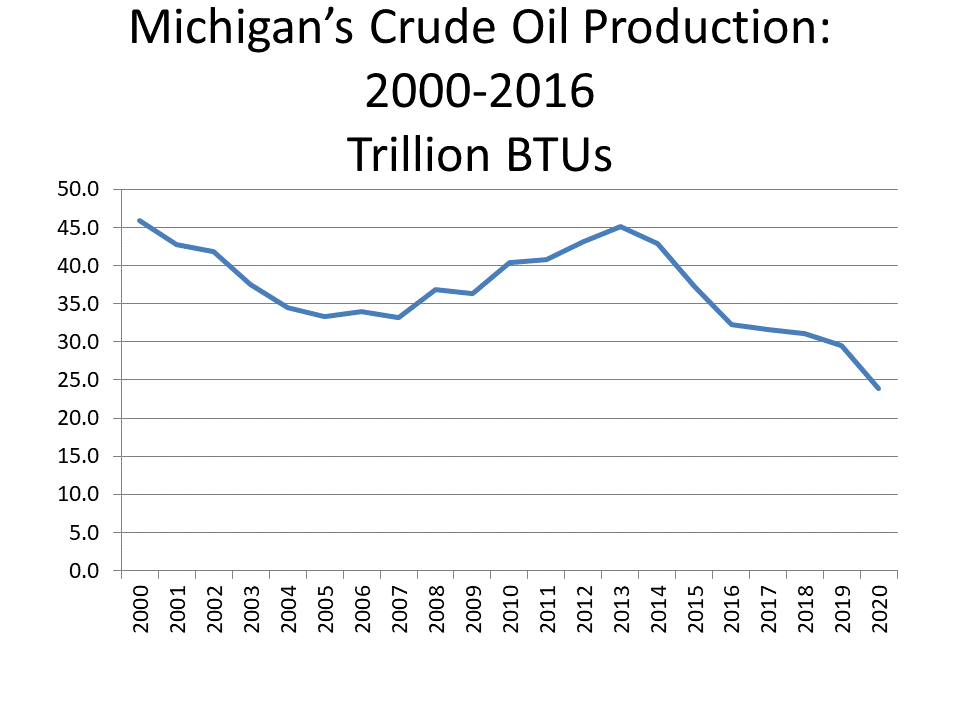
Crude oil production in the state comes from reserves; in 2020 about 4.5 million barrels of crude oil were produced compared to the 34.7 million barrels that were produced in 1979.  Please note the chart references BTUs, while barrels of crude oil is another measurement used to detail production of this energy source.
The amount of renewable energy produced in Michigan has grown since 2000, outclimbing energy production numbers of crude oil and natural gas. In total in 2020, according to the EIA, 225 trillion BTUs of renewable energy was produced. While this was a slight decrease from 237 trillion BTUs produced two years earlier, it is still an increase overall in the amount of renewable energy produced.

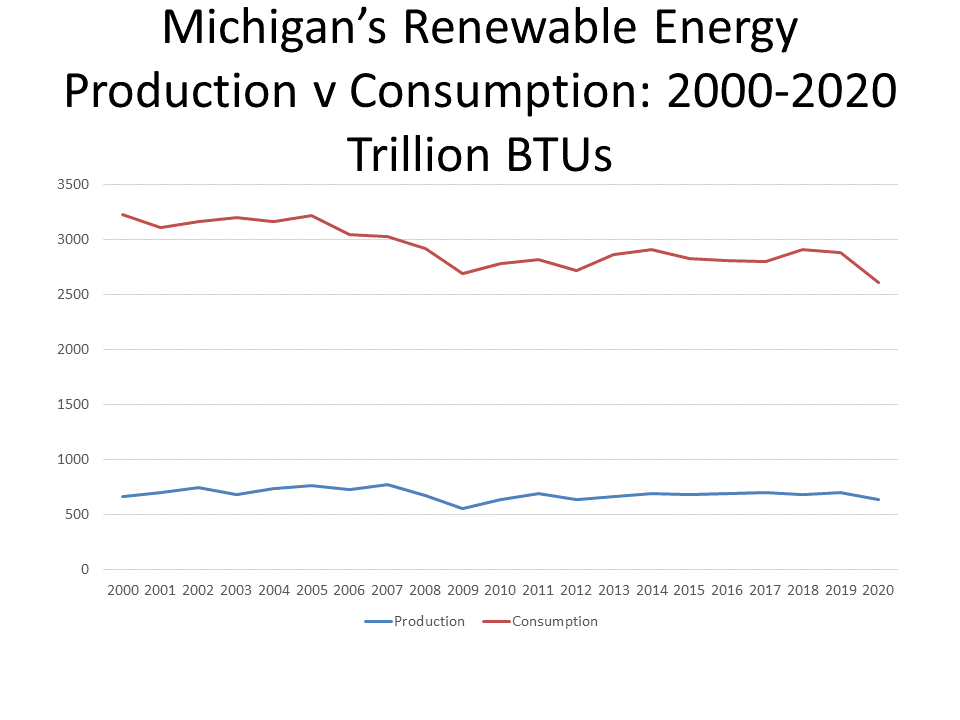
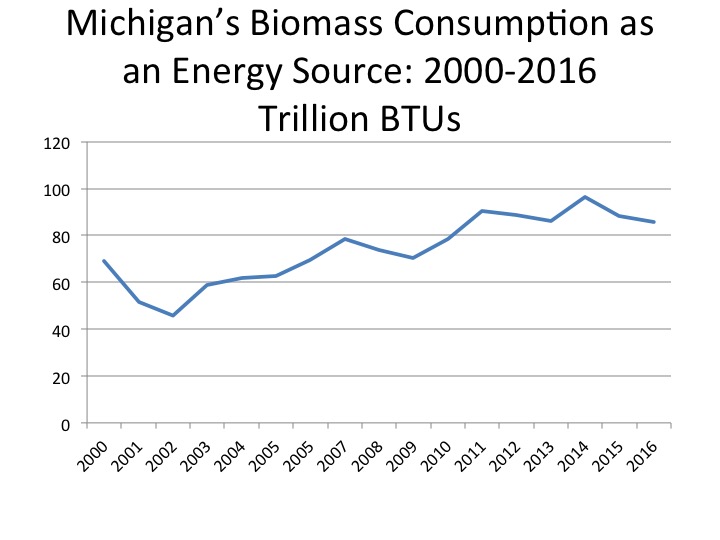
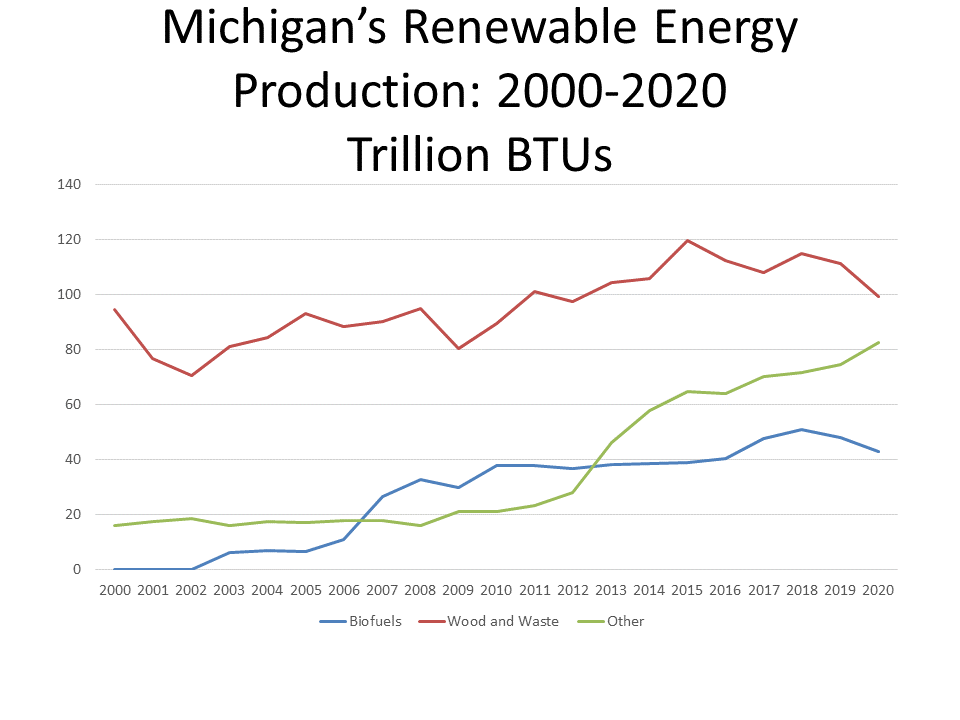
The highest amount of renewable energy produced by a source was from wood and waste since 2000. In 2020 the amount of wood and waste renewable energy produced in Michigan was 99.4 trillion BTUs, a decline from the 119.5 trillion BTUs in 2018.

In 2002, biofuels did not produce any energy, and by 2020 that number increased to 43.1 trillion BTUs. This was a slight decline from the 50.8 trillion BTUs produced.
 
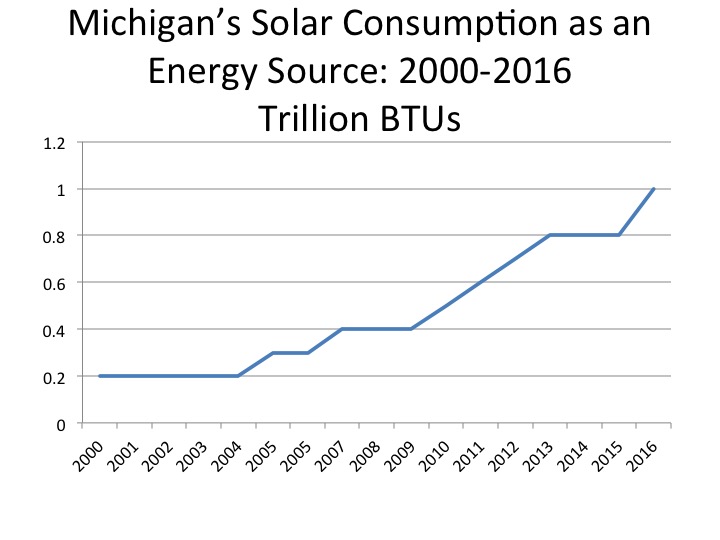
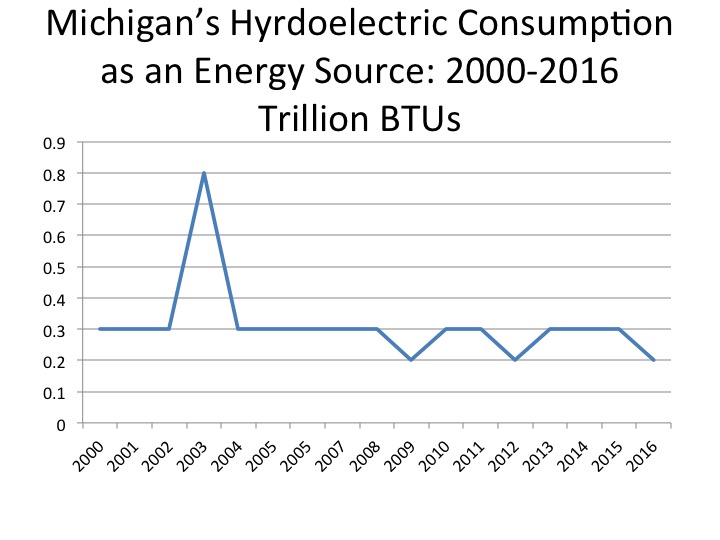
For “other” renewable energy sources, which include wind, solar and hydroelectric energy, there has been a steady increase in production. There was however somewhat of a spike in 2014 when the amount produced shadowed the amount of biofuel energy produced in Michigan. In 2014 there were 58 trillion BTUs of “other” renewable energy produced in Michigan; in 2020 that number increased to 82.5 trillion BTUs.
While there has been somewhat of a shift in the type of energy produced in Michigan, such as a more nuclear and renewable energy being produced and less natural gas, the overall amount produced has remained fairly stable. The gap between the amount of energy produced in Michigan and the amount consumed has also remained somewhat stable, but large. In 2000, there was a 2,559.8 trillion BTU gap between the amount of energy consumed and produced in Michigan. By 2020 that gap only decreased to 1,975.1 trillion BTUs.

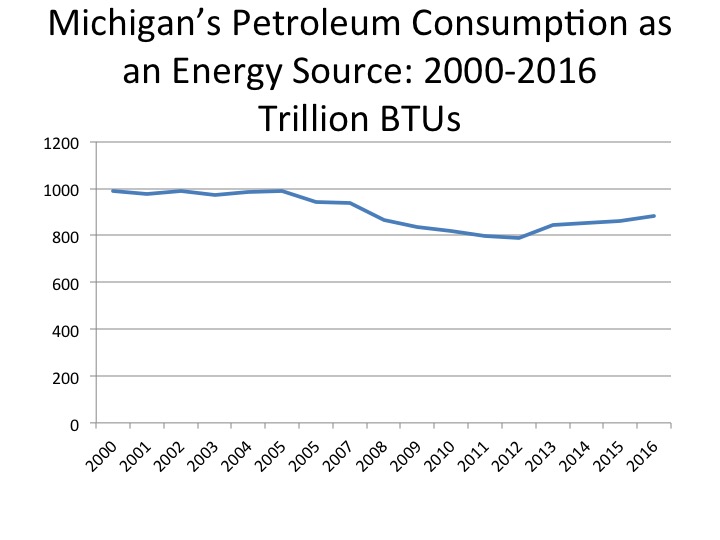
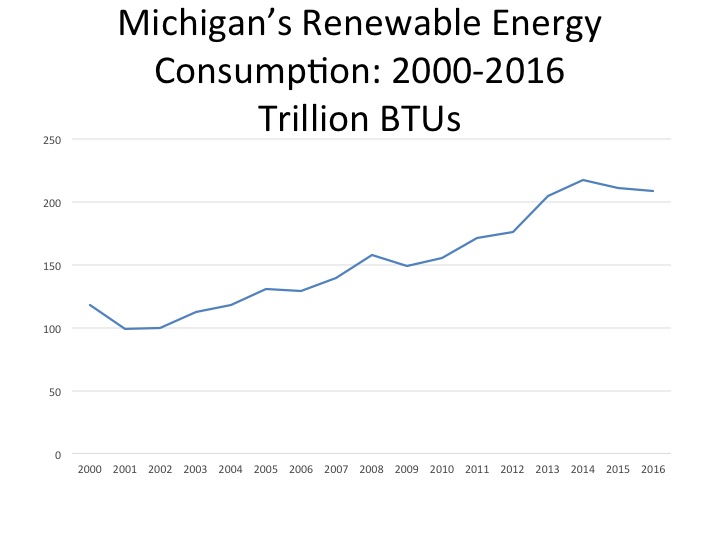
As noted last week, Michigan consumes 240.2 trillion BTUs of renewable energy sources, 100.3 trillion BTUs of natural gas and more than three times those amounts in both coal and oil energy sources. With consumption levels where they are at, and the necessary shift to clean energy sources growing greater and greater, Michigan’s energy policies should also shift. There needs to be further encouragement, and enforcement, of creating more renewable energy production sources in the state, with that energy than being used in-state. Michigan should prioritize consuming the clean energy it produces and increasing such production.

Carbon-Based Energy Sources Continue to Dominate Michigan’s Energy Consumption

In the State of Michigan, petroleum is the most highly consumed form of energy, according to the U.S. Energy Information Administration (EIA). In 2016, 881.4 trillion British Thermal Units (BTU)s of petroleum were consumed in the State of Michigan. This number represents a continued increase of usage since 2012, when it was reported that 787.2 trillion BTUs were consumed. Prior to 2012, use of petroleum remained steady between 2000 and 2005 at about 990 trillion BTUs and then began to drop to the 2012 consumption low point. In the context of this post, petroleum represents the use of motor gasoline, distillate fuel oil, residual fuel and jet fuel. The pattern of decline, then resurgence, is one that follows the economic fortunes of the state with the Great Recession followed by a slow climb out of recession since about 2012.

In the State of Michigan, petroleum is the most highly consumed form of energy, according to the U.S. Energy Information Administration (EIA). In 2016, 881.4 trillion British Thermal Units (BTU)s of petroleum were consumed in the State of Michigan. This number represents a continued increase of usage since 2012, when it was reported that 787.2 trillion BTUs were consumed. Prior to 2012, use of petroleum remained steady between 2000 and 2005 at about 990 trillion BTUs and then began to drop to the 2012 consumption low point. In the context of this post, petroleum represents the use of motor gasoline, distillate fuel oil, residual fuel and jet fuel. The pattern of decline, then resurgence is one that follows the economic fortunes of the state with the Great Recession followed by a slow climb out of recession since about 2012.

Next to petroleum, natural gas was the most commonly consumed energy source. In 2016, 675.9 trillion BTUs were consumed in the State of Michigan. This is a decrease from 763.8 trillion BTUS is 2014 and a larger overall decrease of 854.8 trillion BTUs consumed in 2000, this form of energy remains the second most consumed in the State of Michigan. This is not surprising though, as most of the energy produced in Michigan is natural gas. Here though we are discussing consumption.

The consumption of renewable energy sources in Michigan has steadily increased since 2000, with 208.7 trillion BTUs being consumed in 2016. In 2000, 118.4 trillion BTUs of renewable energy was consumed in Michigan.

The type of renewable energy sources consumed in Michigan include solar, wind, hydroelectric, biomass and geothermal energy sources. Wood and waste biomass and wind energy are the type of renewable energy sources consumed the most in Michigan.

Of the renewable energy sources consumed in Michigan, biomass has the highest consumption rate at 85.6 trillion BTUs in 2016, according to the EIA. Biomass includes organic matter such as wood or crop waste. Consumption of biomass as an energy source has been increasing since 2000 when the consumption was 68.9 trillion BTUs.

The consumption of geothermal as an energy source steadily increased from 2000 to 2011, (from 1.2 trillion BTUs to 5.1 trillion BTUs) and has since leveled off, with 5.2 trillion BTUs being consumed in 2016.

Solar and hydroelectric are the lowest consumed renewable energy sources in Michigan. According to the EIA, 1 trillion BTUs of solar energy consumed in Michigan in 2016; this is an increase from the 0.2 trillion BTUs consumed in 2000. The consumption of hydroelectric energy has yet to reach 1 trillion BTUs. In 2000 0.3 trillion BTUs was consumed and in 2016 0.2 trillion BTUs was consumed. These numbers fluctuated between those time frames though, with the highest consumption of hydroelectric energy being in 2003 at 0.8 trillion BTUs. Overall renewables represent a very small, though slightly increasing proportion of energy consumed.

In 2008 Michigan enacted a renewable energy standard that required the state retail electricity providers, such as DTE, to generate at least 10 percent of their energy sources from renewable energy; that requirement has since been increased to 12.5 percent to be met by 2019. According to DTE, their current residential electric fuel mix is made up of 9.8 percent renewable energy sources. In a future post we hope to further explore the electric fuel mix percentages; we are currently inquiring about time series data.

Overall, we see that consumption of carbon-based energy sources such as coal and petroleum have been decreasing over time, while the consumption of renewable energy sources has been increasing at a slow rate. The data presented here tend to indicate that carbon dioxide producing fossil fuels are likely to continue to dominate energy consumption for many decades, unless Michigan policy makers act on the dangers of climate change to the state’s future environment, economy and children.