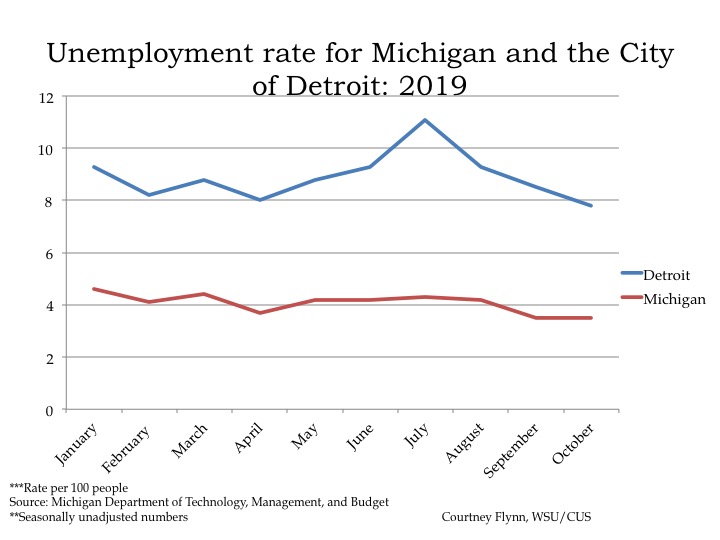
In October of 2019 the unemployment rate for the State of Michigan was 3.5, the same as it was for the month of September, according to the most recent data provided by the Michigan Department of Technology, Management and Budget. The State unemployment rate for October of 2018 was only slightly higher than it was this year in October, 3.7.
In October of 2019 Detroit’s unemployment rate was 7.8 percent. That Detroit unemployment rate was 0.7 points lower in October of 2019 from the previous month. Also, the October 2019 unemployment rate for Detroit was 1.5 points lower from the previous year. In October of 2018 it was 9.3 percent.
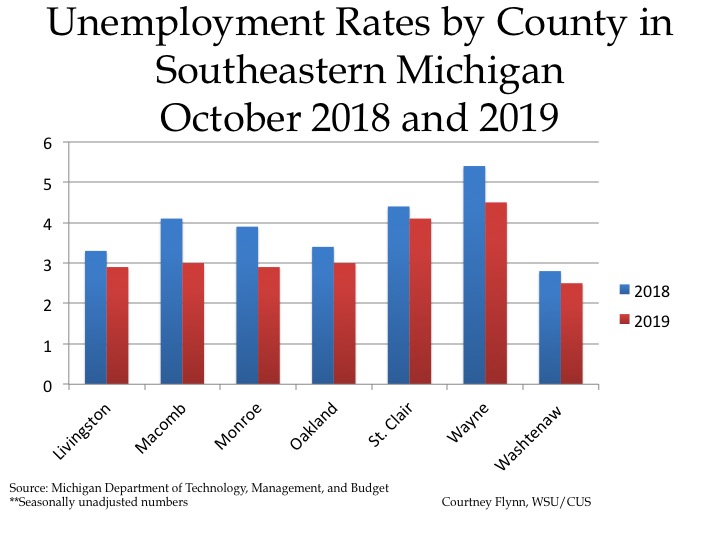
The chart above displays the unemployment rates for each of the seven counties in Southeastern Michigan for October of 2018 and 2019. In October of 2019 Wayne County had the highest unemployment rate at 4.5. Washtenaw County had the lowest unemployment rate at 2.5.
Between October of 2018 and 2019 each county in the region had a lower unemployment rate in 2019 than the previous year; the county with the largest decrease was Macomb County. In October of 2018 the unemployment rate in Macomb County was 4.1 and in October of 2019 it decreased to 3. Also, Macomb, Livingston, Monroe and Washtenaw counties all had unemployment rates at 3 percent or lower while St. Clair and Wayne counties had unemployment rates at 4.1 and 4.5, respectively.
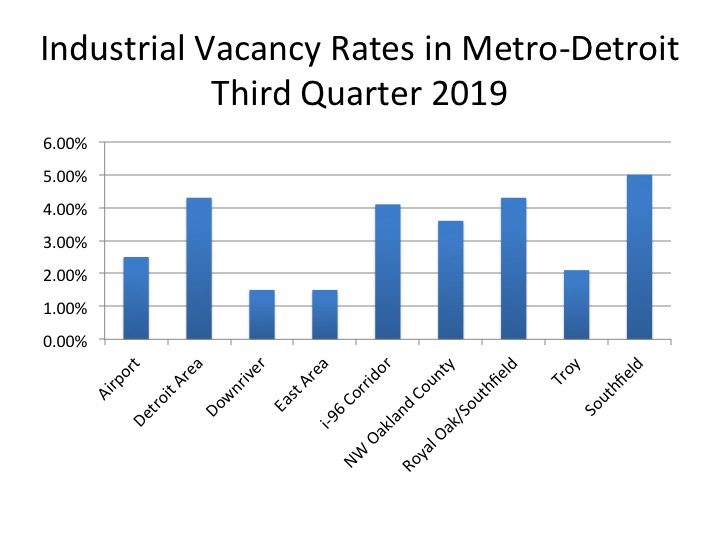
The availability of industrial spaces is another aspect of an area’s financial health and below is information from the quarterly reports of Cushman and Wakefield, a global real estate firm, which produces information related to Metro-Detroit. According to the company, leasing of industrial spaces in the third quarter of 2019 is up from the second quarter, with the Airport area having the strongest increase by landing companies such as DSV and Crane World Wide Logistics with their lease renewals. Additionally, the overall vacancy rate in the Metro-Detroit area is at 2.9 percent, and as shown in the first chart below the Downriver and East side areas have the lowest vacancy rates at 1.5 percent. The Southfield area has the highest vacancy rate at 5 percent.
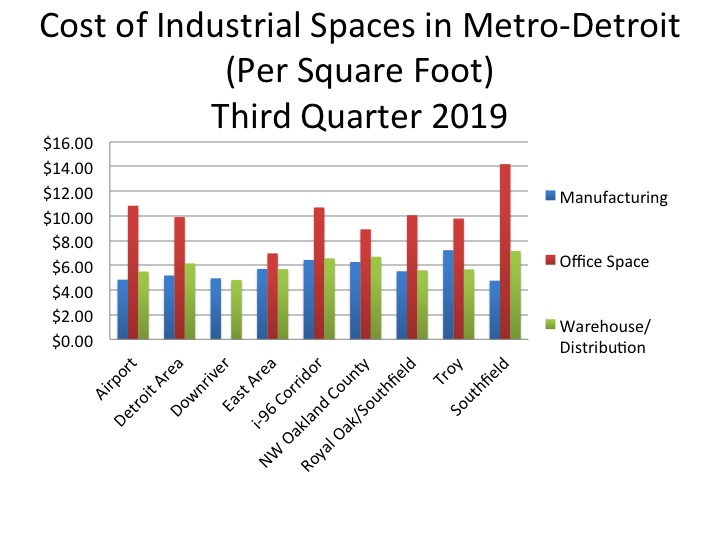
The second chart below shows the average cost of industrial spaces in the region per square foot. There are three different types of industrial space as defined by Cushman and Wakefield and those are: manufacturing, office space and warehouse/distribution spaces. As the chart shows, office space has the highest market value, with the Southfield area having the highest cost at $14.19 per square feet. In nearly all the areas warehouse/distribution spaces has the second highest cost with Southfield again having the highest market rate at $7.15 per square foot. In the Downriver and Troy areas though manufacturing spaces have a higher market rate than the warehouse space. In Downriver, manufacturing spaces average $4.94 per square foot and warehouse spaces average $4.80 per square foot; in Troy manufacturing spaces average $7.22 per square foot and $5.60 per square foot for warehouse spaces. Troy also has the highest market value for manufacturing spaces in the region.
According to Cushman and Wakefield, there is an expectation that utilization of industrial spaces will continue to increase in 2020 meaning a continuation of low vacancy rates.
The above chart shows the Standard and Poor’s Case-Shiller Home Price Index for the Detroit Metropolitan Statistical Area. The index includes the price for homes that have sold but does not include the price of new home construction, condos, or homes that have been remodeled.
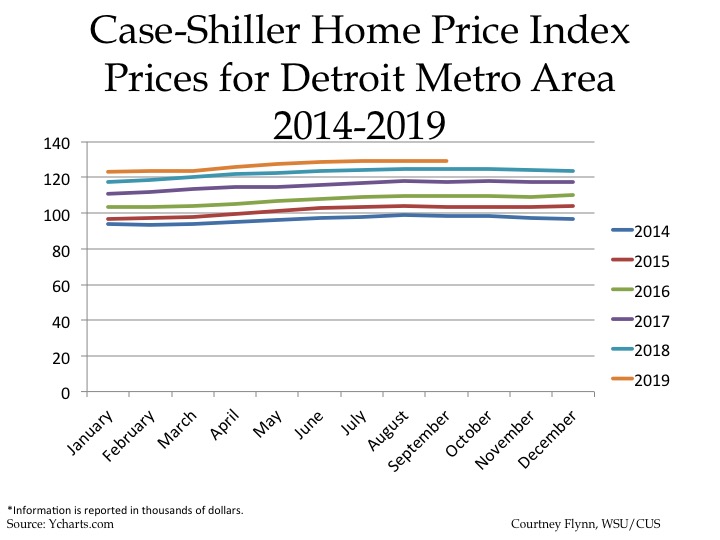
According to the index, the average price of single-family dwellings sold in Metro Detroit was $129,250 in September 2019; this was $800 lower than the average family dwelling price in August. The September 2019 price was an increase of $4,460 from September of 2018 and an increase of $11,650 from September of 2017, an increase of $19,470 from September of 2016 and increase of $25,670 from September of 2015 and, finally, an increase of
$30,910 from September of 2014.