Michigan’s Deaths Out Pace Births

More people died in Michigan in 2020 than were born, and it has been trending this way for quite some time. The Michigan Department of Health and Human Services reported that in 2020 there 104,166 people born and 117,087 who died; the 2020 data was only available at the state level. While COVID certainly impacted the number of 2020 deaths (11,362 were COVID related), there still would have been a greater number of deaths than births without the pandemic.

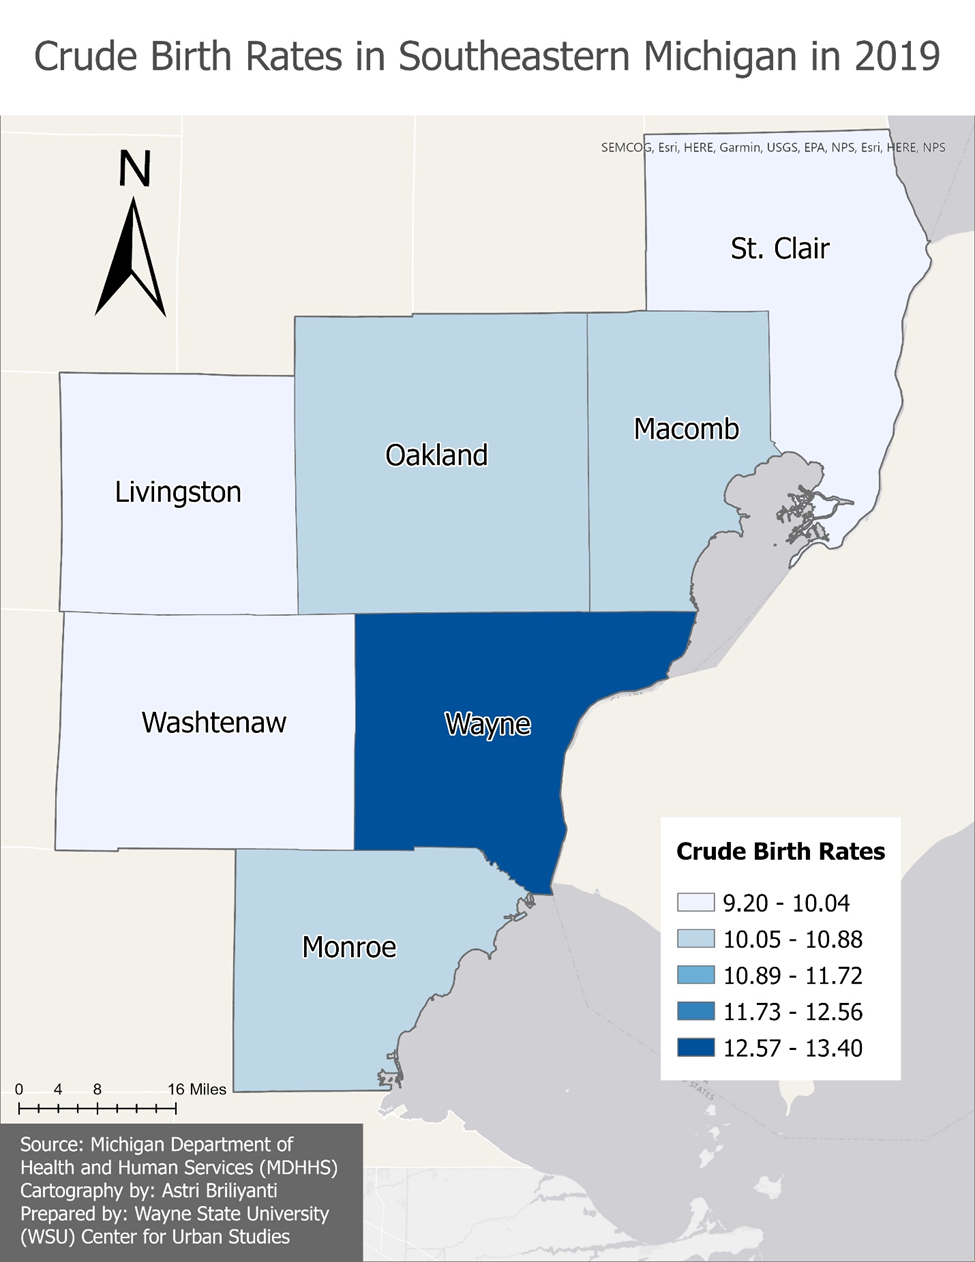
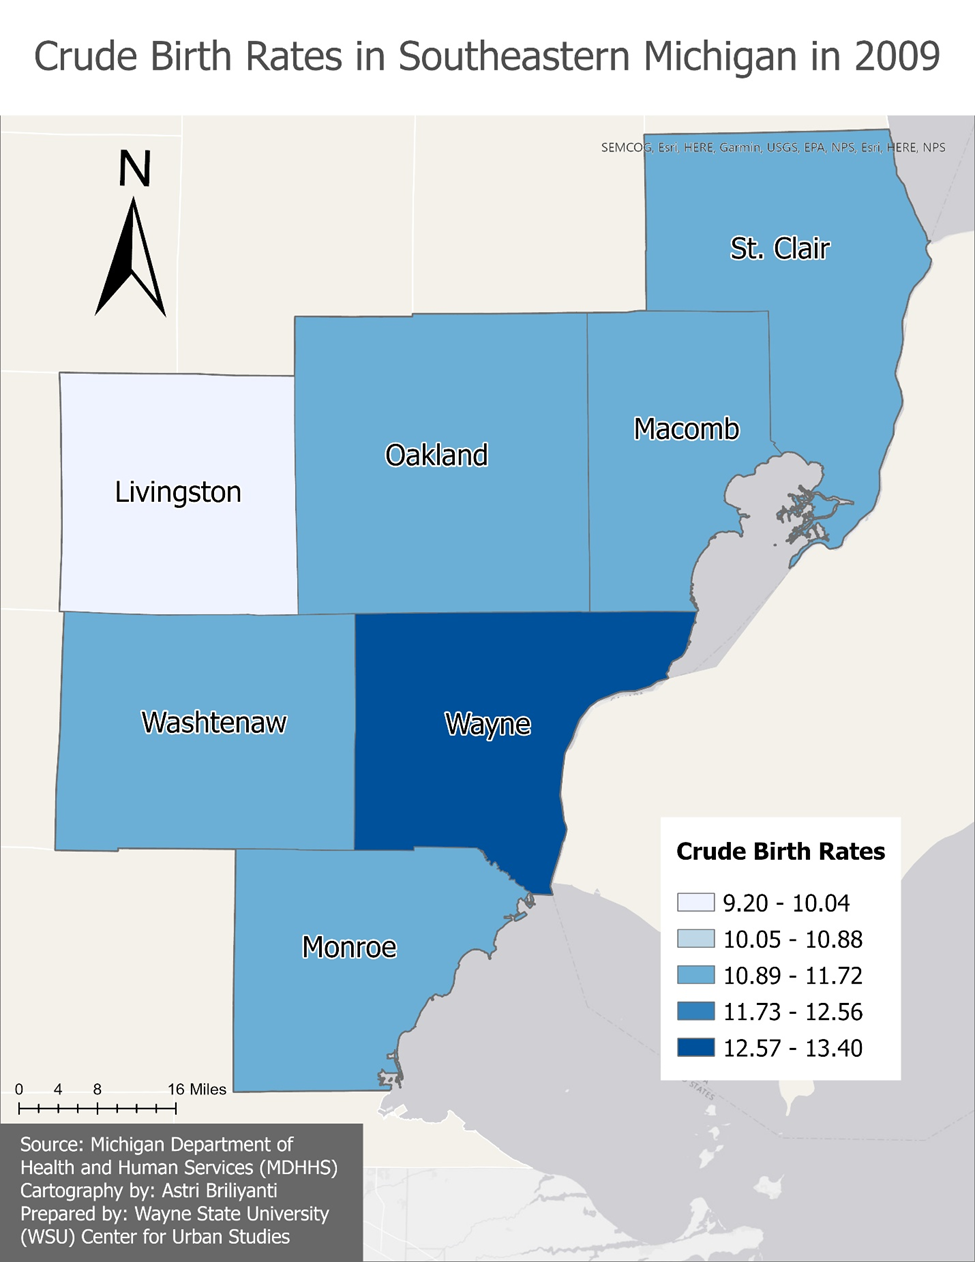
While 2020 data is not yet available at the county level, the 2019 data shows how birth and death rates have long been trending toward more deaths than births. In Wayne County, the largest county in the state, a birth rate of 12.9 births per 1,000 residents was reported, which was equivalent to 22,553 births. Wayne County had the highest birth rate in the region in 2019, but it did not have the largest change in birth rates between 2009 and 2019. According to the data, there was a birth rate of 12.9 births per 1,000 residents in Wayne County in 2019 and a birth rate of 13.6 births per 1,000 residents in 2009. Washtenaw County had the largest difference in birth rates between 2009 and 2019 at a rate decrease of 1.4 per 1,000 residents. In 2019 Washtenaw County had a birth rate of 9.7, which was equivalent to 3,560 births, and in 2009 that birth rate was 11.1. Oakland, Macomb, Monroe and St. Clair counties all also reported birth rates above 10 in 2009 (11.1, 11.1, 11.4 and 10.9, respectively); Livingston County was the only one in the region to report a birth rate below 10 in 2009. By 2019 only Macomb, Monroe, Oakland and Wayne counties reported birth rates above 10 (10.4, 10.1, 10.3 and 12.9, respectively).

Michigan’s birth rate per 1,000 residents was 11.8 in 2009 and 10.8 in 2019.

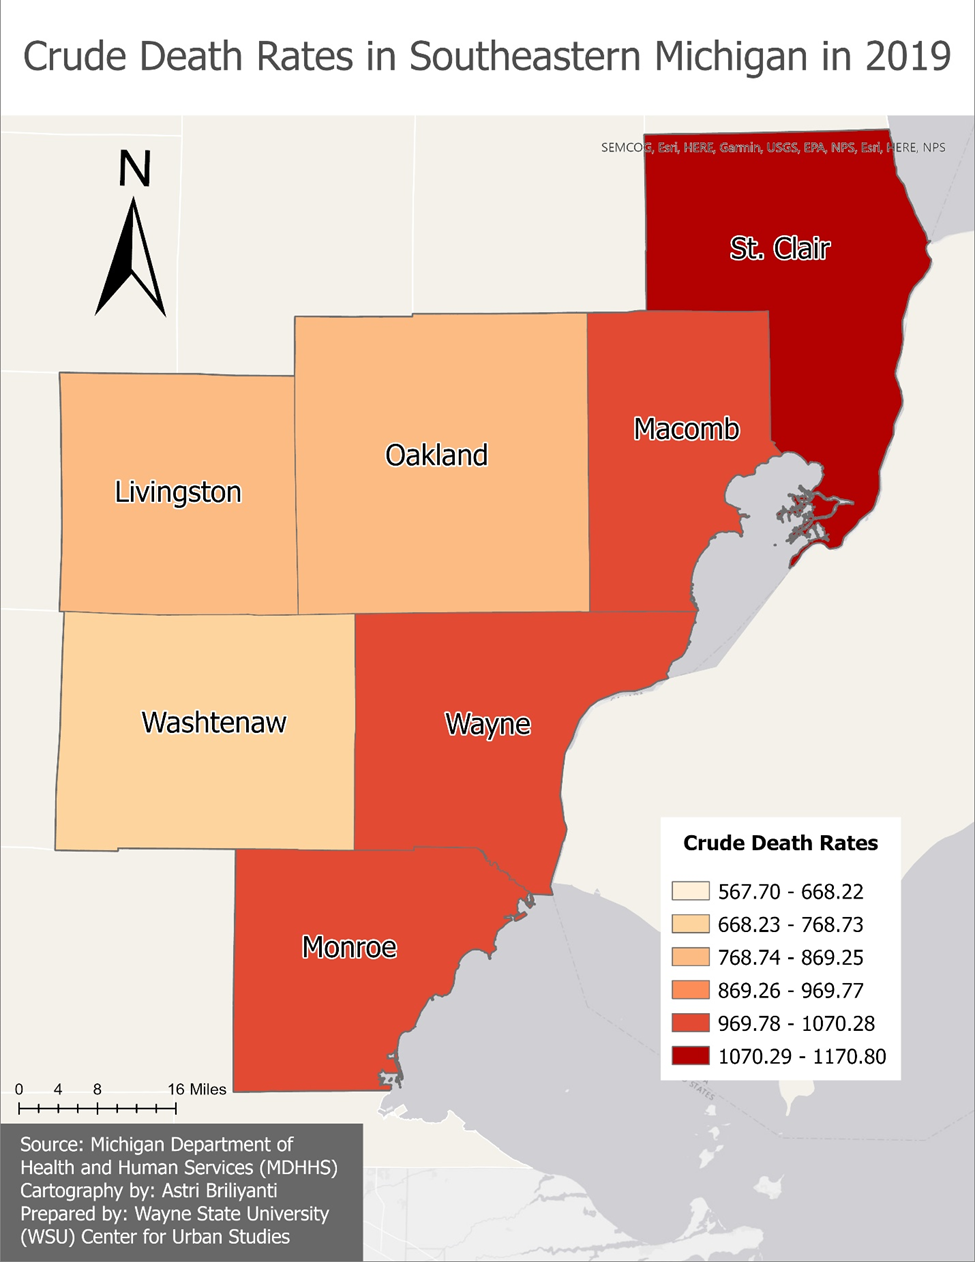
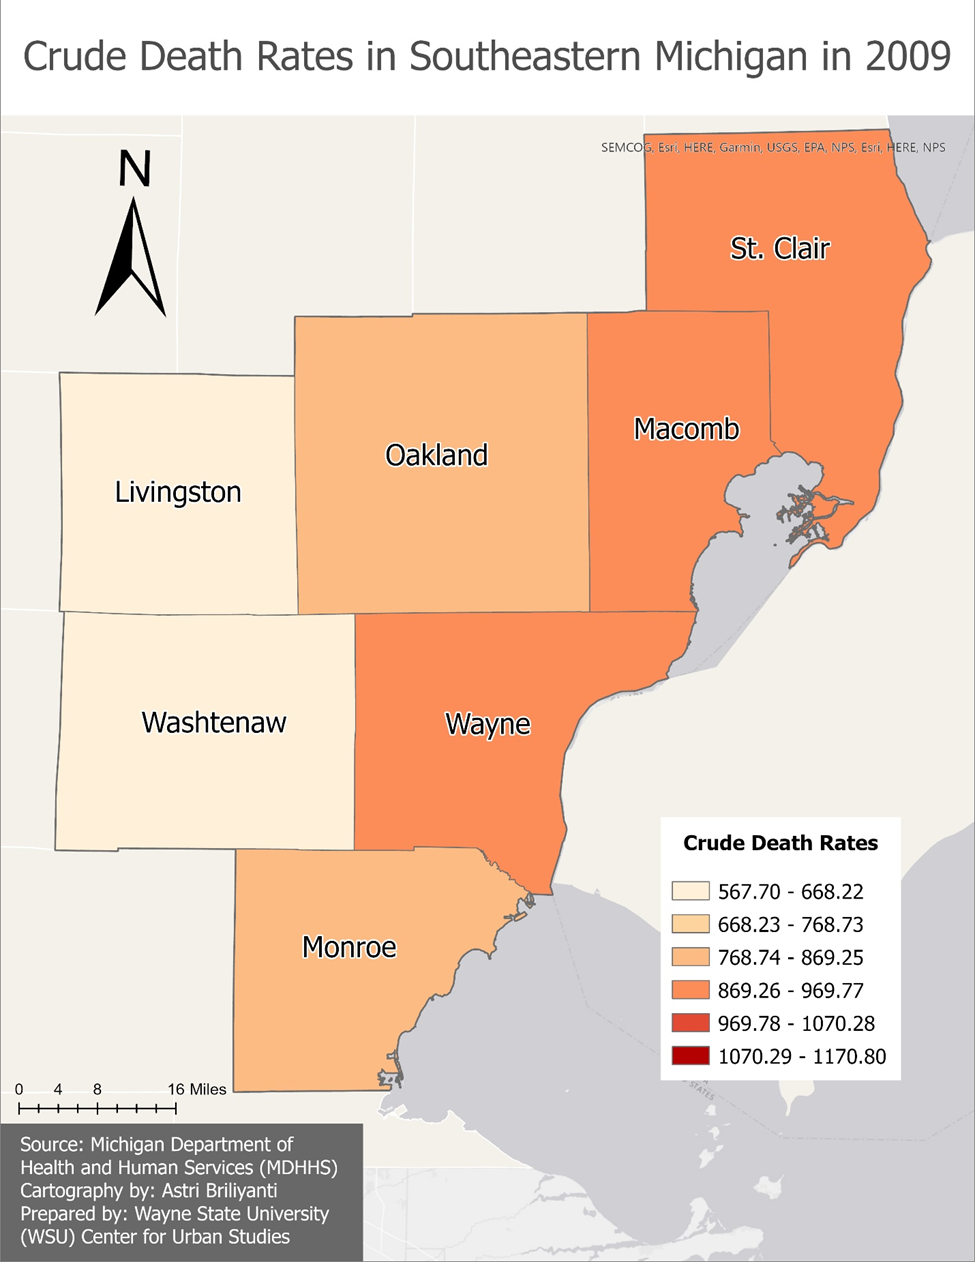
As birth rates in Michigan were declining, death rates were on the rise. In 2019, St. Clair County had the highest death rate at 1,170.8 per 1,000 residents in 2019, which was equivalent to 1,863 deaths. Macomb, Monroe and Wayne counties were the only other counties with death rates above 1,000 ( 1,026.2, 1,047.8 and 1,044.7, respectively). In 2009 though there was not one county in the region with a death rate above 1,000. St. Clair County reported 961.5 deaths per 1,000 residents, which was the highest death rate in the region reported. Overall, Monroe County experienced the highest increase in its death rate between 2009 (847 per 1,000 residents) and 2019 (1,047.8 per 1,000 residents) at a 221.8 rate increase per 1,000 residents.  

It should also be noted that Michigan’s death rate per 1,000 residents was 871.7 in 2009 and 992.3 in 2019.

A decline in births will certainly impact Michigan long-term if things don’t turn around. While

 Michigan did experience a small uptick in its population between 2010 and 2020 probably because of immigration, the rate of increase wasn’t as high as compared to other states, hence why Michigan lost a Congressional seat. Population decline, and even stagnation, could cause negative economic impacts and further loss of political power. On the other hand, it would give the environment a break from human interventions, giving forests and wildlife a chance to expand, perhaps.  

Jobs in healthcare on the rise

A look at the information presented below shows the numbers of healthcare related jobs becoming available are on the rise. As this industry is expected to grow in the Detroit area (Lapeer, Monroe, Macomb, Oakland, St. Clair and Wayne counties) job loss in the manufacturing industry is expected to continue through 2018. Overall in the area there is expected to be about 112,000 more jobs added to the Detroit area labor market through 2018; this is a 5.5 percent growth.

All of the information presented on job growth and decline spans over 10 years, from 2008 to 2018.

Of the industry and occupation forecasts examined in this post, the industry forecasts are produced by the Michigan Department of Management, Technology and Budget.  The industry forecasts are based on historical job trends in the specific industry and the expected short-term, or long-term demand, in those sectors. These demands are determined by industry experts and the Michigan Department of Management, Technology and Budget. Once the industry projections are produced, information on occupational staffing patterns and the shifting trends in such occupational patterns are examined. The examination of these patterns is then used to generate the occupational forecasts.

According to the Michigan Department of Management, Technology and Budget, since a specific occupation is often found in many industries, the relative concentration of an occupation in high demand or low demand industries impacts the overall expected growth rate.  Technology factors are also used because the impact of technological change can decrease or increase future jobs in specific occupations.

growth1

growth2

The above charts show the top 10 jobs the Michigan Department of Technology, Management and Budget predicts will experience the highest percent of growth from 2008-2018 in the Detroit area. While the percentage of growth for the above occupations range from 48 to 26 percent, the raw numbers show the growth will not be that significant. For example, there is a projected 36.3 percent growth in the financial examiner occupation in the Detroit area through 2018. However, when looking at the raw numbers it shows that 36 percent growth is equivalent to 65 jobs over a 10 year span.

Occupations are defined as a set of activities or tasks that persons are paid to perform. Someone can have the same occupation as another person and not be employed in the same industry.

growth3

The above chart shows the expected top 10 growing occupations in the Detroit area through 2018, based on raw or absolute numbers. While three health related occupations are on the top 10 list based on percent of growth, they did not make this top 10 list on raw numbers. According to the Michigan Department of Technology, Management and Budget, healthcare practitioners and technical related occupations will experience the most growth with an expected 18,911 increase in jobs through 2018. There are four healthcare related occupations that are expected to add about 92,000 jobs in the Detroit area in the coming years. The two computer and technology occupations on the list are expected to add about 19,000 jobs.

growth4

growth5

While health and computer related fields are among the occupations suggested to experience growth through 2018, it is the manual labor based jobs that are suggested to decline, according to the Michigan Department of Technology, Management and Budget. The above two charts show the top 10 declining occupations in the Detroit area based on percent of decline. Drilling and boring occupations are expected to decline the most by percent through 2018. However, when looking at the raw numbers of the 10 occupations shown above, postal service sorters and processors are expected lose the most number of jobs.

growth6

When examining the top 10 occupations expected to experience the most job loss through 2018 based on raw numbers, most are related to manufacturing processes.  There is only one listed in the top 10 declining occupations based on percent decline. This occupation is the postal service sorters and processors. The Michigan Department of Technology, Management and Budget expects there to be a loss of 1,006 positions in this occupation through 2018. The production occupation is expected to experience the largest decline in jobs, based on raw numbers from 2008 to 2018. There is an estimated loss of 16,818 jobs.

growth8

growth9

Of the top 10 growing industries in the Detroit area, based on percent growth, three are healthcare related and one is technology related. When examining the raw numbers of the top 10 growing industries based on percent growth the healthcare and social assistance industry is expected to grow the most, by 47,421 jobs in the 10 year period.

An industry is a group of establishments that produces similar goods and services.

growth10

When just examining the raw numbers of expected job increases of the top growing industries in the Detroit area, the healthcare and social assistance industry is expected to experience the most amount of growth. This industry is expected to produce an additional 47,421 jobs through 2018.

Slide18

Slide19

When looking at the raw numbers of the industries presented in the above two charts, fabricated metal product manufacturing is expected to experience the largest decline with a loss of 4,144 jobs. Machine manufacturing came in closely behind with an expected loss of 3,836 jobs.

Slide21

When examining declining industries in the Detroit area, six of the top 10 declining industries, based on percent of decline, match those on the top 10 declining list based on just the raw numbers.  Of those six that match both lists, four industries are manufacturing based. Overall, the Michigan Department of Technology, Management and Budget is expecting a loss of 40,332 manufacturing related industry jobs in the Detroit area through 2018.

For further information on Michigan’s “Hot 50” jobs visit here.

Household composition in Metro-Detroit: Female family based households makeup majority of Detroit

This post examines demographics of households in Detroit and the tri-county area, using information available from the U.S. Census Bureau’s 2011 American Community Survey one-year estimates. According to the American Community Survey, female-run family households are the majority of households in Detroit. While the City of Detroit and Wayne, Macomb and Oakland counties all have more family than non-family households, only Detroit has such a high percentage of female-run family households. Detroit also had the largest average household size and family size.

It should be noted that in this post Wayne County estimates include estimates from the City of Detroit as well.

makeup1


According to the 2011 American Community Survey data, Oakland County had a higher percent of males-52.3 percent-while Macomb and Wayne counties and the city of Detroit had a higher percentage of women.

makeup2

In 2011, Detroit had the largest average number of residents in a household (2.74) while Oakland County had the smallest (2.49). The difference between the two was 0.25 persons per household. Wayne County was 0.06 below Detroit, and Macomb County was 0.2 below Detroit.

According the U.S. Census Bureau, the average number of persons per household for each geographic location was obtained by dividing the number of persons in a household by the number of households in that geographic location. A household included all persons who occupy all types of housing units, except housing units classified as group quarters.

makeup3

Like with the average household size, in 2011, Detroit had the largest average family size (3.76) of the geographical areas examined while Oakland County had the smallest (3.12).  For all geographical areas examined, the average family size is larger than the average household size. Wayne County had an average family size of 3.47 and for Macomb County that number was 3.17.

A family is defined as a group of two or more people, one who is the householder, who are related by birth, marriage or adoption and reside together.

makeup4

The percent of family households in Macomb and Oakland counties is above 65 percent, while that number is below 60 percent in Detroit.  In Detroit, the percent of family households in 2011 was 57.3 and the percent of non-family households was 42.7. For Macomb County in 2011, the percent of family households in the county was 66.9; the percent of non-family households was 33.1. Oakland County’s distribution was similar to that of Macomb County, with 65.4 percent of the county consisting of families. In Wayne County, the percent of family households was 62.9.

A non-family household is defined as a person living in a household with non-relatives or alone, according to the U.S. Census Bureau. A family household includes any unrelated sub-family members and/or secondary individuals; the householder is part of a family that consists of two or more people related by birth, marriage or adoption.

makeup5

The above chart demonstrates the composition of family households in Detroit as well as Wayne, Macomb and Oakland counties.

Considering only family households in the Metro-Detroit area, the data show that Detroit had the highest percent of female householders with no husband. For Wayne, Macomb and Oakland counties, married couple families made up majority of the family households. Macomb County had the highest percent of married couple families with 49.8 percent of all family households; Oakland County had 49.7 percent.

For all four geographic locations examined, a family based around a male householder with no wife made up the smallest percentage of the family-type households.

makeup6

According to age distribution data by the American Community Survey the largest segment of Detroit’s population are those between the ages of 5 and 14; this group makes up 14.1 percent of Detroit’s population. The 45-54 age group accounts for about 14 percent of the population; this age group accounts for the second highest percent of Detroit’s population. Those 75 and over comprise the smallest portion of Detroit’s population at 5.6 percent.

makeup7

makeup8

makeup9

Unlike Detroit, the 45-54 age group is the largest segment of the Wayne, Macomb and Oakland counties population. For Wayne County, this age group makes up 14.6 percent of the population, for Macomb County it makes up 15.6 percent of the population and for Oakland County it makes up 16.2 percent. Like Detroit though, the oldest population makes up the smallest percent in Wayne County. For Macomb County though, those between the ages of under the age of 5 make up the smallest percent of the population, at 6.5 percent. For Oakland County it is those between the ages of 20 and 24 that make up the smallest percent of the population at 5.4 percent.


Detroit’s unemployment decreases, number of auto-manufacturing jobs remains steady

For the month of February, Detroit’s unemployment rate decreased while the number of employed began to increase. When looking at the auto-manufacturing field specifically, there was only a slight increase in the number of people employed from January to February.

•Unemployment and underemployment rates decrease, while the number of employed increases. The number of auto manufacturing and auto parts manufacturing employees remained steady from January 2013 to February (monthly);
•Purchasing manager’s index decreased from January 2013 to February 2013 (monthly);
•Commodity price index increased from January 2013 to February 2013s (monthly);
•The most recent consumer price index changes for all and all items less food and energy increased (bi-monthly);
•Building permits pulled decreased for Wayne, Oakland and Macomb counties from February to March. When comparing March of this year to March of 2012, the number of building permits pulled for each county is below what was pulled at this time last year (monthly).
econ1

According to the most recent data provided by the Michigan Department of Technology, Management and Budget, the February 2013 unemployment rate for the State of Michigan was 8.8 per 100 people, which is 0.1 below where it was from November of 2012 to January of 2013. For the City of Detroit, 18 percent of the population were unemployed in January 2013; the February rate is a decrease of 1.8 percent from the city’s percentage of unemployed in January.

econ2

The number of employed in the City of Detroit increased by 3,810 people from January to February of 2013.

econ3

The above chart shows the number of people employed in auto manufacturing industry in the Detroit Metropolitan Statistical Area throughout 2012 and into 2013. Employment peaked in February 2013 continued to increase from its January peak. With 90,700 people being employed in both the auto manufacturing and auto parts manufacturing industries this is 200 more people than January. This is also 12,400 more people employed in this sector of the job market than in February of 2012.

econ4

Although the underemployment rate in Michigan and the U.S declined for 2012, it is still about 5 percentage points above where it was in 2006, for both. Also, it should be noted that Michigan’s underemployment rate has consistently remained above that of the U.S.

According to the Bureau of Labor Statistics, this measure of worker underutilization includes the total unemployed, total of part-time employed for economic reasons, discouraged workers, and other marginally attached workers. This measure of the underemployment  does not consider this group of people as unemployed because they had not looked for work in the four weeks prior to the rate being calculated.

To learn more on underemployment read the following articles:

http://www.nytimes.com/2013/04/20/business/part-time-work-becomes-full-time-wait-for-better-job.html

http://www.nytimes.com/2013/04/22/opinion/krugman-the-jobless-trap.html?_r=0

econ5

According to the most recent data released on Southeastern Michigan’s Purchasing Manager’s Index, the number increased by 4 points from February 2013 to March 2013; in March it was recorded at 55.7. The recorded number for February of this year is 10.4 points below where it was in 2012. The Purchasing Manger’s Index (PMI) is a composite index derived from five indicators of economic activity: new orders, production, employment, supplier deliveries, and inventories; a PMI above 50 means the economy is expanding. The PMI of 55.7 means expansion continues and with the rise of 4 points in month it means that expansion was accelerated.

econ6

The Commodity Price Index, which is a weighted average of selected commodity prices for Southeast Michigan, fluctuated throughout 2012. For January and February of 2013 it appeared to be following the same trend as 2012. However, for the month of March there was a decrease from February; the decrease was by 10.4 points. Also, when comparing the Commodity Price Index from March 2012 to March 2013 there was a 6.7 point decrease.

econ7

econ8

econ9

The above charts show the number of residential building permits obtained each month in Oakland, Macomb, and Wayne counties from February 2012 until the present. These numbers are reported by local municipalities to the Southeastern Michigan Council of Governments and include single family, two family, attached condo, and multi-family units. The information presented shows that the number of building permits obtained in Wayne, Oakland and Macomb counties this month decreased from February and is also below where they were in March of 2012. Macomb County had the largest difference in numbers reported in March of 2012 and March of 2013. For 2012, Macomb County reported that 172 building permits were pulled and in 2013 it has been reported that 72 permits were pulled.

According to the Southeastern Michigan Council of Governments data used for these charts, there have been zero building permits pulled in the City of Detroit in 2013 thus far.