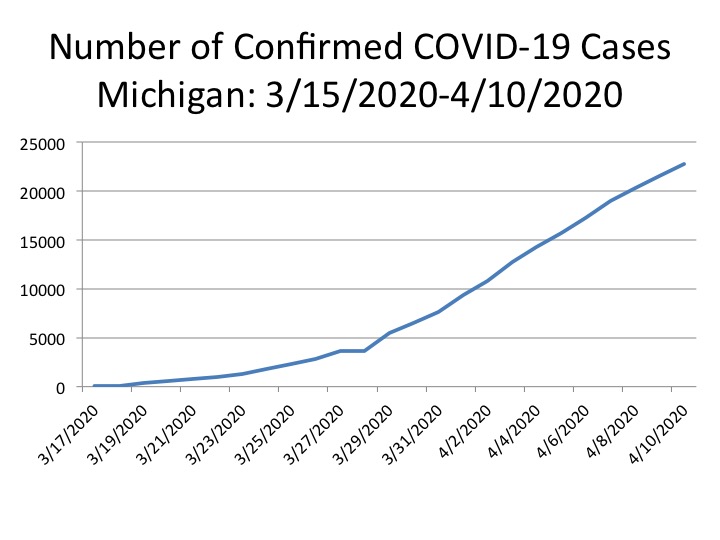
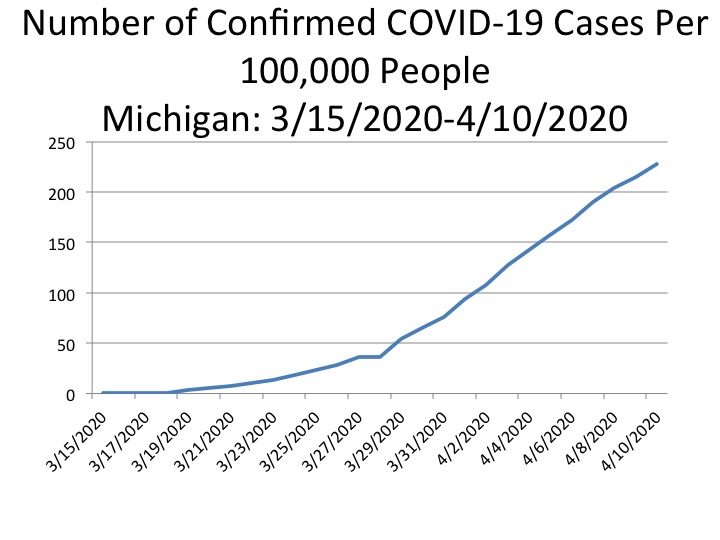
On April 10, 2020 the State of Michigan reported 22,783 COVID-19 confirmed cases, which equates to 228 cases per 100,000 in the State of Michigan. Cases continue to rise both in the State as a whole and throughout the counties. These overall data are reflected in the first two charts. It’s important to note, however, that these data are strongly affected by the lack of testing, which means rates could be much higher.
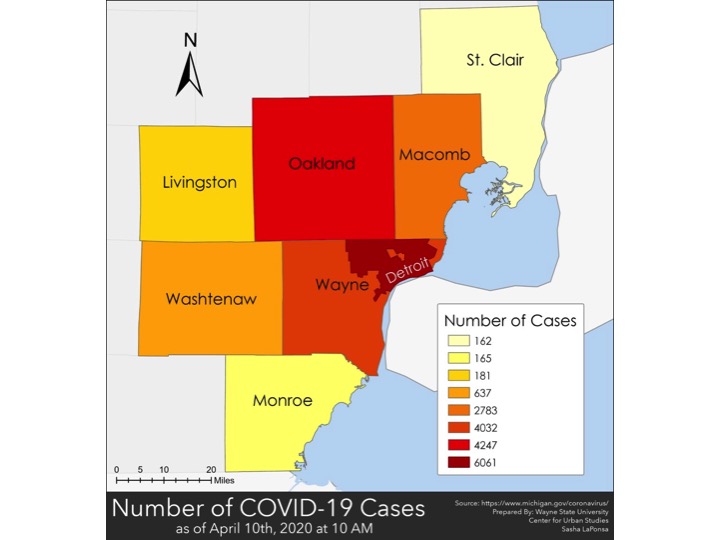
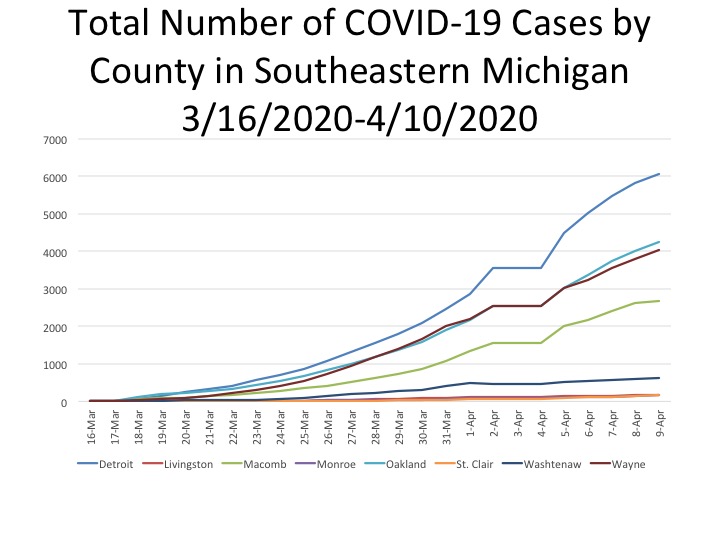
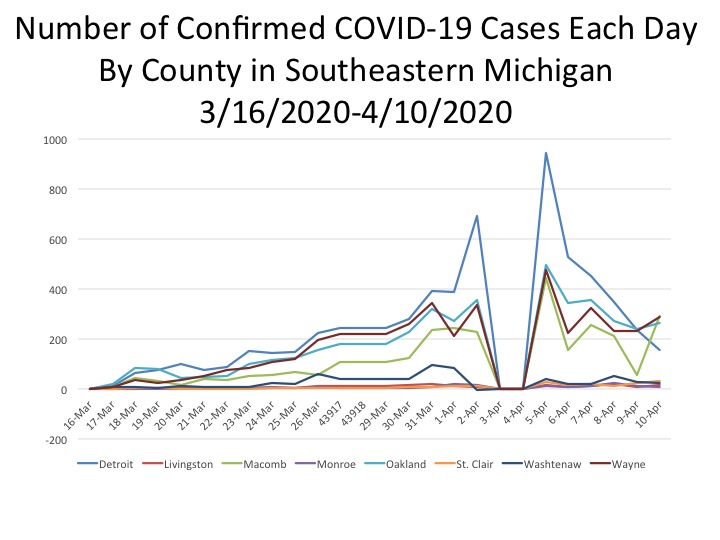
In Southeastern Michigan, and throughout the State, the City of Detroit continues to have the highest number of cases at 6,061 cases as of April 10, according to the Michigan Department of Health and Human Services, which was higher than any number of cases throughout the counties in Southeastern Michigan. Oakland County had the second highest number of total cases at 40,27; this is 1,814 fewer cases than the City of Detroit. Also according to the State, there were 4,032 cases in Wayne County (excluding Detroit numbers) and 2,683 in Macomb County. In total, the number of confirmed cases in Washtenaw, Livingston, Monroe and St. Clair counties combined totaled 1,223, with Washtenaw County accounting for 637 of those cases, according to the most recent data from the State. These data are represented in the next three charts.
In fifth chart down we show the total number of new cases reported each day at the county level, and for the City of Detroit COVID cases. Please note that these data from the State were likely reported for April 3 was also likely reported on April 4, which is why no change is shown and a “0” for April 4 is shown on the chart. Despite this, April 5 had the highest number of cases reported for the City of Detroit, Wayne (excluding Detroit), Macomb and Oakland counties; 945 case were reported for the City of Detroit that day. Since then, the City of Detroit has experienced a consistent decline in the number of new cases reported each day, while the other Wayne (excluding Detroit) Oakland, Macomb and Washtenaw have experienced small upticks following declines. Again, part of this could be an artifact of the limited testing.
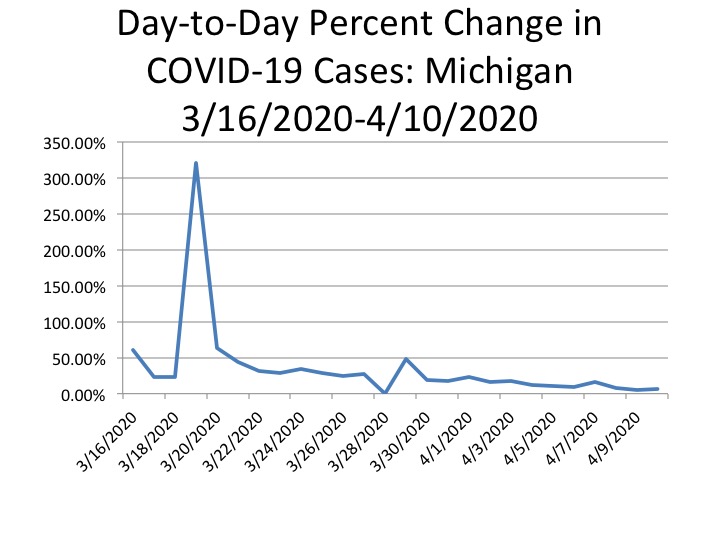
In addition to the raw data of confirmed cases, we also show in the sixth chart the percent change in the number of cases reported day-to-day. The largest percent change thus far reported was on March 19 at 320 percent-this increase was also likely related to an increase in the number of available tests. Also the 0 percent change on March 28 reflects that the data reported from the day prior did not change; it is unlikely that no new cases were reported that day. On April 10 the percent change from April 9 was 6 percent, a small increase the day’s prior change of 5.23 percent. April 7 was the peak for the day-to-day percent change during this week and that was reported at 16.23 percent.
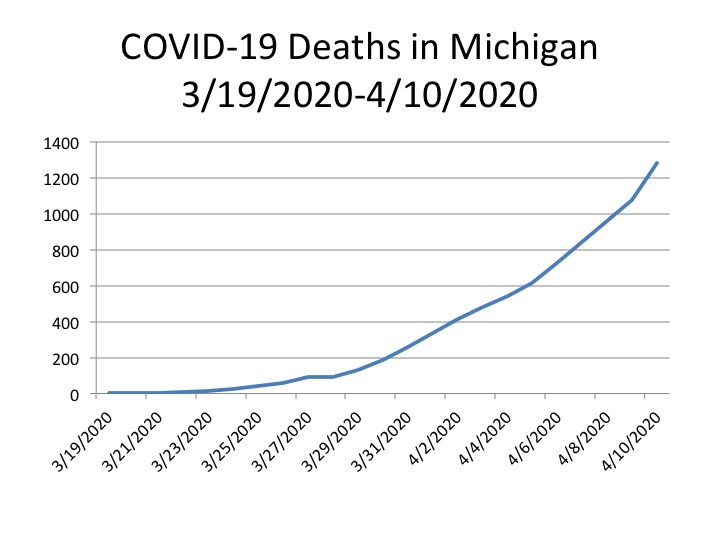
The next 6 charts explain the data about deaths. We consider the data on deaths more reliable, given that they are not directly affected by the shortage of tests.
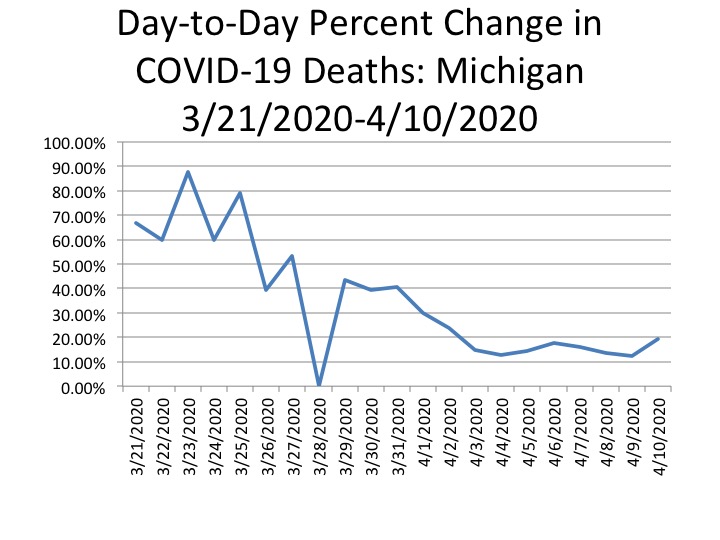
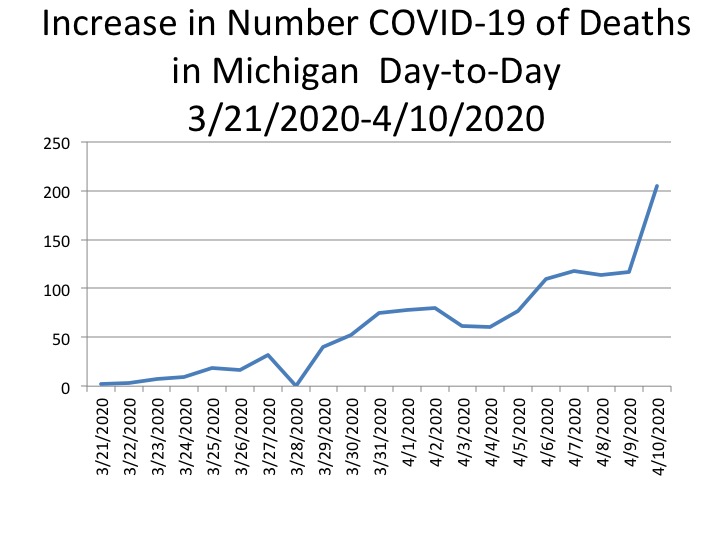
The first chart shows that on April 10 the total of COVID-19 deaths reached 1,281, the highest number of newly reported COVID-19 deaths in the State of Michigan. Percentage changes are reflected in the second chart. There was a 19.5 percent change from April 9 to the 10th, while the change from April 8th to April 9th was 12.2 percent. The last time the percent change was at 19 percent or higher was on April 2 when it was reported there was a 23 percent change in the number of Covid-19 deaths from the day prior. The third chart below shows the increase in number of deaths by day. The 1,281 total deaths reported for April 10 was 205 deaths higher than what was reported on April 9. On April 9 there were 117 deaths reported by the State for that day, and this number showed a small hope that the deaths were beginning to flatten off. However, Friday’s numbers suggest otherwise.
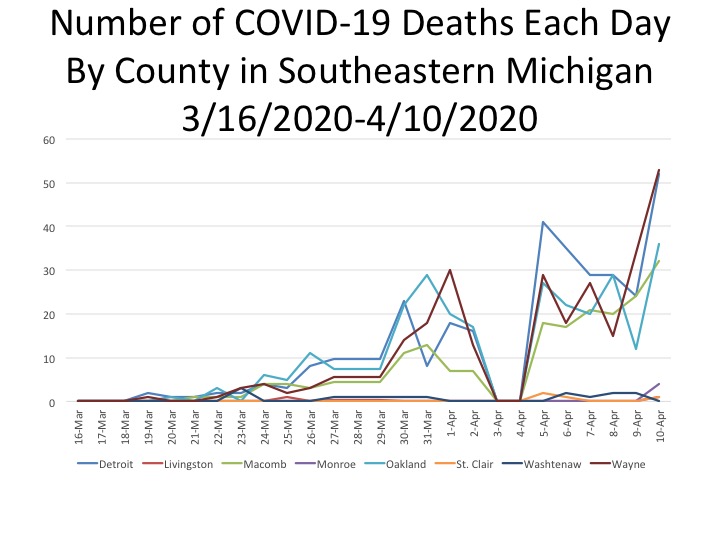
As shown in the fifth chart below, Detroit reported the highest number of deaths on April 10 at 52, according to the data provided by the Michigan Department of Health and Human Services (the City of Detroit is reporting 54 new deaths for April 10). Wayne County (excluding the City of Detroit) had 53 new deaths on April 10. Oakland and Macomb counties also experienced spikes in new death numbers from the day prior. For Oakland County there were 12 reported deaths on April 9 and 36 on April 10; in Macomb County there were 24 reported deaths on April 9 and 32 on April 10. Also, please note the data from the State was likely not reported for April 3 and April 4, which is why the chart shows such a severe decline; we assume this was an error.
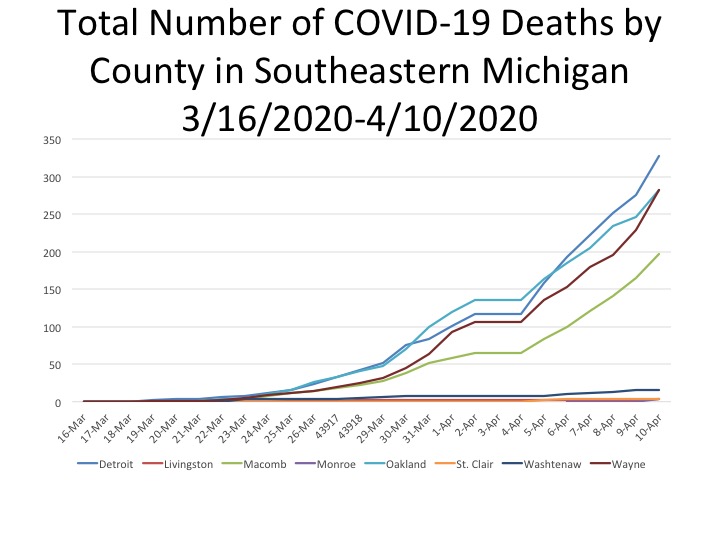
Detroit continues to have the total highest number of COVID-19 deaths in the region, and in the State, according to data from the Michigan Department of Health and Human Services. This is shown in the sixth chart below, which also shows that on April 10 both Oakland and Wayne County (excluding Detroit) had the same number of total deaths, 282.
**Note-the 0 percent change on March 28 reflects that the data reported from the day prior did not change; it is unlikely that no new cases were reported that day.**
Yesterday we noted that with cautious optimism there was a glimmer of hope that COVID-19 cases may have been leveling off. The April 10 data showed that in some counties-Wayne, Oakland and Macomb-there was an uptick in the number of cases but in Detroit the total number of new cases per day has been on the decline. However, the total number of deaths reported on April 10 showed a different story. April 10 was the day in which the highest number of single day deaths were reported for the State, Detroit, Wayne, Oakland, Macomb an Monroe counties.