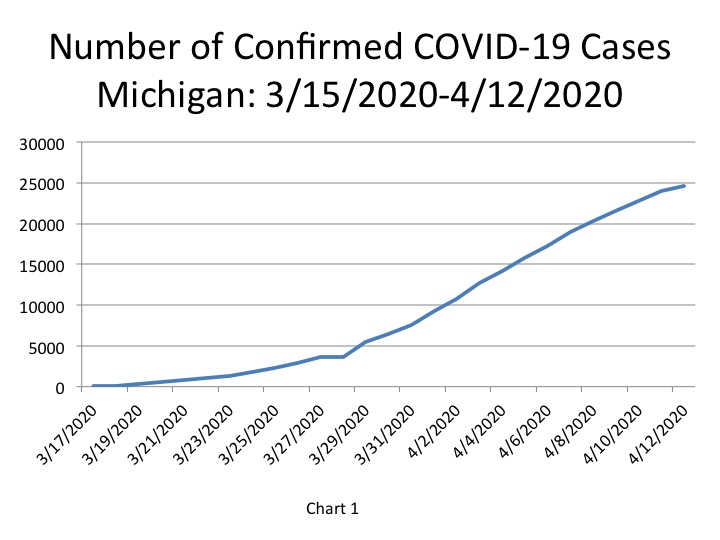
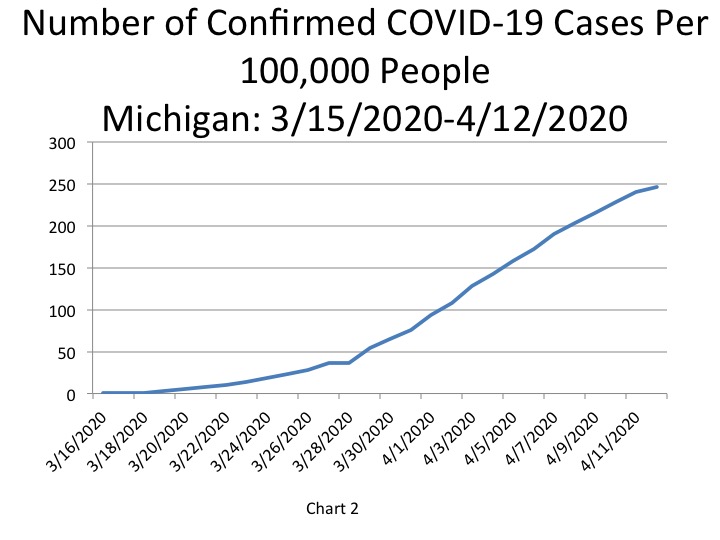
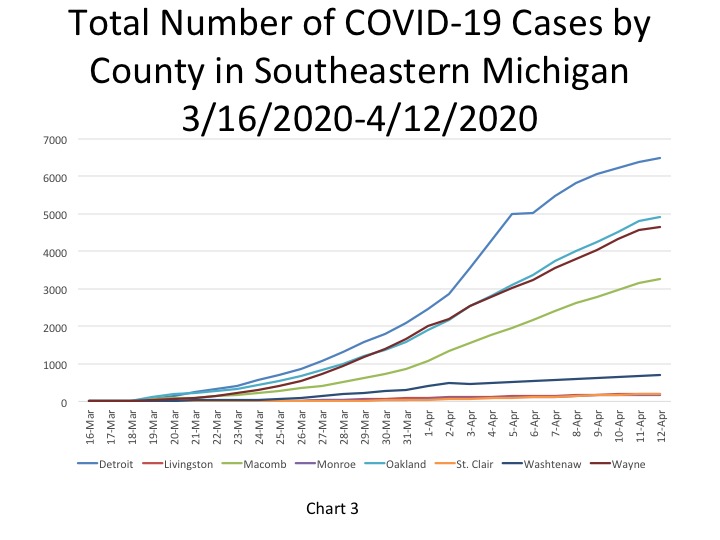
On April 12, 2020 the State of Michigan reported 24,638 COVID-19 confirmed cases, which equates to 248 cases per 100,000 in the State of Michigan. Cases continue to rise both in the State as a whole and throughout the counties, but Gov. Gretchen Whitmer anticipates the peak to be reached within the next two weeks. We do see some change in these curves, though this could also occur because of a slowing of testing or test results. Southeastern Michigan, and throughout the State, the City of Detroit continues to have the highest number of COVID cases at 6,502 cases as of April 12, according to the Michigan Department of Health and Human Services. Chart 1 shows the total number of confirmed COVID cases in the State and Chart 2 shows the total number of cases by county and in Detroit. Oakland County had the second highest number of total cases at 4,915; this is 1,587 fewer cases than the City of Detroit. Also according to the State, there were 4,662 cases in Wayne County (excluding Detroit numbers) and 3,254 in Macomb County. The number of confirmed cases in Washtenaw, Livingston, Monroe and St. Clair counties combined totaled 1,285, with Washtenaw County accounting for 716 of those cases, according to the most recent data from the State.
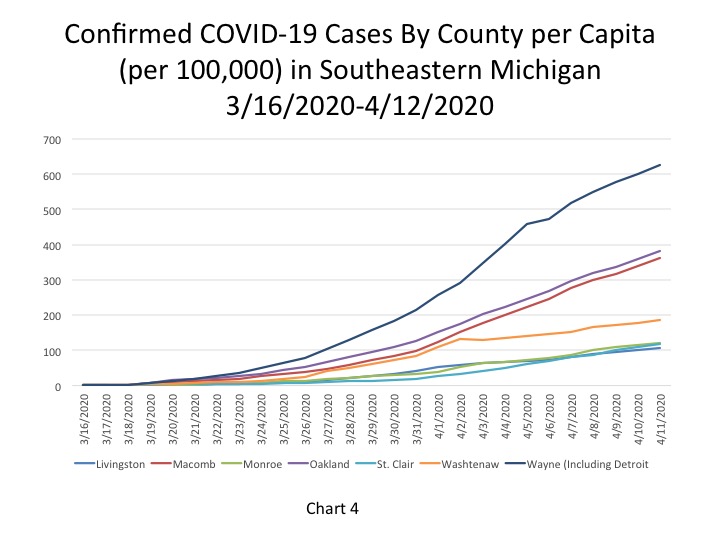
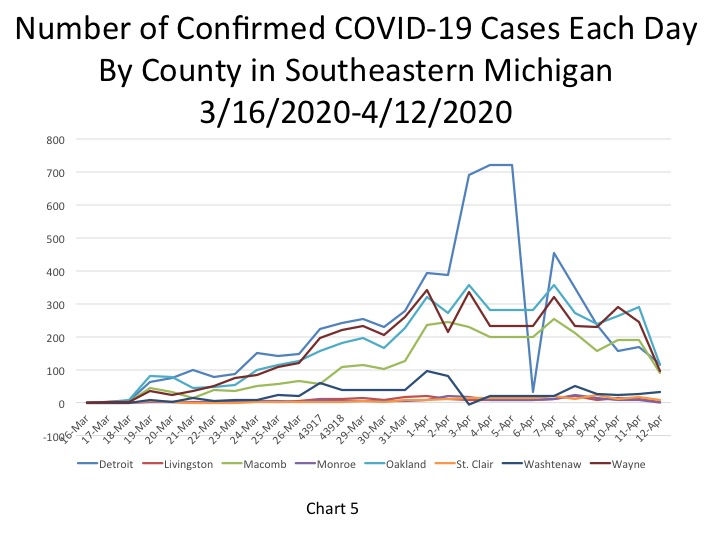
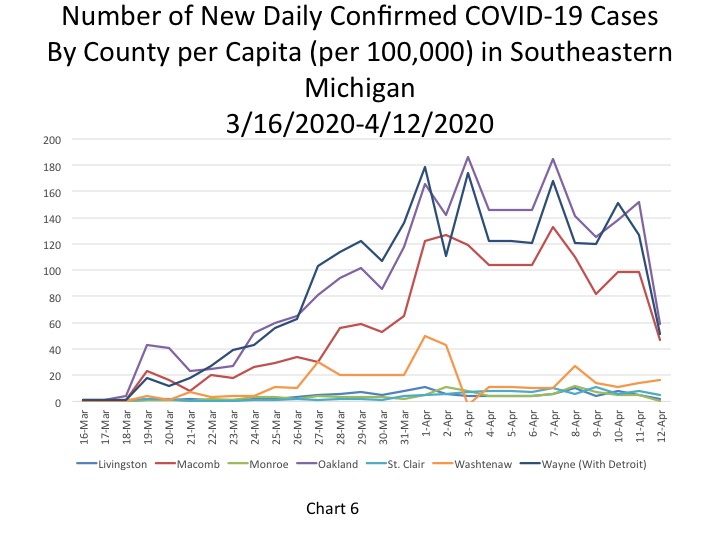
The three charts below give us a better perspective at what is happening at the county level. Chart 4 shows the total number of COVID cases per capita (100,000 people) by county, the Chart 5 shows the number of new COVID cases per county and Chart 6 shows the new number of COVID cases per capita by county (Detroit numbers are included with Wayne County numbers here). Just as the raw data reflects, the number of COVID cases per capita continues to rise, with Wayne County consistently having the highest number of cases per 100,000 people. On April 12 there were 626 COVID cases per 100,000 people in Wayne County; Oakland County had the second highest number at 382 confirmed cases per 100,000. Livingston County had the lowest number of cases per 100,000 people at 107. Day-to-day changes regarding the new number of cases by county has not followed such a clean increase as was shown in the first chart below. Rather, the new number of cases seem to be a bit more erratic, and this could be a result of testing. For example, Detroit Mayor Mike Duggan has noted within the last week test results slowed down due to a backup. On April 12, Detroit had 116 new confirmed cases , Oakland County had 113, Wayne County (excluding Detroit) had 93 and Macomb County had 90. When looking at this per 100,000, Wayne County (including Detroit) had 51 new cases per 100,000 people, Oakland County had 59 and Macomb County had 47.
Please note in the per capita charts Detroit and Wayne County are combined due to how Wayne County’s population data is expressed. Moving forward we will separate the two for better consistency with the other data we are tracking.
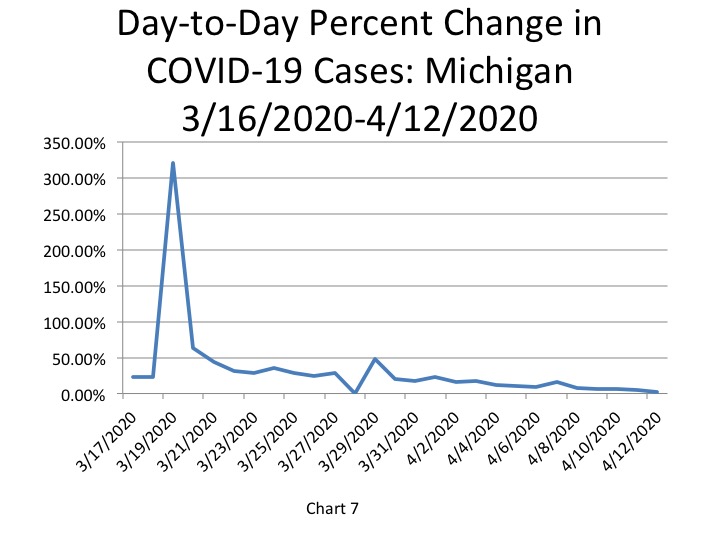
In addition to the raw data of confirmed cases, we also show the percent change in the number of cases reported day-to-day. The largest percent change thus far reported was on March 19 at 320 percent-this increase was also likely related to an increase in the number of available tests. Also the 0 percent change on March 28 reflects that the data reported from the day prior did not change; it is unlikely that no new cases were reported that day. On April 12 the percent change from April 11 was 2.7 percent, a small decrease the day’s prior change of 5.3 percent. Again, this may be a result of testing backlogs. Next week’s data will show.
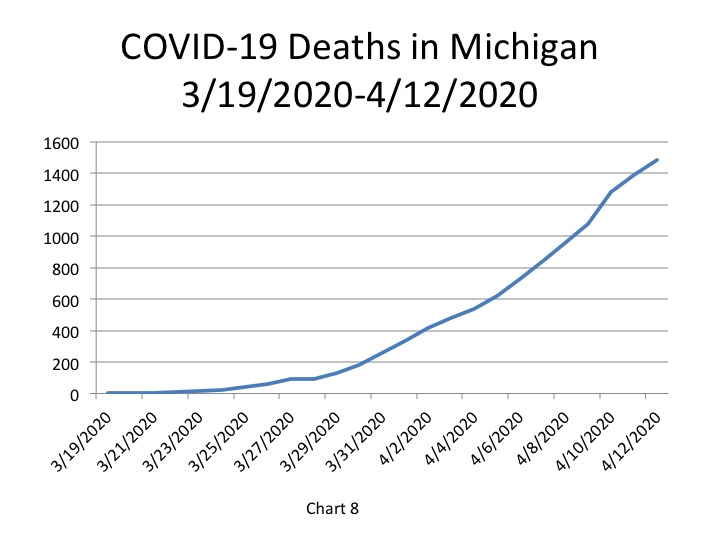
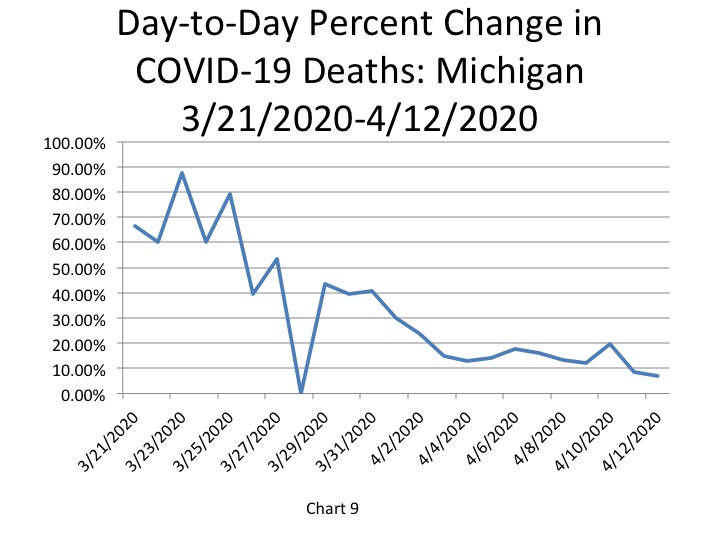
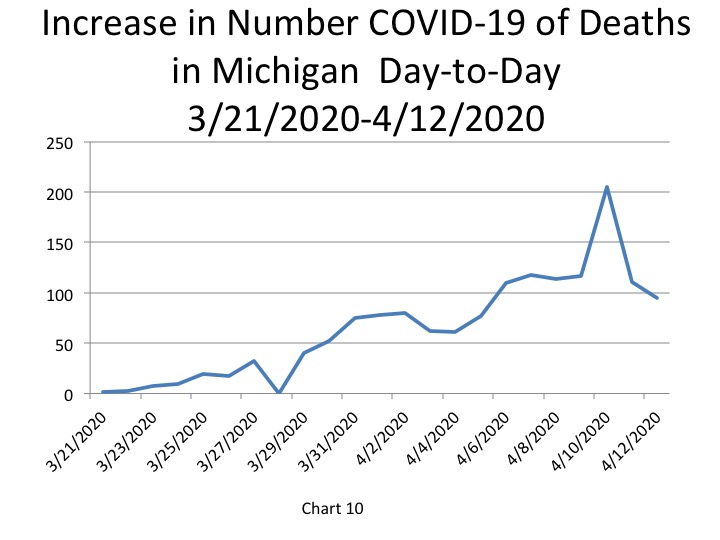
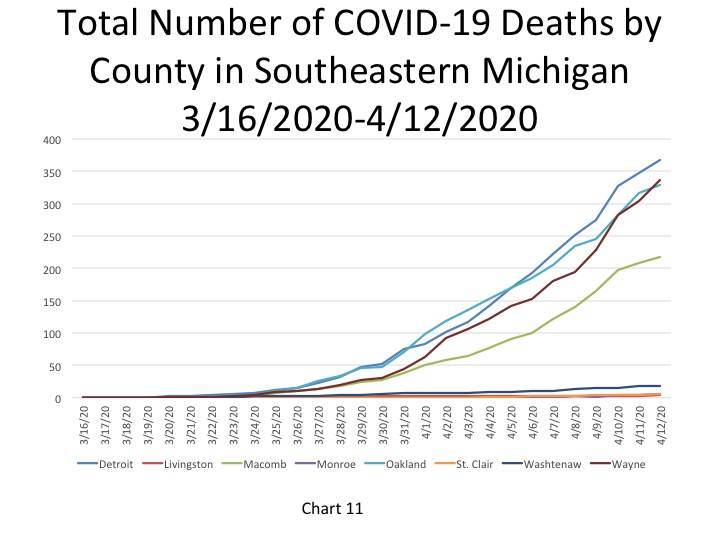
It was reported by the State of Michigan that on April 12 the total of COVID-19 deaths reached 1,487 (Chart 8). This was a percent change of 6.8 percent from April 11, which was a decrease from the 8.7 percent increase of the day prior (Chart 9). The 1,487 total deaths reported for April 12 was 95 deaths higher than what was reported on April 11. As shown in Chart 10, the 95 new deaths reported on April 12 was a decrease in total daily deaths; on April 11 there were 111 new deaths, and 205 deaths were reported on April 10 (this was the highest total of new daily deaths yet to be reported). Of the total deaths reported, Detroit continues to make up the majority of those deaths. On April 12 the Michigan Department of Health and Human services reported there were 368 total deaths in the Detroit-the highest total number of deaths in one city or county in the state. Wayne County, excluding Detroit, crept above Oakland County for the second highest number of deaths on April 12 (Chart 11). According to the data, there were 336 COVID deaths in Wayne County and 329 in Oakland County.
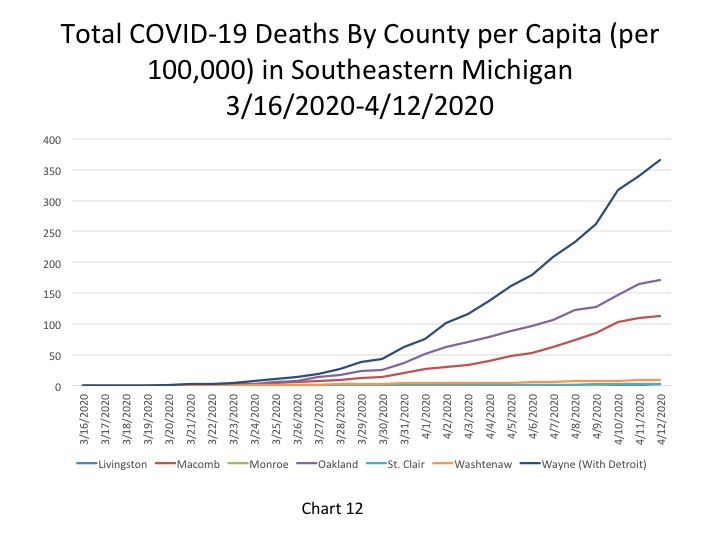
On a per capita basis, per 100,000 people, Wayne County has continuously had the highest number of deaths in the region. This data is shown in Chart 12. The Wayne County data does include the number of Detroit deaths too due to how population data is expressed. On April 12 there were 367 COVID deaths per 100,000 people. Oakland County had the second highest number at 171 deaths per 100,000 people.
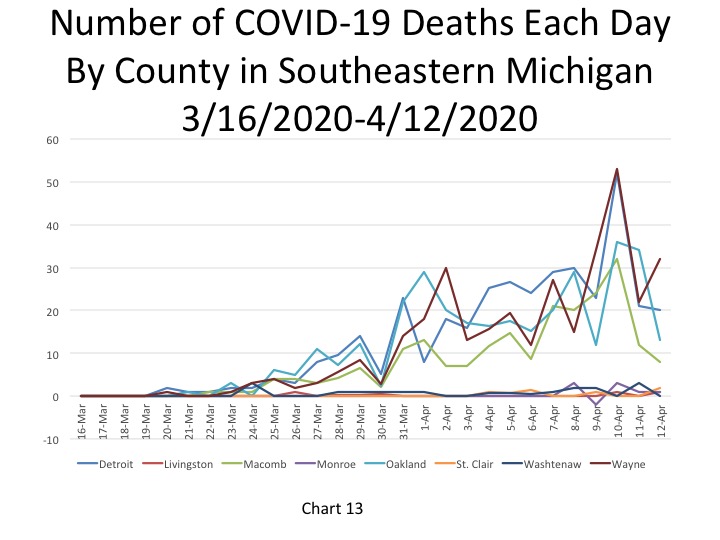
When looking at the total number of daily deaths, it peaked on April 10 in the City of Detroit at 52, according to the State’s data, while on April 12 it was reported there were 20 new COVID deaths in the City (Chart 13). Wayne County had the highest total of COVID deaths reported on April 12 at 32. These April 12th data may be affected by reporting practices in that some counties may not be reporting on the weekend.
Although the number of COVID cases and deaths in several counties recently decreased for April 12 (not for Wayne County for deaths though) this does not necessarily mean the spread is slowing. Factors such as backlogs on testing, availability of testing and methods of determining cause of death all play a factor in the numbers reported. Additionally, as we have seen with the data before, a single day decrease does not reflect the much anticipated flattening of the curve. This means we must continue to be vigilant in remaining home and cautious when outside of home. This will, hopefully, help lead to a consistent decline in the number of cases and deaths.