Induced Abortions in Michigan: The Numbers

Recent news that that Roe v. Wade may be overturned in an upcoming US Supreme Court ruling has many examining how such a decision will affect individuals across the country. In Michigan, a 1931 law that defines abortion as a felony could go into affect. This 91-year-old law states that it is illegal to perform abortions in many circumstances, including in cases of rape and incest; it also states that it is illegal to use drugs to induce abortions.

Currently, with Roe v. Wade, still standing, women are legally able to obtain abortions in Michigan with some restrictions, including:

•That a patient must receive state-directed counseling that includes information designed to discourage the patient from having an abortion, and then wait 24 hours before the procedure is provided;

•What coverage, if any, an insurance policy provides (according to the Michigan Department of Community Health 96 percent of reported induced abortions had a self pay source of payment);

•The parent of a minor must consent before an abortion is provided;

•An abortion may be performed at or after viability only if the patient’s life is endangered.

Not only would Michigan be one of at least 26 states where access to safe abortions would be heavily restricted, but thousands of women would be negatively impacted.

According to the Michigan Department of Community Health, there were 29,669 induced abortions in Michigan in 2020, which was a rate of 15.8 induced abortions per 1,000 Michigan women aged 15-44. This is the highest induced abortion rate in Michigan since 1993, when a rate of 16.1 induced abortions per 1,000 Michigan women aged 15-44 was performed.

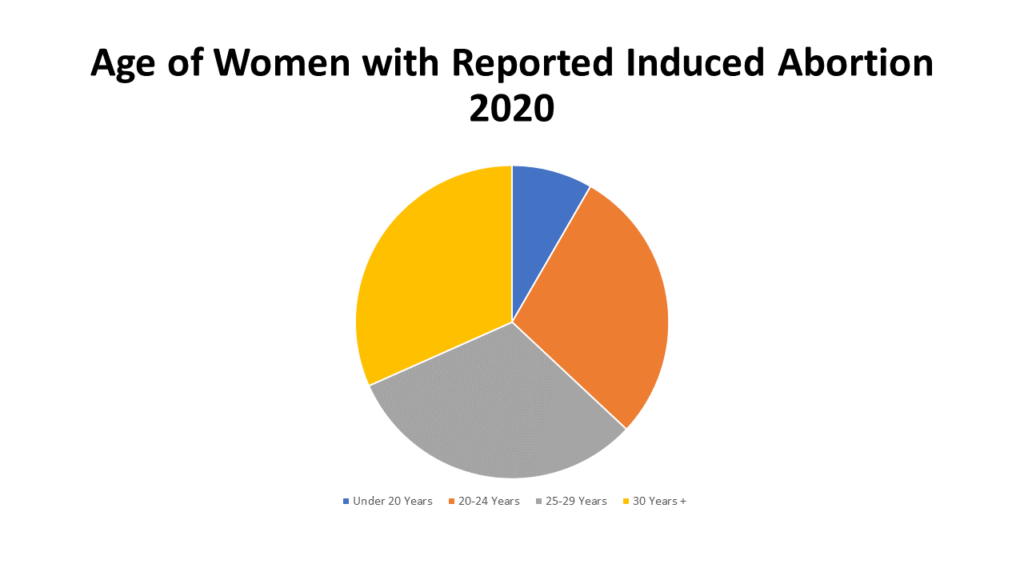
When delving further into Michigan’s induced abortion data we see that majority of women were 25 years of age or older. According to the data, 32 percent of Michigan women who had an induced abortion were 30 years of age or older, and 31 percent of women were between the ages of 25-29. Eight percent of women who had an induced abortion were 20 years of age or younger.

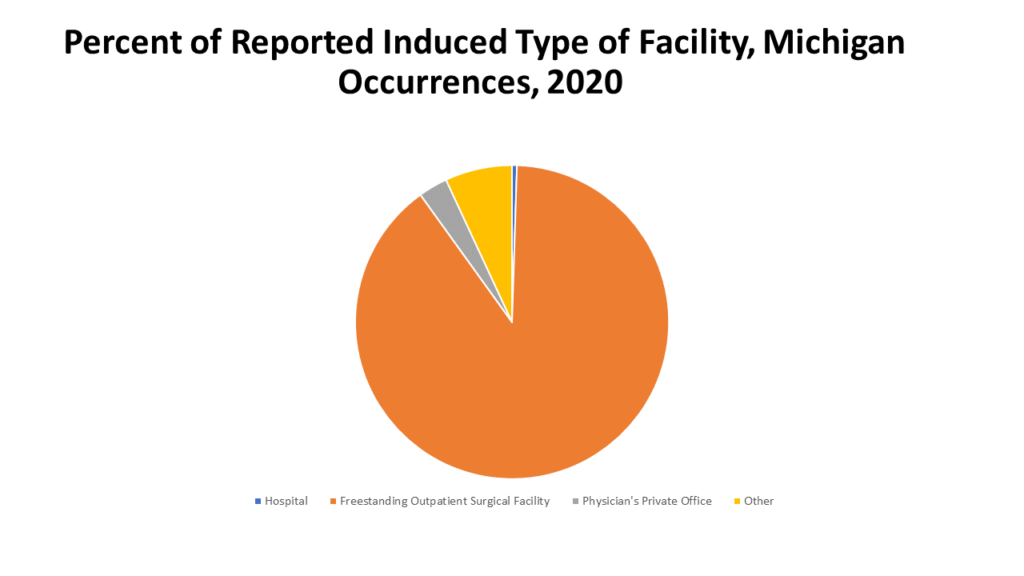
Additionally, of those induced abortions performed in Michigan in 2020 nearly 90 percent were performed in freestanding outpatient surgical facilities. According to the Guttmacher Institute, there were 30 facilities providing abortions in Michigan in 2017, and 21 of those were clinics. Also in 2017, about 87 percent of Michigan counties had no clinics that provided abortions, and 35% of Michigan women lived in those counties.

The data presented in this post shows that many women have abortions for many reasons—including for their health and safety. Every year, the women who chose to have an induced abortion are able to receive one in legal surgical facilities and often pay for the procedure out-of-pocket, as highlighted above. With the possible overruling of Roe v. Wade, thousands of Michigan women, and women across the country, could very well lose the option to have a safe, and legal induced abortion.

In anticipation of the ruling, some options to safeguard legal and safe abortions are occurring: 1)Gov. Gretchen Whitmer filed a lawsuit in April of 2022 calling the Michigan Supreme Court to recognize that the Michigan constitution affords women reproductive rights and agency over their bodies. 2)Planned Parenthood has filed a similar lawsuit, through the Michigan Court of Claims, seeking to declare that the state’s constitution protects reproductive autonomy. 3)A petition drive launched by Reproductive Freedom for All seeks to amend the state constitution to affirm abortion rights. In order to place this on the November ballot 424,000 valid signatures are needed by mid-July. ●

Another means to safeguard abortion access in Michigan would be through approved legislation by the state legislature. Bills to repeal the 1931 ban have been introduced, but not brought forward for a vote.
Fatal Injury Related Deaths Continue to Increase in Southeastern Michigan

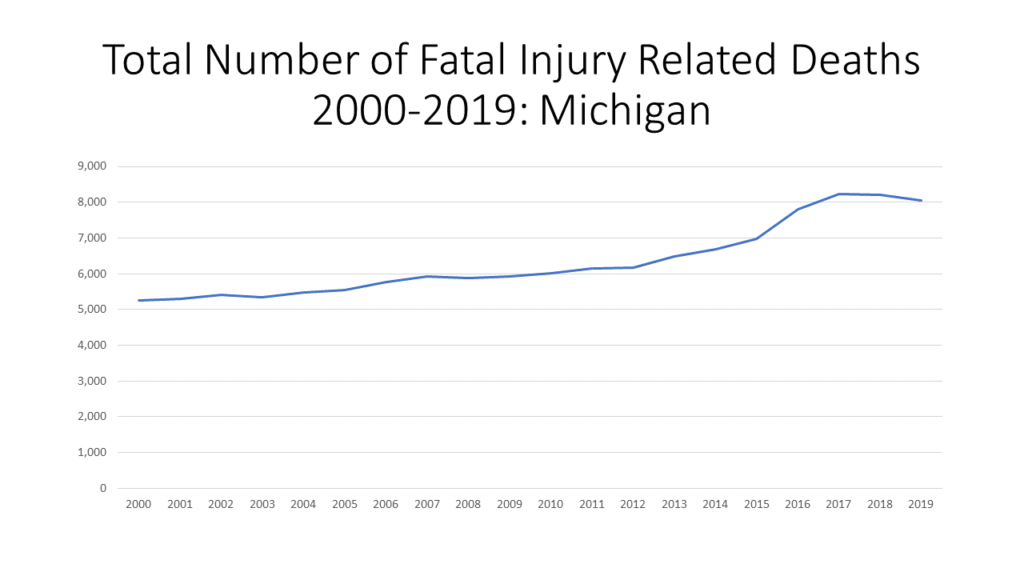
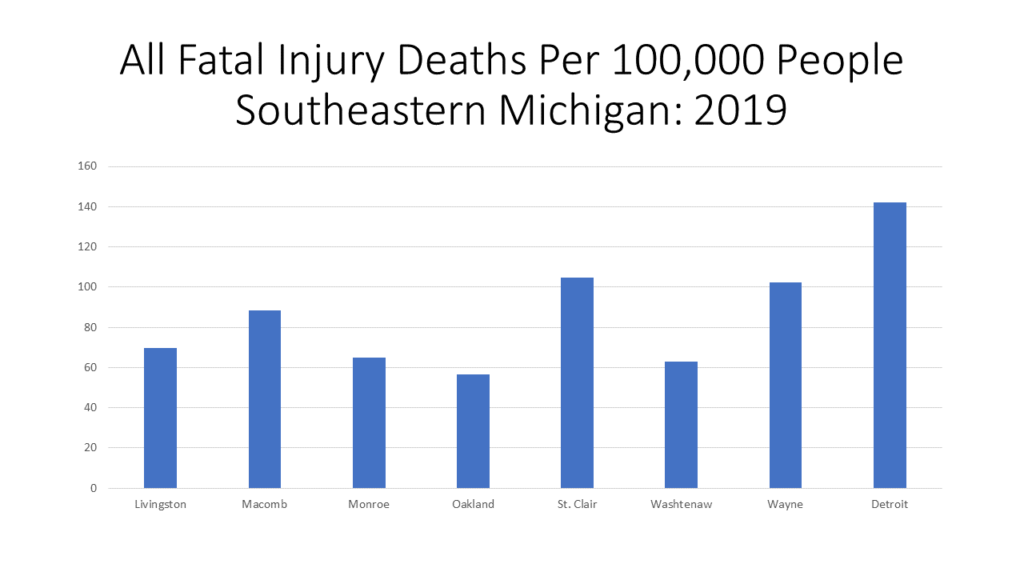
According to the Michigan Department of Health and Human Services, the total number of fatal injury related deaths have, generally, continued to increase since 2000. In 2000 there were 5,263 total fatal injury related deaths and in 2019 that number increased to 8,059. The number of fatal injury related deaths report in 2019 was a slight decrease from the total reported in 2017 and 2018, but overall the total numbers have increased by about 3,000 since 2000. When digging into the most recent data at the local level, the Michigan Department of Health and Human Services reported that the City of Detroit had the highest rate per 100,000 people of all fatal injury related deaths at 142.2; St. Clair County had the second highest rate at 104.9.

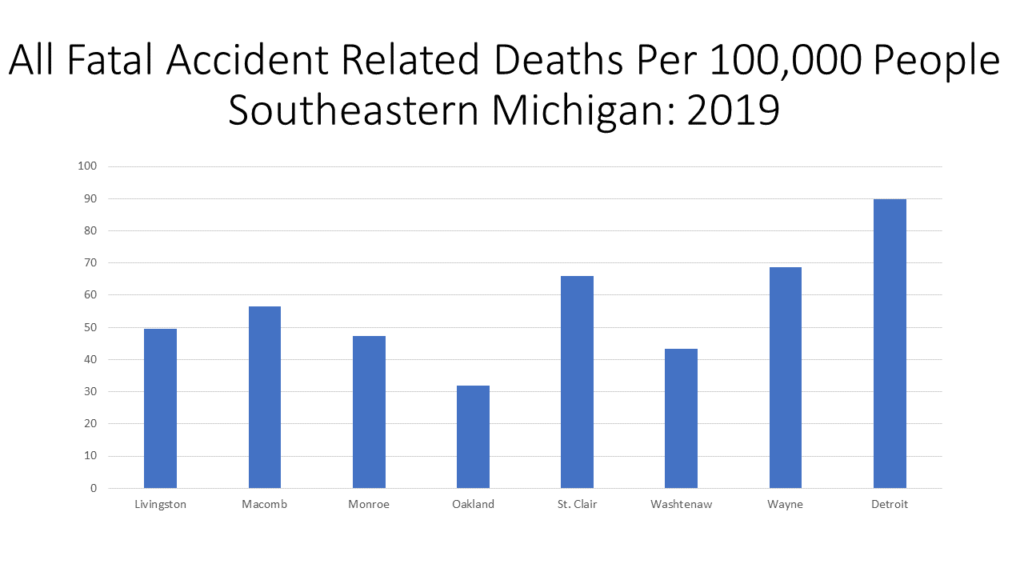
Fatal injury related deaths account for several different types of death, including general accidents, poisonings, suffocations, falls and injuries related to guns. Deaths from car crashes, slips, choking, drowning, machinery and other uncontrollable situations are deemed accidental. According to the data, Detroit had the highest rater per 100,000 people of all accident related deaths at 89.9 in 2019.
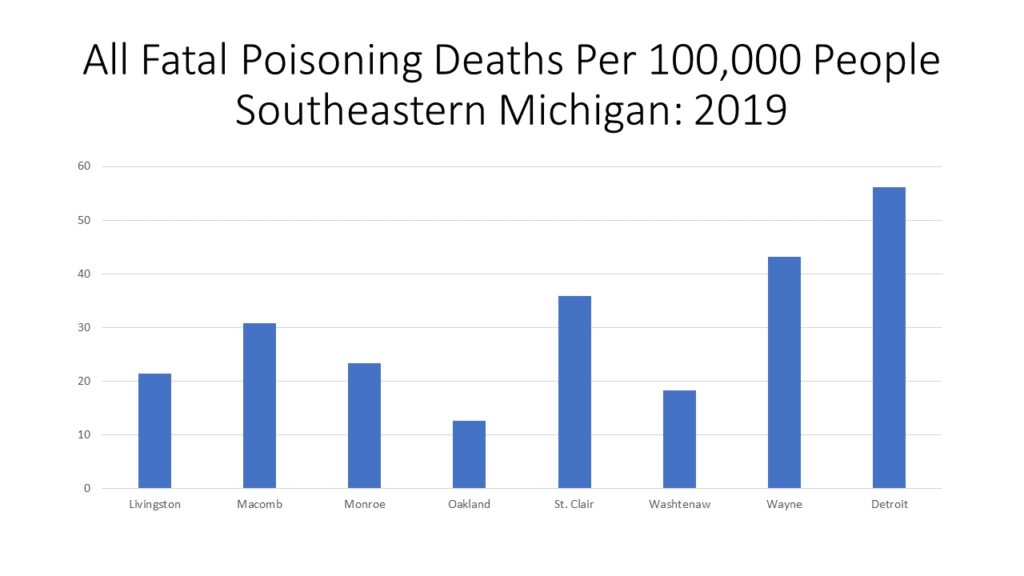
Poisoning deaths are also considered a fatal injury related death and Detroit again had the highest rate per 100,000 people for this type of death at 56.2; Wayne County had the second highest rate at 43.1.
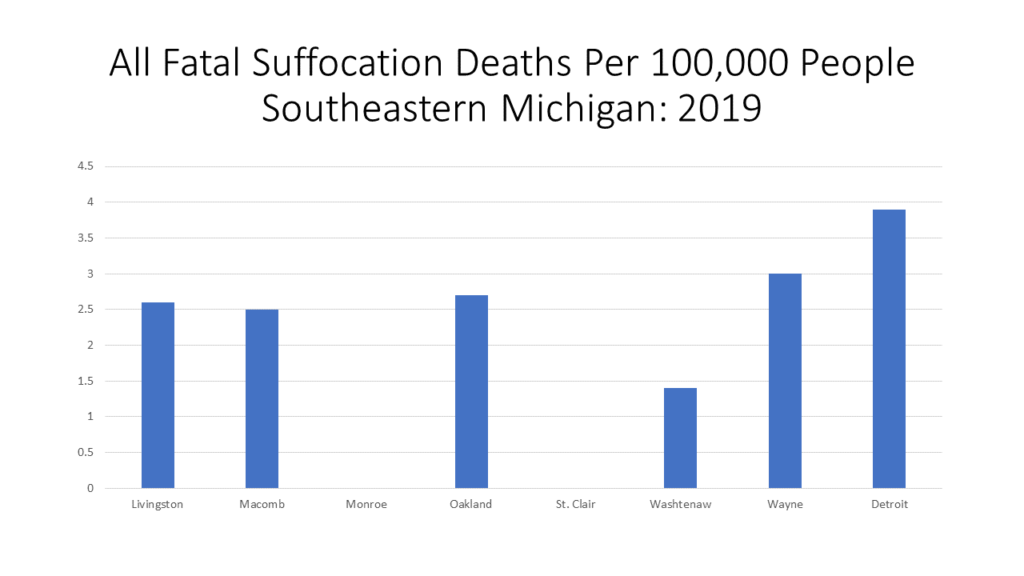
Suffocation deaths had the lowest rates in the region, with Monroe and St. Clair counties not even reporting enough data for a rate to be determined.  Detroit’s suffocation death rate was 3.9 per 100,000 people and Wayne County’s rate was 3.

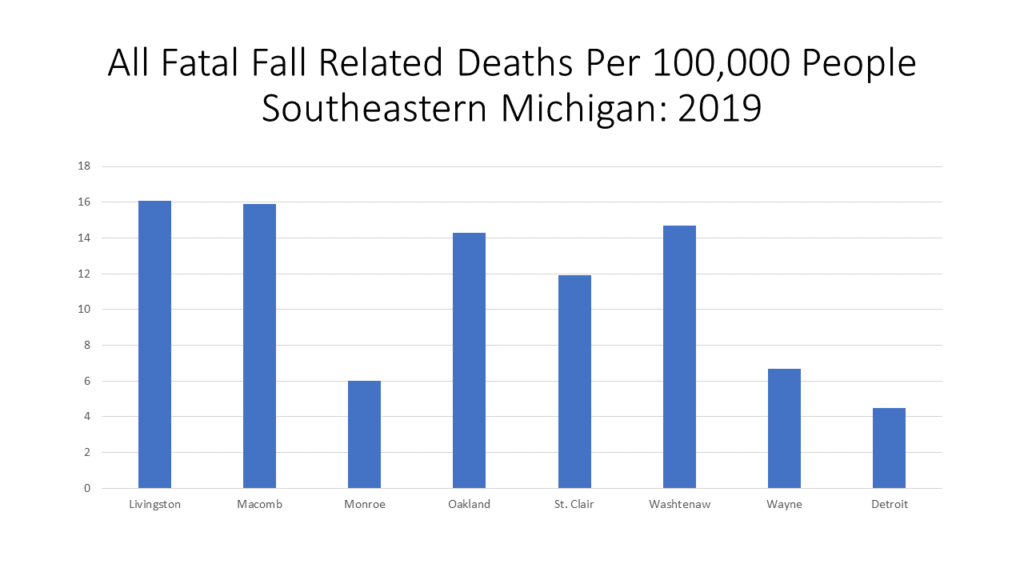
While Livingston County had amongst the lowest accidental death rates for the other types already discussed, it had the highest fatal fall related death rates in the region in 2019 at 16.1 deaths per 100,000 people followed by Macomb County with 15.9 deaths per 100,000 people.
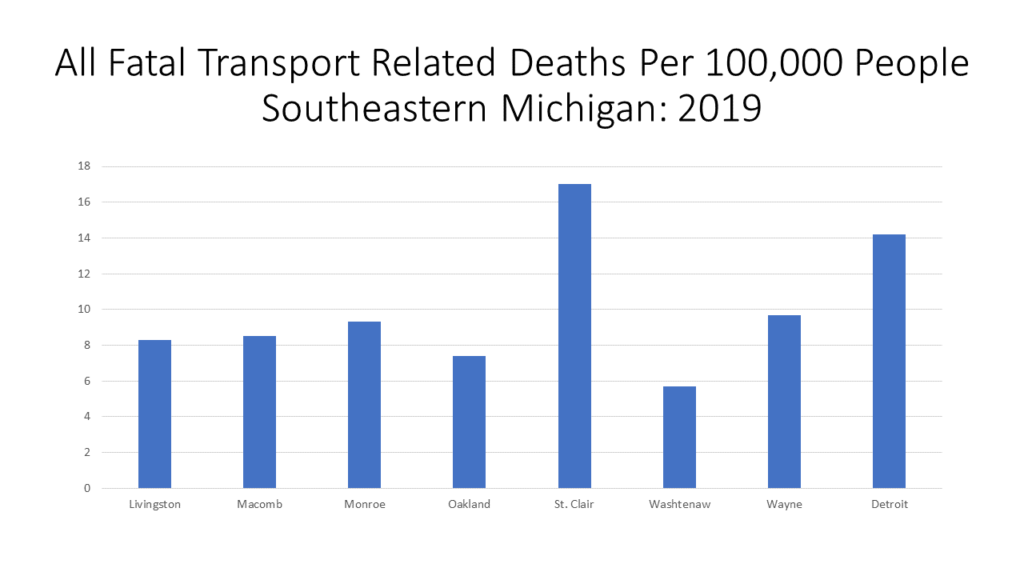
St. Clair County had the highest rate of fatal transport deaths at 17 per 100,000 people followed by Detroit at 14.2. A transport accident related death is any death that happens during road, rail, marine and/or air transport. These type of deaths can involve machines and pedestrians.
Overall, aside from all accident related deaths, poisoning deaths had the highest rates in 2019 in Southeastern Michigan. Poisoning is one of the top three leading causes of preventable injury-related death. The other top two preventable injury-related deaths are falls and car accidents, which would be included in transport deaths.

Flooding Grows More Common in Southeastern Michigan

Flooding in Southeastern Michigan continues to grow more common as weather patterns shift. In the summer of 2021 alone there have been at least three major flooding events, leaving hundreds of people with waterlogged basements, furniture and more. While the amount of rain certainly has an impact on the frequency of flooding, so does aging water infrastructure and various other household and neighborhood factors.

According to the June 2021 report “Household Flooding in Detroit” by Healthy Urban Waters, in partnership with the Wayne State Center for Urban Studies and others, 43 percent of 4,667 Detroit households surveyed between 2012-2020 reported household flooding. Furthermore, in an online Detroit Office of Sustainability survey published in 2018, 13 percent of those survey reported they experienced flooding very often; 23 percent reported they experienced flooding somewhat often and 32 percent reported they experienced it occasionally. Additionally, a cross-sectional study published in 2016 of 164 homes in Detroit’s Warrendale neighborhood indicated that 64 percent of homes experienced at least one flooding event in during that, with many experiencing three or four events, according to the report.

While we have the data on Detroit flooding, recent anecdotal tales tell us how cities throughout Southeastern Michigan—the Grosse Pointes, Dearborn and more—also continue to be affected by the surge of rain during storm events. Old infrastructure certainly impacts how a rain event affects a community, but so do other factors, such as the age of a home and if it is a rental versus being an owner-occupied unit.

According to the “Household Flooding in Detroit” study, Detroit renters were 1.7 times more likely to report household flooding than homeowners. In a different study, the 2021 Detroit Citizen Survey, individuals were provided a list of home problems and asked to identify which ones apply to their house or apartment. There were 570 respondents to this question and of those a total of 1,111 problems were recorded; four of the five top problems (mentioned by 83% of householders) concerned water in the home (from plumbing to flooding).

The first map above shows the hot and cold spots of flooding in Detroit using the Getis-Ord Gi* statistic. Red dots represent “hot” spots of statistically significant clusters of homes that have experienced flooding. Purple dots represent clusters of homes that have not report flooding. The map reflects responses from a sample of 4,667 Detroit households who participated in the Center for Urban Studies’ Home Safety Assessment survey between 2012 and 2020. Among these households, 2,546 (42.75%) reported household flooding. As shown in the first map, the “hot” spots for household flooding in the City are located in clusters in the north end of the City, in the Jefferson Chalmers area near the river and Grosse Pointe Park, the East Village/Indian Village areas and in the Warrendale/Rosedale Park/Michigan Marin areas. Also note, some of these “hot” spot flooding areas in Detroit border other areas that have experienced flooding during recent rain storms, such as Dearborn and Grosse Pointe Park.

The second map shows 2015 data of the percent of renters, by Census tract, in Detroit. Those Census tracts with “hot” flooding spots also have at least 30 percent of the population renting and data shows that neighborhoods with a larger proportion of renters (compared to owners) and homes built before 1939 are more likely to experience household flooding. According to the Census Bureau, about 33 percent of the City’s housing stock was built before 1939.

The flooding study also found that primarily Black communities were found to be at high risk for household flooding; according to the Census Bureau, 78 percent of Detroit’s population is Black.

So, while we know that flooding affects some communities in Southeastern Michigan more than others and that the risk for the region will only increase as the effects of climate change grow, there actions that can be taken to mitigate flood damage. Updating water and sewer infrastructure to increase its reliability is a high, yet expensive, priority to help decrease the risk of in-home flood events for communities at-large. Investment in green infrastructure, such as rain gardens, is another option as is identifying parts of communities most prone to flooding and further investigating the specifics behind it. But again, these require time and money and municipalities regularly struggle to maintain their infrastructure, let alone allow for major upgrades.

Infrastructure investment is necessary, but so are larger actions to help slow the affects of climate change.

What Biden Should Do for Detroit: The Citizens’ View

A lot of expectations come with being elected President of the United States, and the citizens of Detroit want President Joe Biden’s top priority to be continuing to navigate the COVID-19 pandemic.

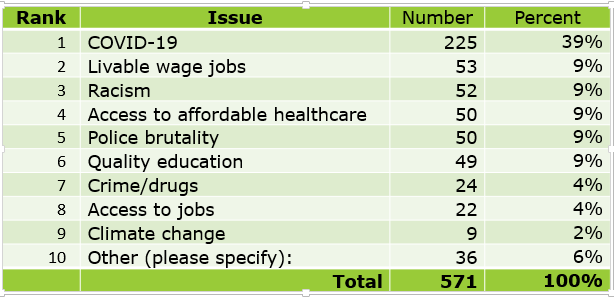
According to the 2021 Detroit Resident Survey conducted by the Wayne State Center for Urban Studies between Jan. 15 and March 1, 2021, 39 percent of respondents said COVID-19 should be President Biden’s top issue. Respondents, all who are Detroit citizens, were asked to choose from a list of 10 priorities on what they believe should be the top. Of the 571 respondents to this question 225, or 39 percent, said it should be COVID-19. Livable wages, racism, access to affordable health care, police brutality and quality education were all separate priorities that each received 9 percent of the vote as to what Biden’s top priority should be.

As of March 28, 2021 an ABC News/Ipsos poll found that President Biden received a 72 percent national approval rating for his handling of the COVID-19 pandemic. Additionally, the same ABC News article states 75 percent of Americans back how the President is handling the distribution of COVID vaccines. In the State of Michigan 653,659 COVID-19 cases were confirmed as of March 27, 2021 and in Detroit 32,998 COVID cases have been confirmed. In terms of vaccine distribution, according to the State of Michigan, 18 percent of residents are fully vaccinated and 31 percent of residents have started the process. Furthermore, 9.5 percent of Detroit residents are fully vaccinated and 17.6 percent have started the process, according to the City of Detroit Health Department.

While vaccination numbers continue to rise in Detroit and the State of Michigan, so do COVID numbers. On March 26, 2021 there were 4,670 new cases in Michigan and a 10 percent positivity rate, the highest recorded since December 2020.

Aside from COVID infections and deaths, economic and education issues related to the disease loom too. In February of 2021 the Michigan unemployment rate was 5.2 percent and in Detroit the unemployment rate was 11.4 percent in January of 2021 (the most recent data at the local level). And, just as soon as schools began to open, several districts are again moving back to online learning in response to the uptick in COVID cases.

While Detroit citizens have opinions of what Biden’s top priorities as President should be they also expressed opinions on the following in the 2021 Detroit Resident Survey:

  • What they feel the state of leadership is at the federal, state and local level;
  • How Detroit officials can best serve their citizens;
  • What their top household and community concerns and problems are;
  • What the barriers to finding employment and building wealth are;

The responses to these issues will be further explored this week in additional blog posts.

All response data in this post and in upcoming posts are from the 2021 Detroit Resident Survey conducted by the Wayne State University Center for Urban Studies, with the assistance of the MDPBlack Caucus. The survey was based on a random sample of about 20,000 households whose information was purchased from a business marketing vendor. The households were distributed throughout Detroit and where available, the vendor provided landlines, mobile telephone numbers associated with each household. Survey interviewers reached 953 individuals, 678 of whom confirmed they were Detroit residents. The Survey Findings are based on weighted totals and statistics to achieve representative findings. Respondents received a chance to be randomly selected to receive one of 10 $50 visa gift cards.

Detroit’s Infant Mortality Rate Reaches 13 Year High

Michigan ranks 36th in the country in infant mortality and the City of Detroit has the highest number of infant deaths in the State, according to the Michigan Department of Health and Human Services. In 2018, the most recent year for which data was available, Detroit’s infant mortality rate was 16.7, the highest its been since 2002 when the rate was 16.8 These two rates translate to 9,476 (2018) infant deaths and 14,187 (2002) infant deaths, respectably. The infant death rate is the number of resident infant deaths divided by total resident live births X 1,000.  Infant deaths are deaths occurring to individuals less than 1 year of age.

As shown in the first chart below, Detroit infant mortality rates are consistently much higher than those of any county in Southeastern Michigan, and any other county in the State. Detroit’s infant mortality rates are also consistently higher than the State average. And, while the State’s infant mortality rates have been declining overall since 2000 Detroit’s rate has increased 3 points since 2016. It is important to remember that over 50 percent of children in Detroit families live below the poverty rate, far higher than elsewhere in the state.

Monroe and Livingston counties have regularly had the lowest rates; in some years not enough data was available for a rate. While we know that Detroit and Wayne County’s infant mortality rates are much higher than those in Monroe, Livingston and Washtenaw counties we also know that race plays a role in infant mortality rates. According to the US Department of Health and Human Services Office of Minority Health, African Americans • Have 2.3 times the infant mortality rate as non-Hispanic whites;

•Are 3.8 times as likely to die from complications related to low birthweight as compared to non-Hispanic white infants;

•Had over twice the sudden infant death syndrome mortality rate as non-Hispanic whites, in 2017.

Additionally, in 2017, African American mothers were 2.3 times more likely than non-Hispanic white mothers to receive late or no prenatal care. The evidence of these statistics are also apparent in the second chart below.

In 2018, the most recent year for which data was available, the infant mortality rate for black babies in Detroit was 15.9 while for white babies it was 7.1. That gap between infant mortality rates of white and black was even larger at the State level ( 14.4 for black babies and 4.4 for white babies) and at the county level in the region (compared to that in Detroit), where median incomes tend to be higher. Furthermore, Detroit’s overall infant mortality rate is likely the highest in the State because it has among of the highest percentage of black residents. According to the US Census Bureau, 78 percent of Detroit’s population is black, 39 percent of Wayne County’s population is black while 1 percent of Livingston County’s population is black and 2 percent of Monroe County’s is black. Statewide, 14 percent of the population is black.

Not only should the increasing infant mortality rates of Detroit and Wayne County be of concern, but so should the causes. As alluded to above, race and income are contributing factors to infant mortality rates, as is racism. According to the Michigan League for Public Policy’s report “Strong Moms for Thriving Babies: Right Start 2020“ issues such as poverty and racism must be addressed in order for local infant mortality rates to decrease. Recommendations to do this include extending Medicaid coverage to 12 months postpartum; allowing for and enhancing reimbursement rates; increasing the number of high-quality home visiting programs to establish healthy starts for families by offering moms and their children, valuable health screenings and connecting families; restoring Michigan’s Earned Income Tax Credit; and advocating for paid paternity leave.

Statewide, a $12.6 million annual budget for the new program “Healthy Moms, Healthy Babies” was approved as part of the 2021 budget. This program is aimed at decreasing the infant mortality rate while providing the resources in order to accomplish that goal. Components of this program include:

• Plans to expand healthcare coverage for a mother to a year;

•Moving a woman’s first postpartum visit to within three weeks, with a comprehensive visit within twelve weeks;

•Requiring implicit bias training for medical professionals;

•Expanding home visits;

•Allowing the woman to chose what form of birth control works best for her.

The problem, however, is that divided evenly this would provide only about $116 per child under one. If it were concentrated on only the 19%  of children in poverty, this would set aside a bit over $500 per child. Is it likely this is enough to make substantial change?

Livingston County has Highest Rate of Vaccine Waivers in Southeastern Michigan

As of April 5, 2019 there were 39 confirmed cases of measles in Michigan. According to media reports, those confirmed to have measles range in age from under a year old to 63 years of age, and at least three of the individuals with measles obtained both doses of the Measles, Mumps and Rubella (MMR) vaccine.

According to the Michigan Public Health Code, there are a variety of vaccines, like the MMR vaccine, that students must obtain before entering kindergarten. Students entering school also have the option to receive a vaccine waiver though. In Michigan, like every other state in the U.S., vaccine waivers are given for religious reasons. Additionally, Michigan also allows exemptions for philosophical reasons. In order to opt children out of vaccination, parents are required to receive education on the benefits of vaccination and the risks that come when an individual isn’t vaccinated.

Regionally, Livingston County had the highest percentage of school-aged children with immunization waivers at 7.9 percent. St. Clair County had the next highest percentage of children with immunization waivers at 5.5 percent. Wayne County had the lowest percentage of immunization waivers at 3 percent.


Across the State of Michigan the percentage of children receiving vaccines began to drop in 2013, and while there was a slight uptick between 2016 and 2017 (3.9% to 4.2% for kindergartners) there has still been an overall decrease since 2010. It was in 2010 that additional vaccine requirements were added by the state, according to the Michigan Department of Health and Human Services. Overall, public health officials said the anti-vaccine movement is growing, in large part due to the ability social media has to spread information, and misinformation.

To learn more about the immunization of your child’s school, click here.  

Opioid Deaths in Southeastern Michigan Continue to Rise

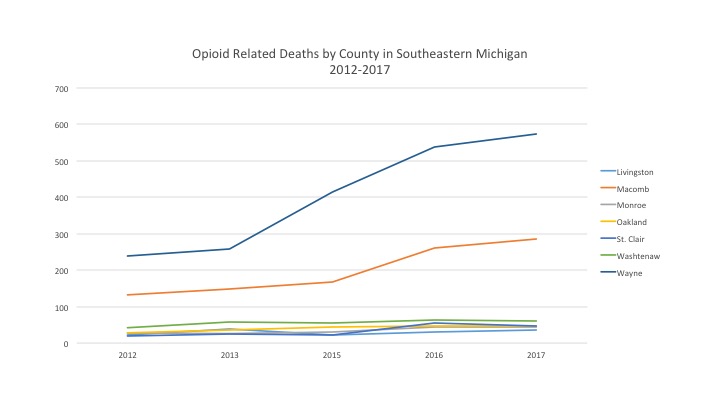
In 2017, according to data from the Michigan Department of Health and Human Services, both Macomb and Wayne counties had the highest rate of opioid related deaths per 10,000 residents. Both counties had an opioid related death rate of 3.27. In our region, Oakland County had the lowest opioid related death rate in 2017 at 0.38.

When examining the sheer total of opioid related deaths between 2012 and 2017 we see that Wayne County not only had the highest total number of deaths each year, but also the largest increase. Between 2012 and 2017 Wayne County had an increase of 335 in the number of opioid related deaths. Macomb County had the second highest total number of opioid related deaths each year in the region, growing from 132 in 2012 to 285 in 2017. Macomb and Wayne counties were the only two in the region with opioid deaths totaling more than 100 each year.

Just last week, Gov. Gretchen Whitmer and former New York City Mayor Michael Bloomberg stood inside a Macomb County fire and rescue building to report that the State of Michigan was a recipient of a $10 million grant from Bloomberg Philanthropies to combat the opioid crisis. Through this grant, and various partnerships, high-impact, state-based interventions with a focus on identifying novel approaches to address gaps in current treatment and prevention programs,” will occur. Programs already in place in Michigan to combat the opioid crisis include expanding the distribution of naloxone (a drug used to counter-act opioid overdoses) into the community, a Michigan State Police program that allows victims of addiction to walk into any MSP post and get help without fear of being criminally charged and providing access to real-time information on prescription data and analytics of controlled substances for prescribers and pharmacists.

Equal Equitable Policies Needed for Longer Life Expectancy

Socioeconomic factors have a direct impact on the span of one’s life. Our posts on January 3,16 and 23 have demonstrated clear relationships between lifespan and key policy variables.

Where do you live? What is your highest-level education? How much do you earn? Do you have access to health care? Depending on how an individual answers each of those questions, their life expectancy may go up or down.

As we’ve learned over the last several weeks:

  • Those living at or below the poverty line have a lower life expectancy.
  • Those with a bachelor’s degree or higher have a higher life expectancy.
  • Those without health insurance have lower life expectancy.

We further examined the combined impact of these three factors to help understand which is most important. Using multiple regression analysis, we estimated the impact of each variable as well as their combined effect. Together they explain 62.6% of the variance in life expectancy across the region, meaning that nearly two thirds of one’s age at death is related to their combined effect. This is a highly statistically significant effect with less than one chance in a 1,000 that this estimate is a result of chance. Further, of the three variables, the most powerful variable is the level of education (b=0.100; beta=0.456). It is almost one and half times as powerful as poverty (-0.099; -0.345) the second most powerful variable. And education is four times as powerful as being uninsured (-0.081;-0.101).

Nevertheless, all three of these variables contributed an independent effect on life expectancy. These variables are correlated with each other, which under certain conditions can bias these results, but after examining statistics such multicollinearity this does not appear to be a problem. So, while poverty effects both education and the likelihood that somebody in uninsured, each provides an independent effect. No doubt other factors do as well, including chance, habits, and one’s genetic background.

Still it is both sad and potentially hopeful that much of the differences in life expectancy across our region can be explained by these factors because all of these factors are ones we, as a society and a polity, can affect.

This helps us answer the question of what can be done to improve average length of an individual’s life. We need to start by decreasing poverty. Decreasing poverty is not easy to tackle, but there are steps policy makers can take to lower the number of people living at or below the poverty level. Such actions include increasing the minimum wage, creating policies focused on long-term job growth and supporting equity in pay structures, job opportunities and available housing. Perhaps the most important policy is to use the tax system to redistribute income by taxing the very rich (the one and two percenters) to provide supports and services to those with less income. Remember the U.S. once taxed high earners at a rate over 70 percent.

More tax revenue would support higher education, which has recently been strangled by decreasing support from state governments and increasing reliance on student loans. The over-reliance on loans burdens graduating students with long term loan payments, which decrease their mobility and their ability to pursue graduate education.

The creation of a semblance of a national health care system through Obamacare has provided some basic protections for many who had no care. There are, however, still many that do not have care or for whom care is so expensive they cannot truly afford it. Increasing access to health insurance will also require extensive work, but one way to start includes providing information to the underserved on their current options to receive healthcare, and extending these services. Policies reforming the fee structures instituted by insurance and medical companies and creating alternative payment methods are other ways to make health care more accessible.

Overall, discovering reasons why certain communities in Southeastern Michigan have such lower average life expectancies helps us understand what we need to move ahead. Let’s provide them with the income to create healthy lifestyle and sustain longer lives. However, actions must be taken in order for those opportunities to be made available. We as a society, and our policy makers, need to ensure equity and equality are inherent parts of the socioeconomic policies that can ultimately give individuals an opportunity to live a longer life.


Education Related to Life Expectancy in Southeastern Michigan

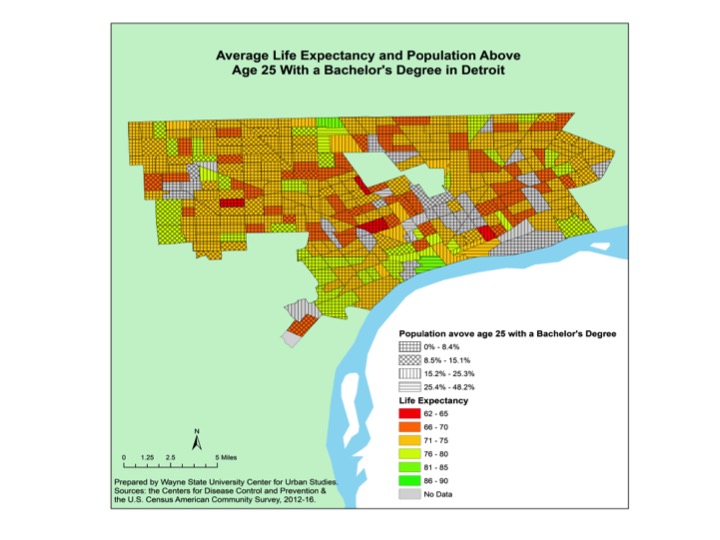
Another way to think about life expectancy is to say that it is partially a result of the choices we make, and the quality of choices might be indicated by our extent of education. Here we have represented education by the percent of a tract’s population over 25 that has a bachelor’s degree or higher. One could argue, appropriately, that getting a college education is at least partially a function of family income, but for now we want to see the simple correlation of this measure or education and life expectancy. We find a correlation between life expectancy and those with a bachelor’s degree or higher is 0.721 (sig. 0.00), meaning, as an individual’s education level increases so does their average age of life expectancy. In Detroit, the map below shows that majority of the Census Tracts that make up the City have about 8 percent of the 25 years of age and older population having earned a bachelor’s degree or higher. And, as we’ve discussed throughout this series, Detroit has among the lowest average life expectancy rates in the Southeastern Michigan region. The two Census Tracts in Detroit with the highest life expectancy rates (86-90 years of age) also have the highest percentage of individuals age 25 years and older with a bachelor’s degree or higher. The one Census Tract just south of 8 Mile Road with the highest average life expectancy rate has between 15 and 25 percent of the 25 years of age and older population having earned a bachelor’s degree or higher. The other Census Tract in Detroit with the highest average life expectancy is just southwest of Downtown Detroit and has between 25 and 48 percent of the 25 and older population having earned a bachelor’s degree or higher. On the opposite side of the spectrum, three of the four Census Tracts in the Detroit with the lowest average life expectancy (62-65) also have the lowest percentage of residents 25 years of age and older who earned a bachelor’s degree or higher.

Outside of Detroit there are similar trends: communities with lower average life expectancies tend to also have lower percentages of individuals with a bachelor’s degree or higher. For example, the majority of Washtenaw County has an average life expectancy at 86 years of age or older. Additionally, the majority of that county has 15 percent or more of the 25 years of age and older population having earned a bachelor’s degree or higher. There are exceptions, areas in the more rural counties, particularly Monroe and St. Clair counties, though that have average life expectancies above the regional average but have lower percentages of individuals living with a bachelor’s degree or higher.

As has been shown above, there is a strong positive correlation between the percentage of individuals 25 years of age and older who earned a bachelor’s degree or higher and an individual’s life expectancy. This positive correlation is further demonstrated in the scattergram below, which shows that as the percentage of the population with a bachelor’s degree or higher increases, so does the average life expectancy. The chart also shows that majority of the population in Southeastern Michigan has a life expectancy between 70 and 80 years of age with 20 percent or less of that population having earned a bachelor’s degree or higher. Additionally, the chart shows that any area with a population that has 60 percent or more of the population having earned a bachelor’s degree or higher has an average life expectancy of 75 years of age or higher.

As has been shown through some of the examples above, there is a strong positive correlation between the percentage of individuals 25 years of age and older who earned a bachelor’s degree or higher and an individual’s life expectancy. This positive correlation is further demonstrated in the chart above, which shows that as the percentage of the population with a bachelor’s degree or higher increases, so does the average life expectancy. Additionally, the chart shows that any area with a population that has 60 percent or more of the population having earned a bachelor’s degree or higher has an average life expectancy of 75 years of age or higher.

Overall, these maps and the graph show that education is related to an individual’s life expectancy. Reasons for this include, tendency to earn higher wages, which allows easier access to health care and transportation. In a recent News Scientist article it was also stated that more education leads to higher life expectancy because education improves an individual’s cognitive abilities, which allows for better planning and self-control.

Next week, we will further examine how all three factors, education, access to health insurance and poverty, all affect an individual’s life expectancy.

Lower Life Expectancy Related to Lack of Health Insurance

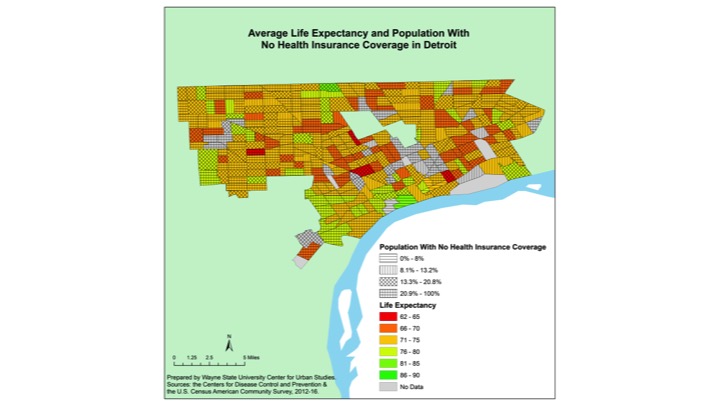
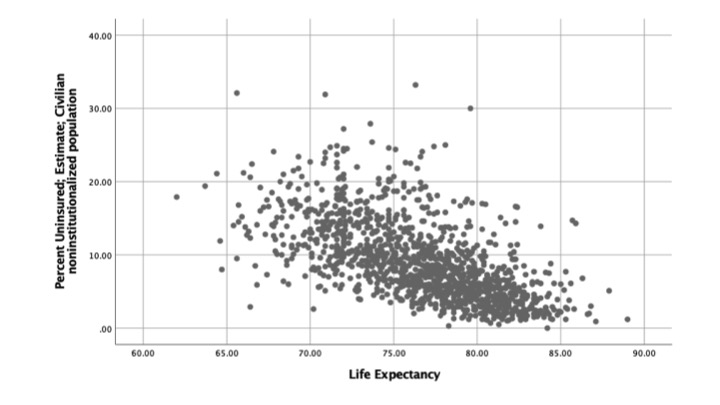
The correlation between life expectancy and those who are uninsured is -0.617 (sig. 0.00), meaning that there is moderately strong tendency for the length of life to decline as lack of access to health care (i.e. being uninsured) increases. In general, those without health insurance tend to live shorter lives. For example, in the City of Detroit, there are more than 25 different Census Tracts where residents have a life expectancy of 70 years of age or less. Of those Census Tracts, majority of them have 21 percent of the population or more living without health insurance. Even as life expectancy increases to the median range of the spectrum in Detroit, the evidence shows that majority of the Census Tracts have about 13 percent of the population or more without health insurance. Interestingly though, only one of the four Census Tracts where the average life expectancy is 65 years of age has 21 percent or more of the population living without health insurance. The other three Census Tracts with such an average life expectancy has between 13 and 21 percent of the population living without health insurance.

When moving beyond the boundaries of Detroit, in many of the outer-ring suburbs life expectancy increases as does the percentage of residents with health care. For example, majority of Washtenaw, St. Clair and Monroe counties have less than 13 percent of the populations living without health insurance and average life expectancies at 76 years of age or higher. With the exception of one Census Tract in southern Monroe County, no other areas in those three outlying counties have more than 21 percent of the population living without health insurance. As you do move in closer to Detroit though, there are wider ranges of life expectancies and access to health care. In Wayne County, for example, areas such as Romulus and Lincoln Park also have lower life expectancies (70 years of age or less) and more than 21 percent of the population not having health insurance. But, there are also areas, such as Grosse Ile, where the average life expectancy is 86 years of age and above and 8 percent or less of the population do not have health insurance. While the average life expectancy tends to be higher in Macomb and Oakland counties, there are still pockets, such as South Warren, Mt. Clemens and Pontiac, where the average life expectancy is 70 years of age or less and those without health insurance is at about 13 percent or higher.

As has been shown through some of the examples above, there is a moderately strong negative correlation between the percentage of the population living without health insurance and the average life expectancy of Census Tracts in Southeastern Michigan. This is further demonstrated in the chart above, which ultimately shows that as the percentage of the population living without health insurance increases the average life expectancy decreases. The chart also shows though that majority of the Census Tracts in Southeastern Michigan have an average life expectancy of about 75 years of age or higher with 10 percent of less of the population living without health insurance.


Overall, these maps and the graph show that while there is a range in life expectancies in Southeastern Michigan, there is also a range in those with access to health care, particularly those in and around Detroit. Access to health care is important as health care providers can not only treat, but also prevent, a plethora of illnesses and diseases. Such knowledge and treatment is vital for longer life expectancies.