Poverty Affects Life Expectancy in Detroit, Region

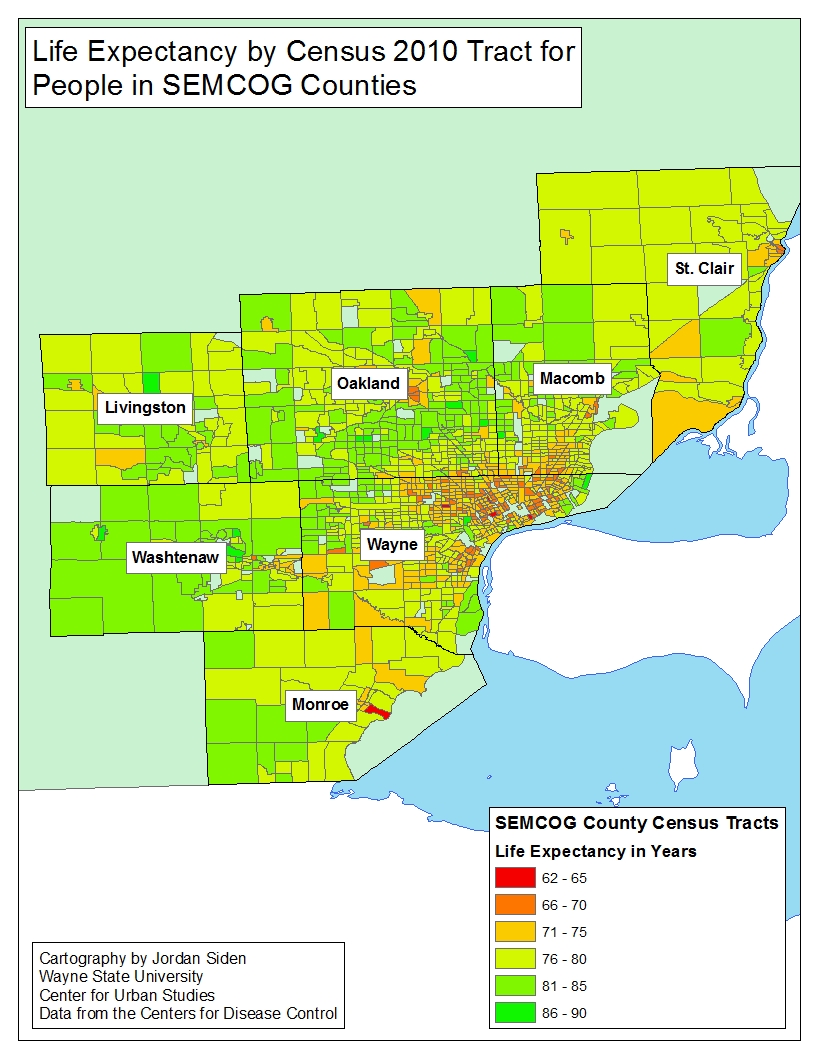
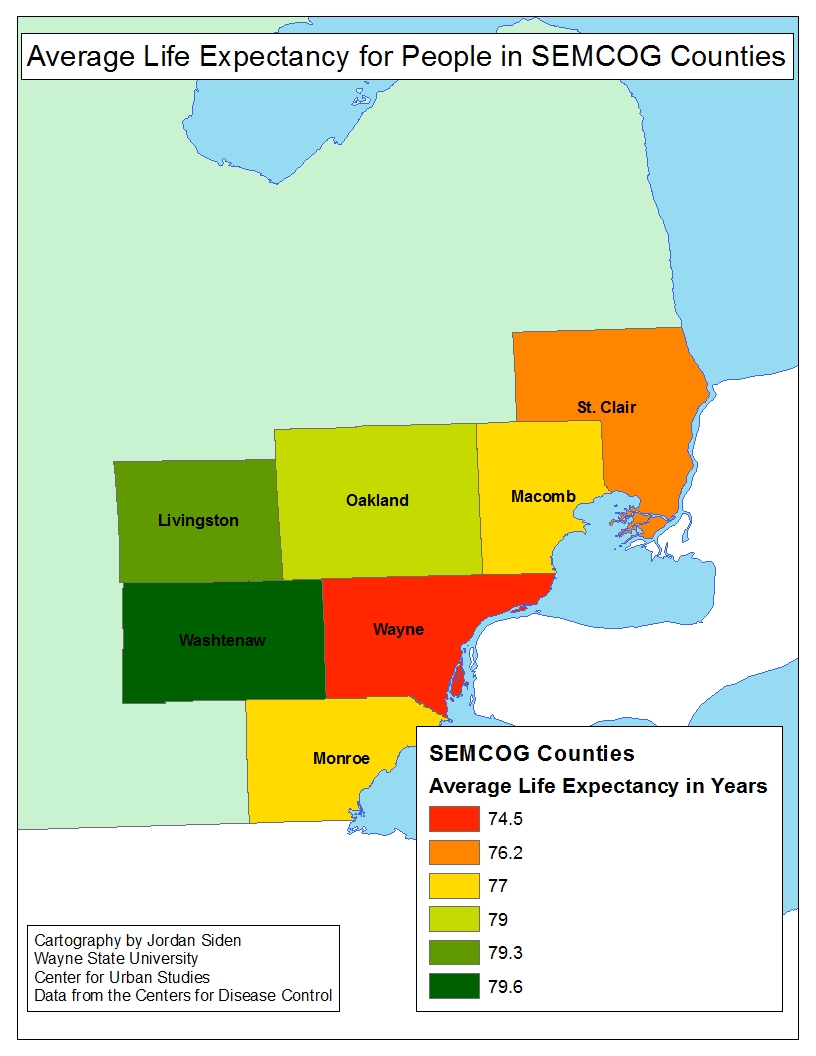
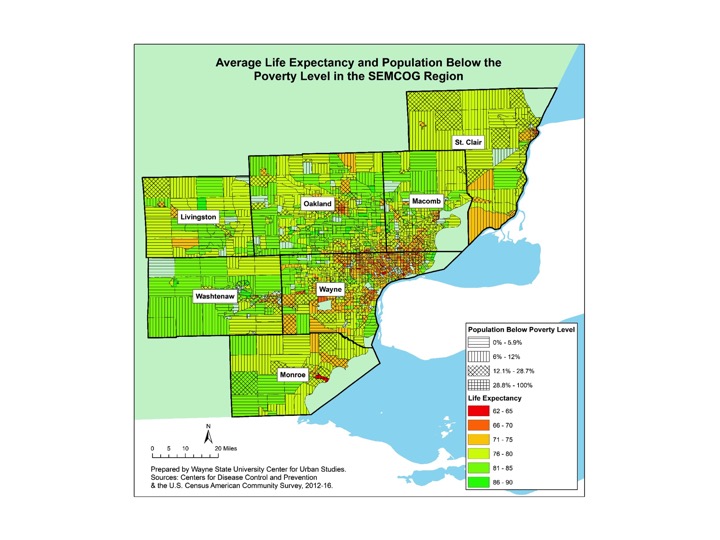
There is a huge variation in life expectancies in Southeastern Michigan, from an average of 62 years in the lowest Census Tract to a high in 85.9 in the highest tract. Moreover life expectancy is closely and negatively related to poverty. The correlation between life expectancy and poverty is -0.713 (sig. 0.01), meaning that there is moderately strong tendency for the length of life to decline as poverty increases in a tract. Or, put simply, poor people die sooner, a lot sooner. Both the maps and chart below present the relationship between shorter life expectancy and poverty or conversely lower levels of poverty in a tract and higher average life expectancy. At the same time, the majority of the areas in Southeastern Michigan have 20 percent or fewer of families living below the poverty line, along with average life expectancies between about 75 and 85 years of age. For reference, the average life expectancy in the United States is about 79 years of age and the federal poverty level for a family of four is $24,300. In 2017 12.7 percent of the U.S. population was living in poverty.

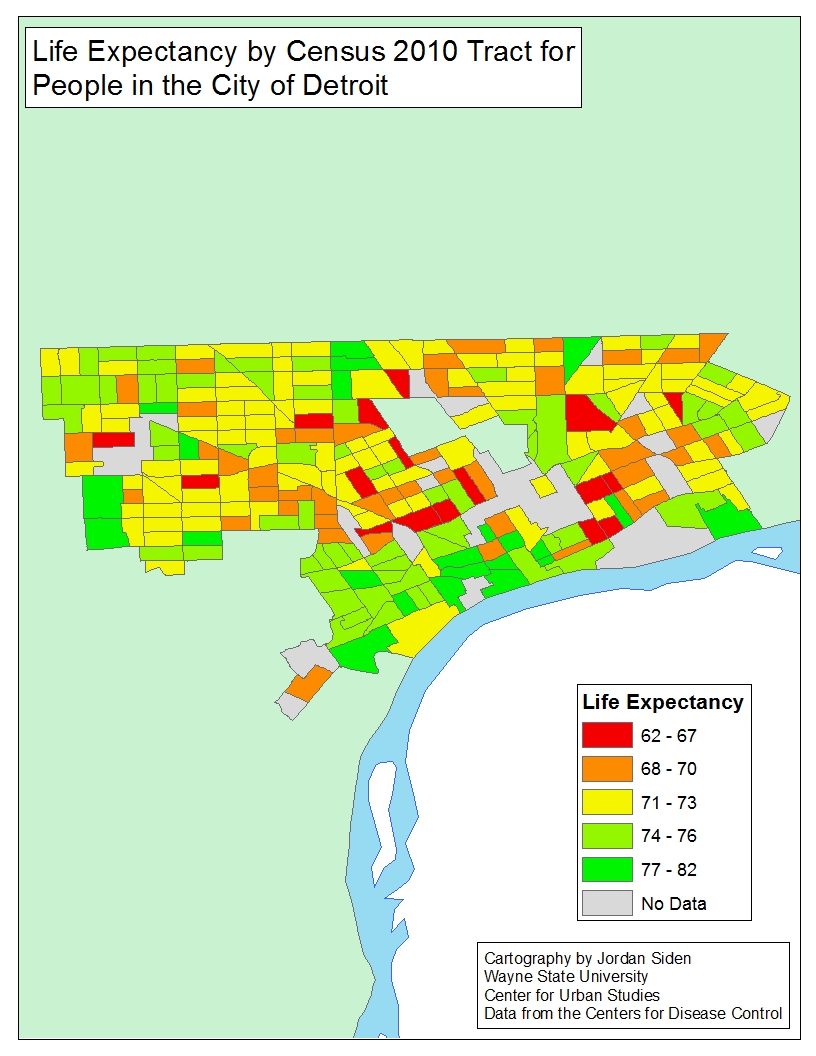
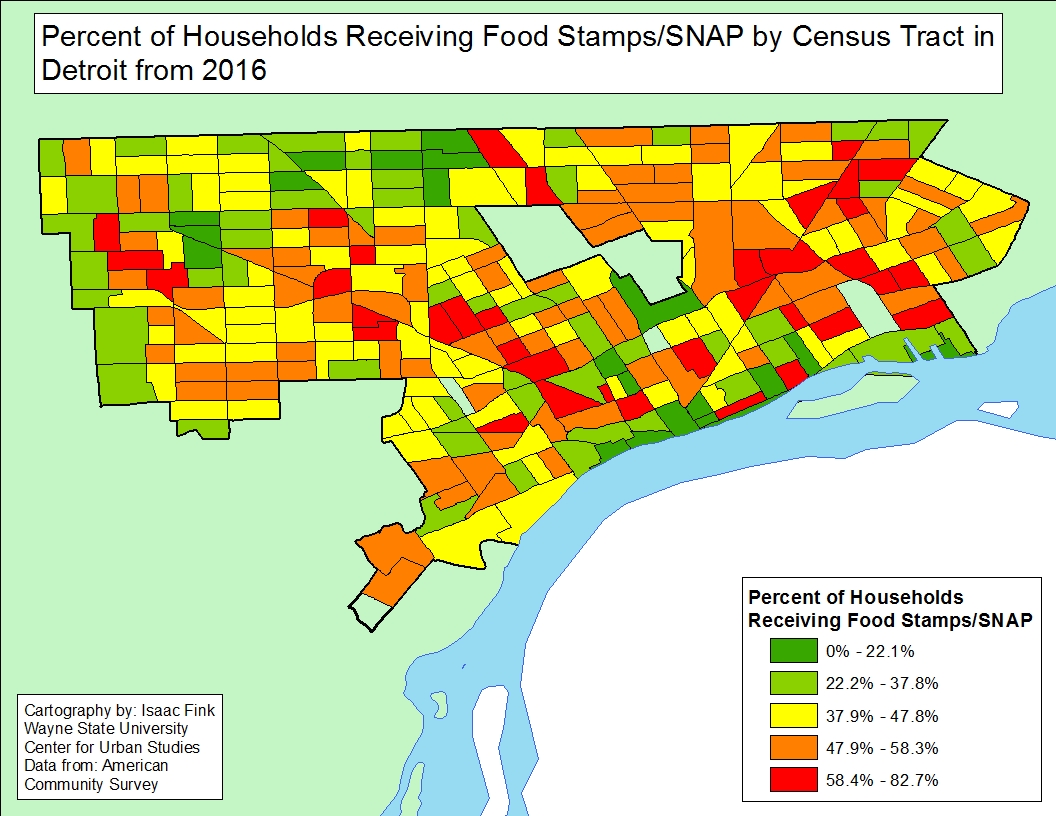
For the City of Detroit there is an average life expectancy across tracts is 71 to 75 years of age, although there are several Census Tracts where the average life expectancy is well below 70. Most of the Census Tracts in Detroit, especially those with lower life expectancies, have more than 28 percent of the population living at or below the poverty line. Specifically, there are three Census Tracts in Detroit where the average life expectancy is between 62 and 65 and the percentage of the population living below the poverty line ranges from about 29-100 percent (the highest threshold in the Detroit map below). While Detroit demonstrates the correlation between higher than average poverty rates and lower life expectancy, there are certain parts of the region where the life expectancy is about on par with the national average (78.8 years of age) but the percentage of the population live in poverty is at or below the national poverty rate (12.7 percent). These examples occur in the mainly the rural areas of the region, such as parts of St. Clair, Livingston and Monroe counties. In general though, radiating out beyond Detroit and the inner-ring suburbs, poverty levels decrease, and the average life expectancy increases. For example, in nearly all of western Washtenaw County the average life expectancy ranges from 81-85 with the poverty levels being at or below 12 percent.

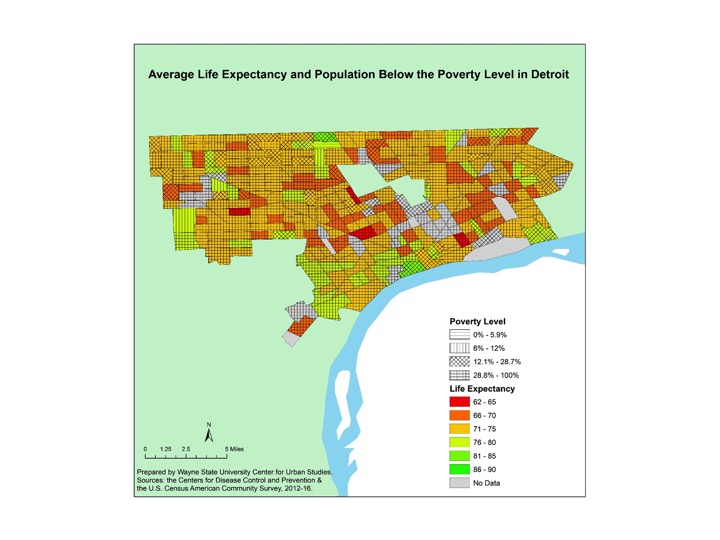
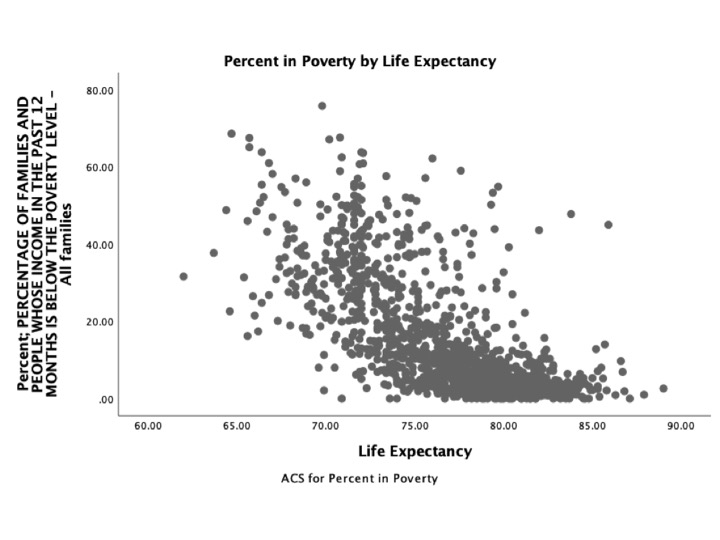
As has been attributed in some of the specific examples noted above, there is a moderately high negative correlation between the percentage of the population living at or below the poverty line and the average life expectancy of Census Tracts in Southeastern Michigan. When looking at the median poverty levels of the region with the life expectancies there is a -0.713 P value, which is statistically significant at the .01 level. What this means is that as the percent in poverty increases, there is a tendency for average life expectancy to decrease.

Overall, these maps show that throughout Southeastern Michigan there is a wide range in life expectancy and poverty levels, with outer ring suburbs faring better and more urban areas, such as Detroit, and some rural areas faring worse. While we see here that poverty does relate to average life expectancy rates, other factors that may also affect average life expectancy include access to health care and educational attainment. The correlation between these factors and the average life expectancy will be explored in the next two posts.

Average Life Expectancy in Southeastern Michigan Varies Greatly

We know that one of the outcomes of poverty and the consequent lack of high quality medical care is a shorter life. How big is that difference in Southeastern Michigan? It turns out that new data from the U.S. Centers for Disease Control gives us an idea. That data, at the Census Tract level, shows that average life expectancy ranges from 62 in some inner city Detroit tracts to 90 in some suburban tracts.

As the second first map below shows, most of Livingston County was in the 76-80 years of age range, although there are 18 Census Tracts in Livingston County where the average life expectancy is between 86 to 90 years of age. It is in Wayne County where all the Census Tracts are located, with the exception of one, with the lowest average life expectancies. As the second map shows, in the City of Detroit, there are 14 Census Tracts where the average life expectancy is between 62-65 years of age. Additionally, there are about 40 Census Tracts where the average life expectancy is between 68-70. Most of these Census Tracts are located west of Highland Park, with several located along Grand River Avenue. The only other Census Tract in the region with an average life expectancy below 66 years of age is in Monroe County in the City of Monroe.

The extremes of the data are attenuated when we examine county averages as shown in the third map. The average life expectancy in Southeastern Michigan at the county level ranges from 74.5 years of age to 79.6 years of age. The average life expectancy in the U.S. is 78.8 years of age. At the county level, Livingston County has the highest average life expectancy at 79.6 years of age.

While there is no specific information on what causes low life expectancy in any specific area, a Michigan Department of Health and Human Services spokesman said higher life expectancies are often related to higher education and access to health care and healthy food. In future posts we will examine what may cause the lower life expectancies in the Detroit area.

Detroit’s HIV Rates Highest in the Region

The City of Detroit had the highest HIV rate per 100,000 people in the Metro-Detroit region, according to the most recent data released by the Michigan Department of Health and Human Services. The rate per 100,000 people as of January 2018 was 718. Regionally, Wayne County (excluding the City of Detroit) had the second highest rate per 100,000 people at 190. Livingston County had the lowest rate in the region at 54 per 100,000 people. While there is no single reason as to why Detroit has such a high HIV rate (more than four times that of the State’s average rate) there is belief among experts, according to a recent Detroit Free Press article, that it is tied to socioeconomic factors like poverty, health care access and transportation for health care access. In Detroit, according to the most recent Census data, 57 percent of the population has public health insurance coverage and 15 percent has no health insurance. According to a recent Detroit Free Press article, the number of new people diagnosed with HIV cases Michigan has remained fairly stable since the early 2000s, but there has been an increase in the number of young African American gay and bisexual men who have been diagnosed in recent years. Additionally, of those diagnosed with HIV in the State of Michigan, about 51 percent are between the ages of 40-59 years old and 78 percent of Michigan’s population living with HIV are males.

While medical advancements are being made toward finding a cure for HIV, that has yet to occur. Rather, to control and prevent the virus from evolving into AIDS, those diagnosed need to carefully and consistently treat the disease. In Detroit, according to the Michigan Department of Health and Human Services, about 20 percent of the diagnosed HIV population goes without regular treatment. Reasons for this are not concrete but it can be speculated that it is related to income, access to health care and overall knowledge on the disease and its treatment. For example, the average lifetime cost for HIV treatment is estimated to be about $400,000 and the annual median income in Detroit is about $26,000. According to the Michigan Department of Health and Human Services those most likely to not receive consistent care in Michigan are: those between the ages of 20-29 (23 percent not receiving treatment), foreign-born individuals (32 percent), Hispanic males (25 percent) and those who inject drugs (23 percent).


Although the numbers show that those becoming infected with HIV remains a problem, funding at the State level has dropped over the years. In 2017 $19.4 million was allocated towards assisting those with HIV (medication, medical transportation and services). In Detroit, and throughout the region, there are several options for an individual to receive help. For more information, click here.

Wayne County Has Highest Average Payment for Food Stamps

In Southeastern Michigan, Wayne County had both the highest average payment per person for the state’s food assistance program and the highest number of both adult recipients and child recipients, according to 2018 from the Michigan Department of Health and Human Services. The Michigan Food Assistance Program is a temporary food assistance program for eligible low-income families and individuals; the program is administered through the U.S. Department of Agriculture. At the federal level this program is referred to as the Supplemental Nutrition Assistance Program (SNAP).

According to the data, thus far in 2018 Wayne County had 244,821 adult recipients of the state’s food assistance program and 178,744 child recipients. Wayne County also had the highest average food assistance payment per person at $132. Macomb County had the second highest number of recipients in 2018, according to the data. In 2018 Macomb had 62,109 adult recipients and 39,179 child recipients. However, Macomb County did not have the second highest average food assistance payment per person. Rather, Oakland County had the second highest average payment at $124. Livingston County had the lowest total of both adult and child recipients (4,449 and 2,652 respectively) and the lowest average payment per person at $119. According to the Center on Budget and Policy Priorities, the average monthly Food Assistance Program payment to Michigan residents in fiscal year 2017 was $125; Wayne County was the only county in the region above this average. Average payments are based on how close to, or below, the poverty line an individual or family are. The higher poverty level of an individual or family means they will likely receive more funding for food assistance.

The maps below further demonstrate why Wayne County had the highest number of Food Assistance Program recipients. Despite the data below being from 2016 (the state did not have data at the municipal or Census tract level and the most recent data from the Census is from 2016), the first map below highlights how Detroit, Highland Park, Inkster, Ecorse and Lincoln Park all have more than 29 percent of the cities’ households receiving food assistance. Outside of the Wayne County, the only other communities with more than 29 percent of its households on the food assistance program were Pontiac in Oakland County and Port Huron in St. Clair County.

In 2016, 42 percent of residents were on the Food Assistance Program (also known as SNAP/Food Stamps) in Detroit, with the concentrations being along some of the City’s main corridors, including Gratiot and Grand River avenues. There were more than 30 Census tracts where between 58 and 83 percent of the families living there were on the state’s food assistance program; these Census tracts were spread throughout the City. On the other hand, there were only about a dozen Census tracts in the City where 22 percent of the families living there were on the food assistance program; these Census tracts were right along the Detroit River and on the City’s northwest side.

As the data in this post shows, the State’s food assistance program is used by thousands of families in the region. With the state’s new requirement that individuals on the food assistance program must work it will be interesting to see how and if the program numbers shift.

Drug Deaths Continue to Increase in Metro-Detroit

According to the most recent data from the Michigan Department of Health and Human Services, drug-induced death rates are higher throughout Southeastern Michigan than alcohol-induced death rates. In 2016, according to the data, St. Clair County had the highest drug-induced death rate at 46.4 per 100,000 residents; Wayne County had the second highest rate at 41.4 per 100,000 residents. Regionally, Washtenaw County had the lowest rate at 20.8 per 100,000 residents. According to a recent New York Times article that focuses on 2017 data from the Centers for Disease Control, Michigan experienced more than a 10 percent increase in overdose deaths between 2016 and 2017, much of which can be attributed to synthetic opioids. The article states that with increased funding for public health programs related to mental health and substance abuse policies there is “optimism” that overdose death rates will at least begin to stabilize in the future. According to the Michigan Department of Health and Human Services, Michigan’s drug-induced death rate was 9 in 2000, having only continued to increase to 27.5 per 100,000 residents in 2016. All counties in the Southeastern Michigan region had seen similar increases in that time period as well.

While Wayne County had one of the highest drug-induced mortality rates in Southeastern Michigan, it had one of the lowest alcohol-induced mortality rates at 7.9 per 100,000 residents in 2016. The only other two counties in the region with lower alcohol-induced mortality rates were Oakland (7.4) and Washtenaw (7.7). St. Clair County had the highest alcohol-induced mortality rate at 16.3 per 100,000 residents in 2016.

Although the media attention has not been as high on alcohol-induced deaths as drug-induced deaths, a recent University of Michigan study did show that deaths related to cirrhosis (a liver disease often related to alcohol consumption) increased 65 percent between 1999 and 2016; it also stated there was a 10.5 percent increase in cirrhosis related deaths for 25-34 year olds.

Lake Huron has Highest Number of Beach Advisories/Closures

On July 8, 2018 there were 23 beach closures throughout the State of Michigan, three of which were in the Southeastern Michigan region. These were Newburgh Lake in Wayne County, Fox Lake in Oakland County and the Lake St. Clair Metropark Beach in Macomb County. Thus far in 2018, the Lake St. Clair Metropark Beach has been closed for a total of 25 days due to high bacteria levels, according to the Michigan Department of Environmental Quality (MDEQ). The earliest closure for Lake St. Clair Metropark Beach began on May 31, 2018 and lasted for three days. The most recent closure was announced on June 21, 2018 and it remains closed. According to the MDEQ, advisories or closures are most commonly issued due to elevated counts of E. coli in water samples collected from the shoreline of a water body. Health departments use the daily and 30-day geometric mean to determine if a beach closure or advisory should be issued; for E. coli that average is 300 milliliters. E. coli contaminations often occur from storm water, sanitary sewer overflow and wildlife (such as excrement left from Canadian Geese). Below are three charts showing the number of beach advisories/closures (formally referred to as actions) taken between 2012-2017 on beaches monitored along Lake Erie, Lake Huron, Lake Michigan, Lake St. Clair and Lake Superior. It is important to note that not all beaches along the Great Lakes (and Lake St. Clair) are monitored. Local health departments and non-profits receive federal and state grant funding to monitor beaches. Monitoring must occur on beaches for which grant funding is provided for. The first chart below shows the percentage of monitored beaches across the state that had an advisory between 2013-2017. The highest percentage of actions occurred in 2015 at 25 percent; most recently the percentage of actions reported in 2017 was 18 percent. The 10-year average was 21.5 percent.

When looking at the sheer number of actions by lake, Lake Huron has regularly had the most number of advisory/closures since 2013, according to the Michigan Department of Environmental Quality. In 2017, 18 were reported, a decrease from the high of 29 in 2015.

The final chart below details the number of closures and advisories issued for Lake St. Clair Metropark, due to its regularity of closures compared to other monitored beaches in Southeastern Michigan. As noted earlier, Lake St. Clair Metropark often has a Canadian Geese problem, and it is regularly noted in media outlets that the excrement from these birds contribute to the high E. coli levels in the water samples. To deter the number of geese at the beach, the Metropark has enlisted the help of three dogs to chase away the geese.

As the St. Clair Beach Metropark takes steps to deter a contributor to its closures, the State also began using a rapid testing method to identify E. coli contamination faster. The method identifies and measures E. coli DNA and provides results on the same day it is collected; the more traditional method provides results up to three days later. Currently, according to the MDEQ, there are 12 labs in the state able to perform this method.

Majority of Medical Marijuana Shops Close Throughout Detroit

More than 200 medical marijuana caregiver centers have closed throughout the State of Michigan in the last several weeks, the majority of those being located in Detroit. According to data provided by the City of Detroit, as of March 23, 194 medical marijuana caregiver centers have closed in the City in 2018. Of these, 159 of medical marijuana caregiver centers closed between March 15 and March 29; these centers closed following cease and desist letters sent by the Michigan Department of Licensing and Regulatory Affairs (LARA) due to the fact they didn’t apply for licensing through the state. Centers had been allowed to stay open through an emergency rule that was issued in December stating, if the business had approval from the municipality it was located in and applied for the required LARA license. According to multiple media sources, the letters sent by LARA to the 200 plus medical marijuana caregiver centers stated if the centers did not close they would be at risk of not being able to obtain future licensing and/or face consequences from law enforcement.

Currently in Detroit there is a moratorium on new medical marijuana caregiver facilities opening; it went into affect on Feb. 13 and will last for at least six months. Despite the moratorium and closings there are still medical marijuana caregiver centers in Detroit. The first map below shows where all the medical marijuana caregiver centers in Detroit (368) are or were located, including those that have been closed in 2018, and those that are still operating and/or seeking licensing (57 still operating and/or seeking approval and 98 simply seeking approval). While the centers are spread out throughout the City, there were certainly areas with higher concentrations of the centers. For example, right along the northern border of Detroit, 8 Mile Road, there were about 55 medical marijuana caregiver centers. Gratiot Avenue is also heavily lined with medical marijuana caregivers. While majority of centers, both open and closed, are located north of Detroit’s downtown, there are a handful in Detroit’s inner core.

The second map shows the 194 medical marijuana centers that have been closed in 2018. As stated, that is 194 out of 368 in the City (the 368 includes those that are operating, those that are seeking approval and those that are closed). The centers that have closed in the City are not concentrated in specific neighborhood.

There are 13 medical caregiver facilities in the City (shown in the map below) that are operating the closest to compliance as possible, within the expectations of local and state laws, because they have received zoning approval from the City of Detroit and have applied for the emergency licensing described above. According to two initiatives passed on Nov. 7, 2017 in Detroit the Zoning Board of Appeals does not have the authority to review dispensary applications and allows these businesses within 500 feet of several organizations, including religious institutions and other dispensaries. The City has since challenged these initiatives, further confusing the legal operation of medical marijuana caregiver facilities in the City, and the zoning regulations related to them.

In addition to Michigan Medical Cannabis Commission medical marijuana caregiver facilities and those that have closed, there are also the ones that are in the approval process and ones that are in the approval process and still operating. The first map below shows that there are 57 medical marijuana caregiver facilities and/or currently operating in the City of Detroit. While the City of Detroit doesn’t detail what “and/or still operating means,” it is likely related to the facilities that applied for emergency licensing to remain open during the time their new licensing through the state was being reviewed. In addition to the 57 facilities that are seeking licensing and/or still operating, there are an additional 98 medical marijuana caregiver facilities (second map below) seeking approval from the City and the State that are not operating.

In traversing through this issue for this post, it is evident there is still plenty of work to be done at the local and state level to eliminate confusion and allow medical marijuana caregiver facilities to operate legitimately. Like Detroit, other local governments are also trying to navigate through state and local regulations. For example, in Ann Arbor new zoning regulations were approved by the City Council in February. Zoning for four dispensaries in Ann Arbor was then approved, while decisions on two others were delayed. Local officials there too are still learning how to adjust.

Monroe’s Water Lead Levels Highest in Southeastern Michigan

In 1991 the Lead and Copper Rule was implemented by U.S. Environmental Protection Agency as a means to help prevent exposure to lead and copper. According to the rule, if lead concentrations in drinking water exceed 15 parts per billion (ppb) in more than 10 percent of customer’s taps sampled, additional controls must be taken to prevent corrosion. According to a recent MLive article, which compiled Michigan Department of Environmental Quality lead testing data from water systems throughout the State of Michigan, the City of Monroe was the only public water system in Southeastern Michigan that had lead levels that reached the federal threshold. According to the data, which states testing ended on Dec. 31, 2016, the City of Monroe’s 90th percentile for lead was 15 ppb. For comparison, the data showed that between January and June of 2017 Flint’s 90th percentile for lead was 7 ppb.

In Southeastern Michigan, there were only three public water systems (for which data was available) with lead concentration levels above Flint’s. Those systems were located in:

  • Grosse Pointe Shores: 9 ppb
  • Capac: 7ppb
  • Marysville: 12 ppb

Conversely, there were 77 public water systems in Southeastern Michigan for which data was available, with zero lead tested in the water system.

While the data shows the lead levels are improving in Flint, this data also shows how the region’s, and the state’s, water systems need continuous monitoring and the infrastructure needs regular maintenance. According to a Brookings article (link), the federal government is only responsible for less than a quarter of the spending on all 51,000 plus public water systems in the country. This means, local and state governments must bare the brunt of the cost to ensure citizens have access to a clean, reliable water source. In Southeastern Michigan, a large portion of the region’s water system is overseen by the Great Lakes Water Authority. This government agency is regional authority that was created to ensure larger purchasing power is available for infrastructure improvements. This is one step the region has taken in recent years to ensure clean water remains available to the residents of Southeastern Michigan.

Food Least Accessible for Detroit in Southeastern Michigan

Throughout Southeastern Michigan the City of Detroit had the highest number of Census tracts with the lowest access to food sources, according to 2015 data from the U.S. Department of Agriculture (USDA). For the purpose of this post, low income is defined as Census tracts with a poverty rate of 20 percent of higher or with a median family income less than 80 percent of median family income for the state or metropolitan area. Areas with low access to food are identified as Census tracts having 33 percent of the population living within a certain mileage from a grocery store. In this post these areas are identified by either being a half-mile or mile from a grocery store in an urban area and 10 miles in a rural area (these differences are identified in each map below). According to the USDA, none of the counties and/or Census tracts in Southeastern Michigan are identified as rural, so the 10 mile rural identifier will not be used in this post.

Half-mile  Mile

When examining the Southeastern Michigan region for the number of Census tracts with low-income families and low access to food sources within a half-mile majority of the City of Detroit is highlighted in the map below, in addition to Hamtramck and Highland Park. There were also several Census tracts just outside the border of Detroit, in areas including Warren, Eastpointe, Dearborn, Hazel Park and Southfield, that had low incomes and low access to reliable food sources. While there were several Census tracts in every one of the seven counties in the Southeastern Michigan region, it was Wayne County that had the had the highest number of residents with low incomes and low access to grocery stores within a half-mile of residents’ homes.

A closer look at just the Census tracts in the City of Detroit show that there were only a select number of pockets in the City that were not considered low income and also had access to a grocery store closer than a half-mile. One such area that stands out is the downtown area. Other areas include the Denby, Cody Rouge and West Village neighborhoods.

In Washtenaw County, it was the Ann Arbor/Ypsilanti area that had the highest number of Census tracts with low-income families not having access to grocery stores and in Oakland County, beyond those Census tracts that border Detroit, it was the Pontiac that had the most number of low-income residents with low access to food options. In the less densely populated counties in the region (Monroe, St. Clair, Livingston) there was an average of about three Census tracts with a poverty rate of 20 percent of higher or with a median family income less than 80 percent of median family income and access to a grocery store more than a half-mile away.

One Mile

When the radius was expanded to one mile, the number of Census tracts without access to grocery stores dramatically decreased. The most notable decrease in the region was in the City of Detroit. In the maps below there are only about 20 Census tracts in the City of Detroit with a poverty rate of 20 percent of higher or with a median family income less than 80 percent of median family income and access to a grocery store more than a mile away. In the maps above, which depict access within a half-mile, nearly the entire City is highlighted for low income and low access. A notable difference due to access between a half-mile and mile can also be seen in the Ypsilanti/Ann Arbor area.

Throughout Livingston, Monroe and St. Clair counties there was a minimum decrease in the number of Census tracts with a poverty rate of 20 percent of higher or with a median family income less than 80 percent of median family income and access to a grocery store more than a half-mile away.

Low Income and Low Vehicle Access

The maps below identify low-income Census tracts where more than 100 housing units did not have a vehicle and were more than a half-mile from the nearest grocery store. When applying these variables we see there was an overall fewer number of Census tracts without access than when only looking at access, despite transportation accessibility. This was particularly true throughout Wayne County and in Census tracts just north of Wayne County. In Detroit, the highest concentration of Census tracts with more than 100 housing units not having a vehicle and that were more than a half-mile from the nearest grocery store were those on the west side of the City along Livernois Avenue.

In examining the data provided by the USDA, we see that regionally it was the City of Detroit, its inner-ring suburbs that had the highest number of low-income families with among the lowest access to food due to the location of grocery stores in 2015. To help support access to grocery stores, a robust public transportation network could be one solution, particularly in Detroit and its surrounding cities. Additionally, it is also important to understand the impact low incomes have on families when it comes to accessing healthy foods. While grocery stores may be within a half-mile or mile from a home, once an individual reaches a grocery store the chances of them purchasing fresh, non-processed foods may not be as high due to cost, and quite possibly access within the store. To support access to fresh foods in urban areas like the City of Detroit the Detroit Food Justice Task Force recommends policies that allow for more support of neighborhood famers markets and small businesses and research that identifies the food needs of neighborhoods throughout the City.

Maternal Deaths Highest in Detroit

A look into the pregnancy related death rates in Southeastern Michigan showed that the City of Detroit had higher rates from 2008-13 (combined) than any other governmental unit reported for the region. The Michigan Department of Health and Human Services says pregnancy related deaths are those when a woman dies while pregnant or within one year of pregnancy from any cause related to, or aggravated by, pregnancy or its management. According to MDHHS data, the pregnancy related death rate for Detroit was 44.4 per 100,000 babies from 2007-13 (44.4 total). Pregnancy associated deaths, by contrast are those that occur while a woman is pregnant or within a year of pregnancy irrespective of cause; these deaths can include suicide, drug overdoses or medical causes such as cancer. The rate for Detroit was 62.7 per 100,000 babies for pregnancy associated deaths (48 total) from 2007-13. When comparing pregnancy associated deaths and pregnancy related deaths, the data shows that there were overall higher rates for pregnancy associated deaths. This is likely because pregnancy associated deaths encompasses a broader range of causes of death.

As stated, the data provided by the Michigan Department of Health and Human Services shows that Detroit had the highest rate of pregnancy related death and pregnancy associated death rates in the region. For pregnancy related deaths, Wayne County had the lowest rate at 9.5 per 100,000 babies (9 total), for the counties where data were available. Wayne County’s rate excludes the deaths in the City of Detroit. In Southeastern Michigan pregnancy related rates for Livingston, Monroe, St. Clair and Washtenaw counties were not available because there were five or less deaths.

For pregnancy associated deaths Oakland County had the overall lowest rate at 28.6 (7 total). In Southeastern Michigan, pregnancy associated rates for Livingston, Monroe and Washtenaw counties were not available because there were five or less deaths.

According to an article from the Detroit News, high maternal death rates are related to chronic health conditions and high rates of poverty, both of which are common in Detroit.

The Michigan Department of Health and Human Services does not have data for 2014 and 2015 because it had not been reviewed by the State’s maternal death committees, as of early December, according to a representative from the department. In early 2017, Public Act 479 of 2016 was signed into law making maternal death reporting mandatory. Prior to this law reporting was voluntary.