Lead Poisoning in Detroit, 2016

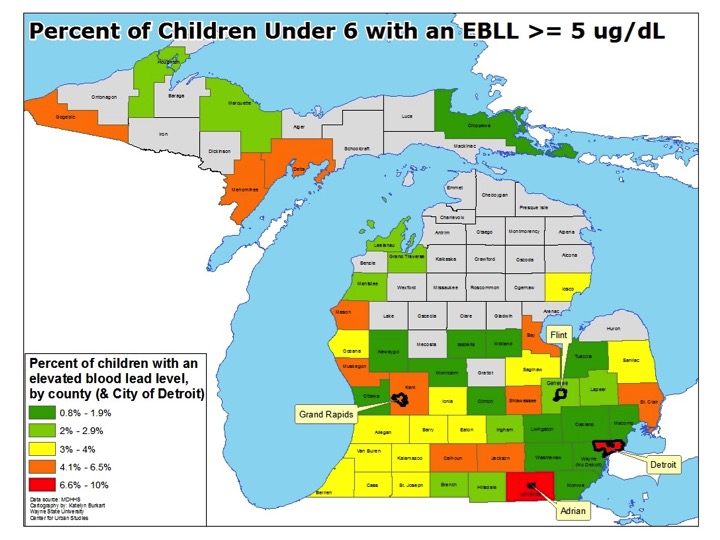
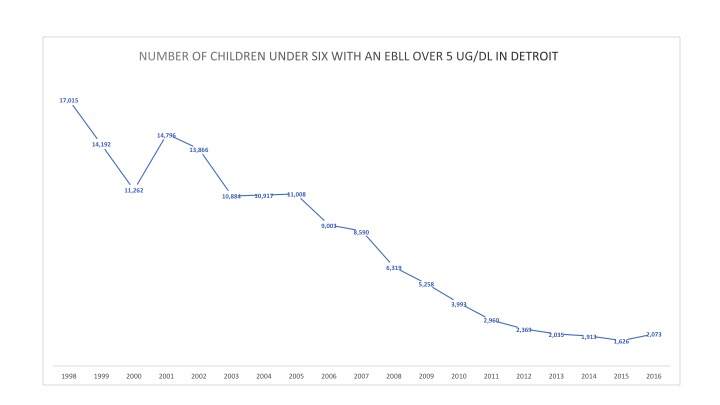
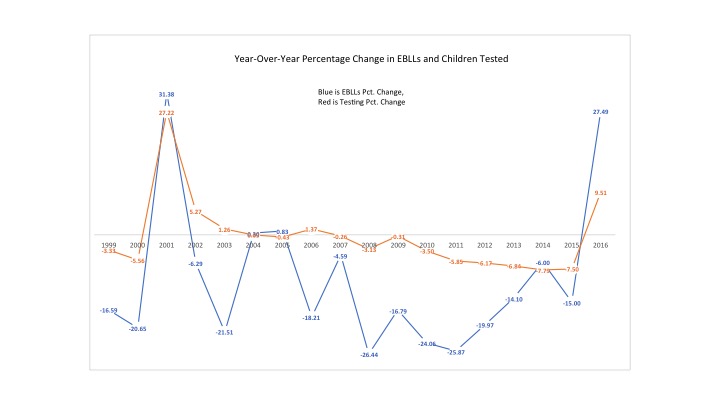
Lead poisoning has long been a serious problem for Detroit’s children, producing a lifetime of reduced cognitive capacity and many other consequences. In 1998, 17,015 Detroit children under 6 years old were lead poisoned at or above the 5 micrograms of lead per deciliter of blood (ug/dl) level. For over a decade lead poisoning has been declining yeay-by-year, but in 2016, the number rose by over 400 children to 2,073 (Figure 1). This was over 27 percent increase in one year (Figure 3).

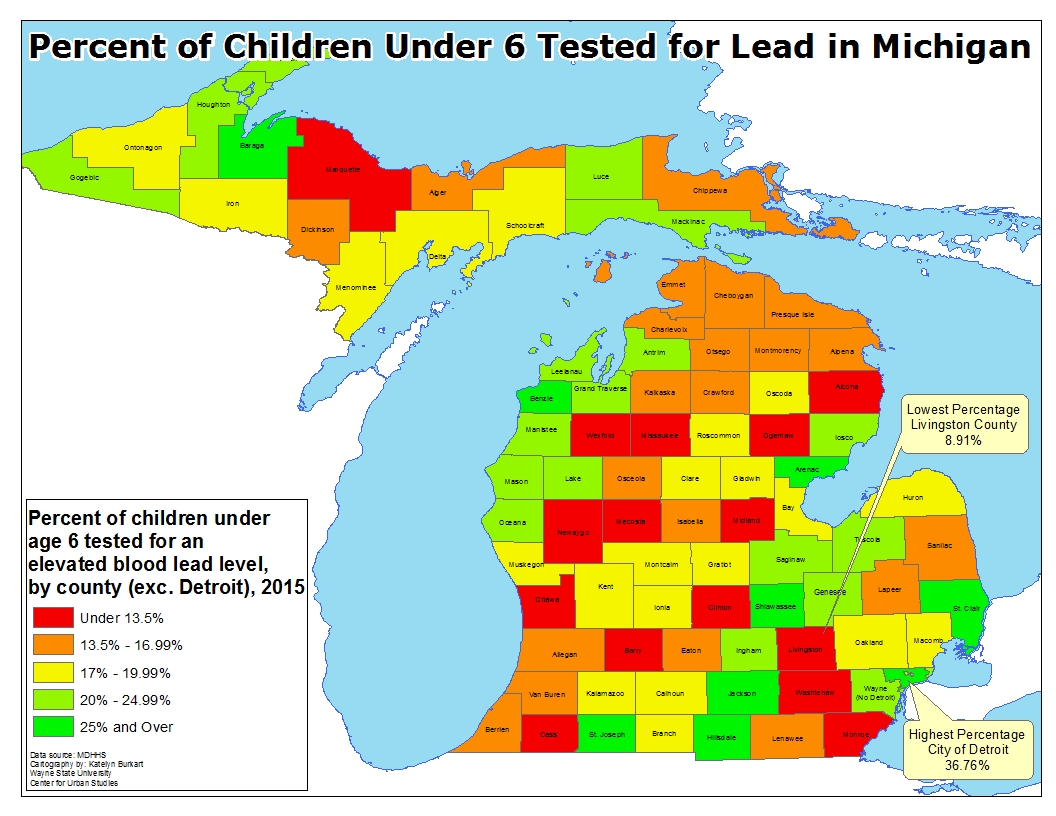
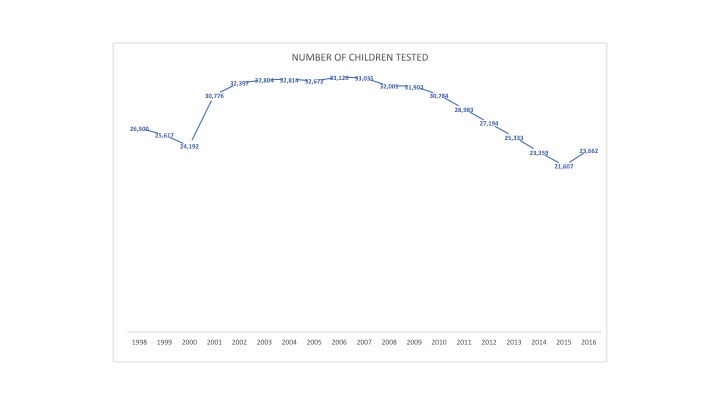
It is likely that the proximal cause of this rise was an increase in testing of children. As shown below (Figure 2), testing had been declining in Detroit in recent years through 2015. In 2016, testing of children shot up by 9.5 percent (Figure 3). Over 2,000 more children were tested during this time. This was for two clear reasons. First, the Flint crisis surrounding lead in drinking water triggered more parents to have their children tested. Second, the City of Detroit, emerging from bankruptcy, was rebuilding its Health Department, and that agency began to actively test for lead and to encourage others to do so as well.

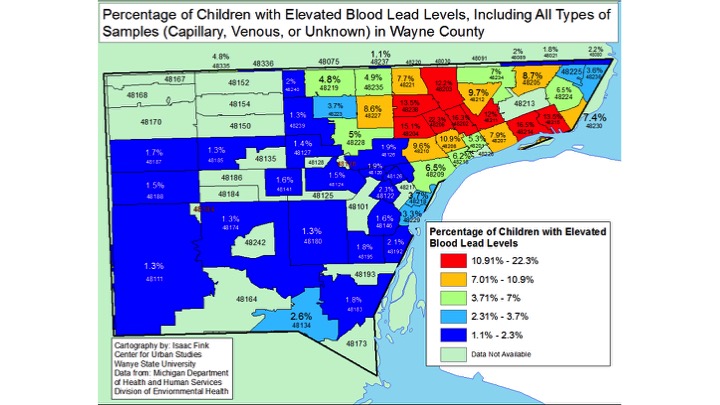
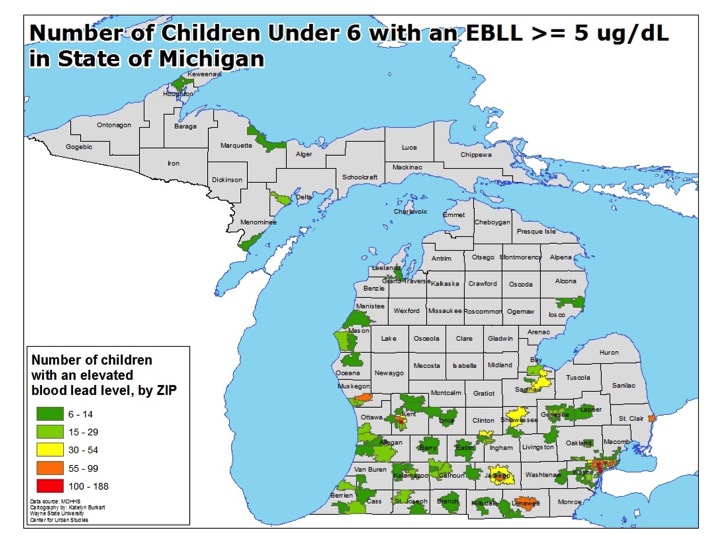
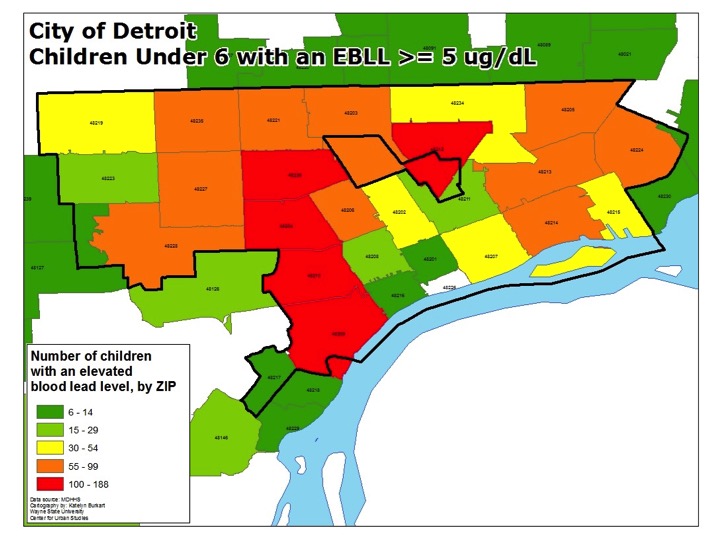
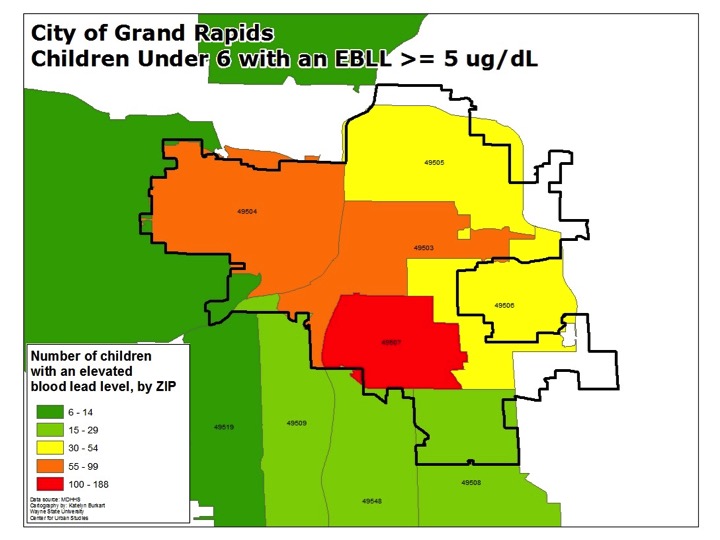
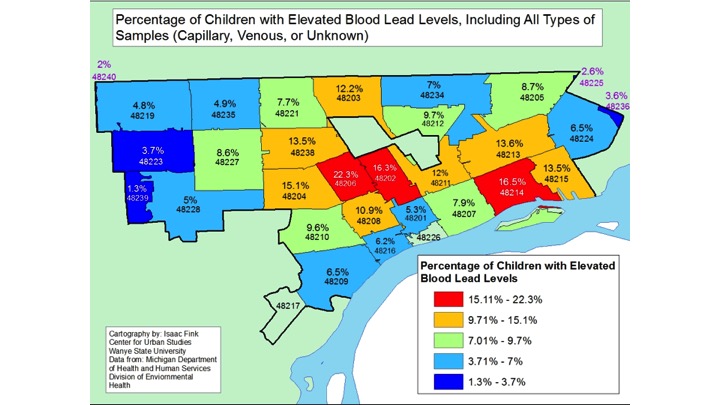
While, the percentage of children with lead poisoning has recently increased, the numbers are not evenly distributed across Detroit (Figure 4 below). Rather, children with lead poisoning are concentrated in zip codes where there are many older houses, mostly built well before the 1940s when lead paint was used frequently in homes. Second, these zip codes have low medium incomes (recall that poverty has increased in Detroit), and residents cannot afford to maintain their homes or landlords choose not to do so. Third, there are still many children in these zip codes.

So, many children are exposed to fraying homes where lead paint was heavily used historically. In one of these zip codes, 48214, preliminary data from a sample of over 500 homes indicates that as many as 87.9 percent of the homes assessed have some lead present on windows, walls, floors or porches. In this same zip code, tests show that about 17 percent of children have lead poisoning. The zip code with the highest percentage of children with lead poisoning is 48206 at 22.3 percent.

So, what can be done? Three important strategies are being executed by the City and others.

  • First, the Health Department attempts to case manage lead poisoned children, making sure that their home gets assessed and parents are trained to protect the child. Early intervention may reduce the long term effects of poisoning.
  • Second, where feasible, the homes of these children are referred for lead abatement, a procedure where lead hazards are removed from the home using public dollars, where the household cannot afford to pay. This can be very expensive, ranging from $5,000 to over $20,000. Still this costs a lot less than the lifetime cost of lead poisoning for a child.
  • Third, the City recently passed amendments to its property maintenance code that requires landlords to remove lead hazards from homes that they rent. In effect, this requires them to remove lead hazards. The City will be ramping this strategy up over the next few years, and this is expected to help the over 50 percent of Detroit residents who now rent.

Two more strategies are emerging as well:

  • First, ClearCorps and The Wayne State Center for Urban Studies are piloting an effort to identify homes with lead where children reside. Through this process an abatement of early lead hazards will take place, removing the hazard of a child being lead poisoned. The challenge for this approach is whether enough abatement funds and contractors to do the work can be made available for these homes.
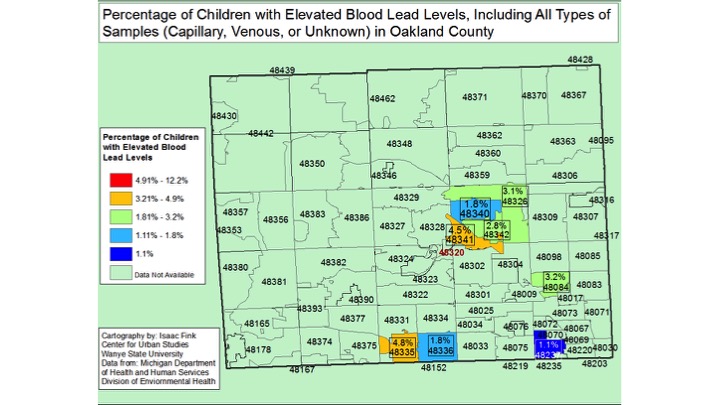
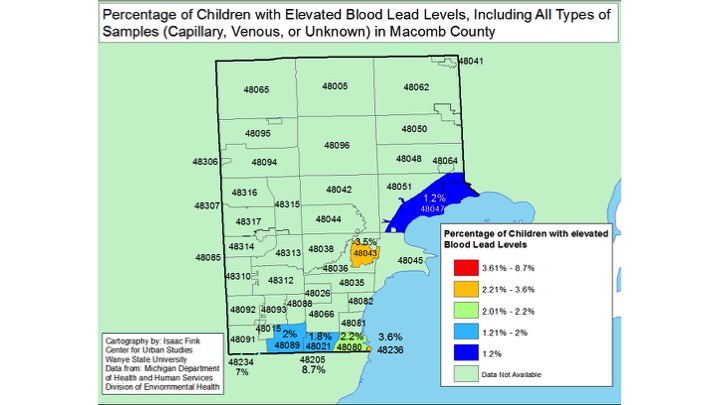
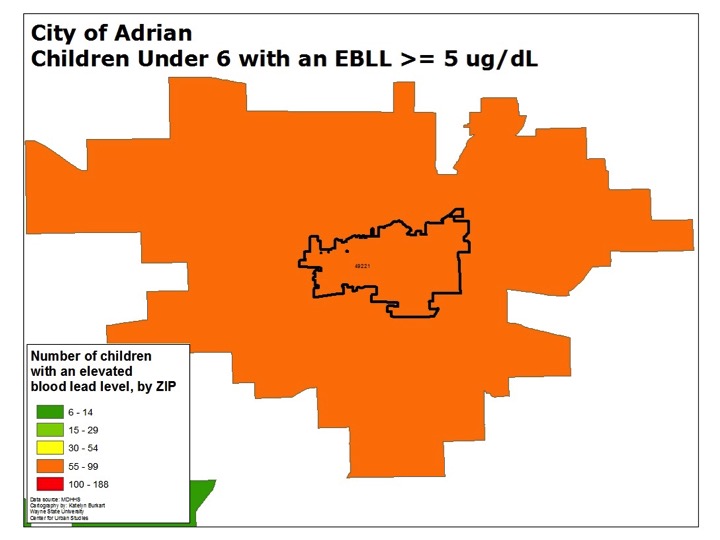
  • Second, another possibility is to help families, who might choose to do so, to relocate to areas where homes have little or no lead paint. As Figure 4 above shows, several of the northern and western zip codes of Detroit have relatively low levels of lead poisoning of children. Figure 5, below, shows the percentage of tested children identified as lead poisoned for all of Wayne County. Figure 6 shows Oakland County. Figure 7 shows Macomb County. Many of these zip codes have no reported lead poisoning cases, but some of the housing may be prohibitively expensive for current Detroit residents.

Southeastern Michigan Drug Death Rates On The Rise, Trend Similar to State and Nation-wide Problem

Between 2010 and 2015 Wayne County experienced the largest rate increase for drug-induced deaths in Southeastern Michigan, according to the Michigan Department of Community Health. In 2010 the rate for drug-induced deaths in Wayne County was 22.4 per 100,000 people and by 2015 that increased to 36.1 per 100,000 people. In Detroit, the drug-induced death rate increased by 9.4; in 2010 the rate was reported at 22.3 per 100,000 people and in 2015 it was reported to be 31.7 per 100,000 people.

Monroe County was the only other in the region to experience an increase above 10 per 100,000 between 2010 and 2015 was Monroe County. In 2010 the drug-induced death rate in Monroe County was 19.7 per 100,000 people, and by 2015 it had increased to 32.1 per 100,000 people, meaning there was a 12.4 rate increase.

In addition to showing rate changes between 2010 and 2015 we have also created maps that show the rate changes in five-year increments between 2000 and 2005 and 2005 and 2010. Between 2000 and 2005 Monroe County was the only county in the region to experience a rate increase above 10. In 2000 the drug-induced death rate in Monroe County was reported at 4.1 per 100,000 people and by 2005 increased to 17.1 per 100,000 people. Between 2005 and 2010 the rate increase for Monroe County was much smaller at 2.6, however the data shows drug-induced death rates in Monroe County and throughout the region have continued to increase since 2000.

Between 2000 and 2015 the overall drug-induced death rate increase for Monroe County was 28, and for Wayne County that rate increase was reported at 18.2. In 2000 the drug-induced death rate in Wayne County was reported to be 18.2 per 100,000 people, by 2005 it increased to 22 per 100,000 people. Between 2005 and 2010 there was a slight rate decrease of .3, but by 2015 the rate peaked at 36.1 per 100,000 people (the highest in the region).

Also between 2005 and 2010 in Detroit there was a drug-induced death rate decrease; this decrease was reported at 3.7 (in 2005 the rate was reported at 26 and in 2010 it was reported at 22.3). However, like the seven counties in the region, Detroit experienced drug-induced death rate increases between 2010 and 2015 of 9.4 per 100,000 residents, and overall since 2000 an increase of 9.1.

An overall increase in drug-induced death rates is not unique to Southeastern Michigan. According to the Michigan Department of Community Health, 2015 was the third straight year the State of Michigan experienced an increase in the drug-induced death rate. In 2015 the rate was reported at 22.3, compared to a rate of 20.5 in 2014, 18.3 in 2013 and 16.4 in 2012. Throughout the country, according to a recent Free Press article, there were 19 states (Michigan being one of them) that experienced an increase in drug-induced death rates. The U.S. Centers of Disease Control and Prevention reported that of the 52,404 drug overdose deaths in 2015, 63 percent of them were related to opioids. In Michigan, according to the Free Press article, about 45 percent of the drug related deaths in the state were related to opioids and about 20 percent involved heroin.

Drug Death Rates Increase Across Southeastern Michigan

Macomb County had the highest rate of drug related deaths in 2014 coming in at 30.9 per 100,000 people, according to the Michigan Department of Health and Human Services. Wayne County’s overall rate was 27.4 per 100,000 people. If one looks at Wayne County, excluding the City of Detroit, then out-Wayne had the highest rate of drug related deaths in Southeastern Michigan at 31.3. Detroit’s rate was 21, about equal with Oakland County at 20.8. Regionally, Washtenaw County had the lowest rate of drug deaths in 2014 at 18.5 per 100,000 people.

drugdeaths2

slide3

Livingston County experienced the highest percent change in drug related deaths at 253 percent. In 2005 Livingston County’s rate was 7.8 and by 2014 that number increased to 27.5. Although Washtenaw County had the lowest rate of drug related deaths in 2014, like the other counties in the region, it experienced an increase in drug deaths since 2005. The increase in drug related deaths, regionally and across the state, is partially because of the increased use in opioids and heroin. Just this month the Detroit Free Press reported 19 people in Wayne County died from an elephant tranquillizer-carfentanil-that was mixed with the heroin or other street drugs.


While drug related deaths for the counties increased regionally, the City of Detroit experienced a 19 percent decrease. In 2014 the City’s drug related death per 100,000 people rate was 21, which was higher than both Oakland and Macomb counties. In 2005 the rate for the City was 26.


According to the Michigan Department of Health and Human Services the increase in drug poisoning deaths began in 2012. For heroin alone, the rate of related deaths increased from 2.3 per 100,000 people in 2012 to 4.5 in 2014. Statewide, it was individuals between the ages of 25-34 who had the highest death rate involving heroin. According to the Michigan Department of Health and Human services in 2014 11.4 per 100,000 individuals died from a drug poisoning involving heroin and 12 per 100,000 individuals in the 35-44 age bracket died from a drug poisoning involving opioids-which include heroin and pain killers.

Hospital Bed Access Highest in Ann Arbor

Access to healthcare is necessary for disease prevention, a longer life expectancy and an overall increased quality of life. Both regionally, and nationally, those living in rural areas have far less accessibility to hospitals. Under the Medicare Rural Hospital Flexibility Program created by Congress in 1997 Critical Access Hospitals were created to strengthen health care access in rural areas. There are 36 Critical Access Hospitals in the state of Michigan, none of which are located in Southeastern Michigan. Critical Access Hospitals must be located in a rural area and be more than 35 miles from another hospital. Hospital bed access throughout Southeastern Michigan is concentrated in more heavily populated areas, leaving dozens of rural communities with limited access. The city of Ann Arbor has the highest overall hospital bed per capita (per 1,000 people) access, largely due to the University of Michigan Health System being located there.

All data for this post was provided by the Michigan Department of Health and Human Services. According to the department, the number of registered hospital beds can remain registered to a hospital even if it is closed. This is particularly true if the beds from the closed hospital are being transferred to a new hospital. This is the case for DMC Surgery Hospital in Oakland County; this hospital is closed but 25 of its beds are being transferred to the Children’s Hospital of Michigan (also located in Oakland County). The remaining 11 beds will be delicensed.

hospbeds (1)

In total, the University of Michigan Health System had 1,000 licensed beds in 2016, according to the Michigan Department of Health and Human Services. Regionally, this hospital has the second highest hospital bed count next to Beaumont Health Systems’ Royal Oak location, which has 1,040 licensed beds. Aside from the University of Michigan Health System located in Ann Arbor, there is also St. Joseph Mercy in Ann Arbor with 513 registered beds. Outside of Ann Arbor in Washtenaw County there were two other hospital facilities.


Despite Washtenaw County having the highest hospital bed access per capita in the region, Wayne County had the highest number of hospitals, 12 of which were located in the city of Detroit. In Wayne County, Henry Ford Hospital in Detroit had the most number of licensed beds at 877.

While hospital bed access is prevalent in the more densely populated areas, such as Ann Arbor, Detroit, and the tri-county metro region, it lacks in the rural areas. For example, in Monroe County there is only one hospital-Promedica Monroe Regional Hospital-with 217 registered beds. Per capita hospital bed access in Monroe County is 1.5 per 1,000 people, which is actually higher than Macomb County’s Per capita hospital bed rate (1.4 per 1,000 people). This difference though is not because of the total number of licensed beds in each county (there are 1236 in Macomb County) but the differing population numbers.

In Livingston County there was only one hospital-St. Joseph Mercy Livingston Hospital-with 136 licensed beds. This put the hospital bed access rate per 1,000 people for the county at .7, the lowest in the region, furthering highlighting the lack of hospital bed access in rural areas. Much of northern Macomb County and St. Clair County also had such lack of access.

Detroit has Highest Percentage of Kids Tested for Lead Poisoning

In 2015 about 37 percent of children under the age of 6 in the city of Detroit were tested for an elevated blood lead level, according to data provided by the Michigan Department of Health and Human Services. This was the highest percentage of children tested in the state; Livingston County had the lowest percentage of children under the age of 6 tested at 8.91 percent.

As shown in an earlier post, we also saw that in 2015 Detroit had the highest percentage of children under the age of 6 with blood lead levels elevated above 5 ug/dL at 7.5 percent, according to the Michigan Department of Health and Human Services. Similarly, Livingston County had among the lowest percentage of its child population under the age of 6 tested for elevated blood lead levels while also having less than 2 percent of its child population test positive for elevated blood lead levels.

According to the Michigan Department of Health and Human Services, all children enrolled in Medicaid are considered to be at risk for lead poisoning. Michigan Medicaid Policy requires all children between the ages of 12 and 24 months ages be tested for elevated blood lead levels at least once. Additionally, a child between the ages of 36 and 72 months must be tested for blood lead levels if they have not been tested before. The 2015 data available for the number of children (ages 0-18) on Medicaid was not available for this post. However, we do know a child in Michigan is automatically referred to the state’s Medicaid program if their family’s income is at or below 150 percent of the Federal Poverty Level.

It is particularly important children at risk of lead poisoning be tested because the substance is absorbed more into a child’s body than an adults. Additionally, a child’s brain and nervous system is more sensitive to the damaging effects of lead. Babies and young children can also be more highly exposed to lead because they often put their hands and other objects that can have lead from dust or soil on them into their mouths.

Michigan Lead Testing

Genesee County is where the city of Flint is located and in 2015 between 20 and 25 percent of Genesee County’s child population under the age of 6 was tested for elevated blood lead levels; more than 75 children under the age of 6 in just three zip codes within the city limits of Flint tested positive for elevated blood lead levels in 2015.

In response to the Flint Water Crisis, the State of Michigan has since “strongly recommended” that all children who live in the city, live in a home using Flint water or attend school or a childcare center in the city be tested for elevated blood lead levels. In addition, the state has required all children insured by Medicaid and/or enrolled in WIC be tested. These recommendations will certainly increase the percentage of children tested for elevated blood lead levels in Genesee County for the year of 2016.

Also, in a recent post we discussed how the city of Grand Rapids had one select zip code with 188 children under the age of 6 with elevated blood lead levels; in total there were no more than 523 children under the age of 6 in all of Grand Rapids with elevated blood lead levels. While the data on the percentage of children under the age of 6 tested for elevated blood lead levels in Grand Rapids in 2015 wasn’t readily available we do know that between 17 and 19.99 percent of children under the age of 6 in Kent County were tested for elevated blood lead levels.

The city of Adrian was another municipality discussed in a previous post because of the number of children with elevated blood lead levels. In 2015 there were 67 children under the age of 6 with elevated blood lead levels in Adrian, according to the Michigan Department of Health and Human Services. This number of children with elevated blood lead levels in Adrian contributed to the 10 percent of children under the age of 6 with elevated blood lead levels in Lenawee County. Subsequently, between 13.5 and 16.99 percent of children under the age of 6 were tested for elevated blood lead levels in 2015.

Although the areas mentioned above have been noted as having a high percentage of children under the age of 6 with elevated blood lead levels, none of the counties in which they are located in had more than 25 percent of children under the age of 6 tested for elevated blood lead levels. The counties in Michigan that did have more than 25 percent of its child population under the age of 6 tested for elevated blood lead levels were:

  • Jackson County
  • St. Clair County
  • Shiawasee County
  • Hillsdale County
  • St. Joseph County
  • Benzie County
  • Baraga County

The map above shows that elevated blood lead testing throughout the state of Michigan is inconsistent and 15 counties throughout the state had less than 13.5 percent of its child population under the age of 6 tested for elevated blood lead levels. We also know that children living in poverty have a higher risk of being poisoned by lead, but as the map shows, not all children under the age of 6 are being tested for lead poisoning, and of those not being tested there is certainly a portion of at risk children being excluded.


Lenawee County has highest percentage of children with elevated lead levels

The data discussed in this post is preliminary data on the lead poisoning of Michigan’s children in 2015 and was supplied by Michigan Department of Health and Human Services (MDHHS) at the county and zip code level, as well as data for the city of Detroit. At the county level, MDHHS also provided an approximate percentage of children who had blood lead levels at 5 ug/dL (micrograms per deciliter of blood) and above. Population data was only available by Zip Code Tabulation Area (ZCTA) (which are somewhat inconsistent with zip codes), preventing the calculation of percentage of children affected for the zip code data.

At 10 percent, Lenawee County had the highest percentage of its population under 6, county-wide, with an elevated blood lead level at 5 ug/dL, according to preliminary 2015 data supplied by MDHHS. The city of Adrian is located in rural Lenawee County and within the boundary zip code of 49221. There were 67 children under the age of 6 with elevated blood lead levels greater than or equal to 5 ug/dL in that zip code, according to data supplied by MDHHS.

The city of Detroit had 7.5 percent of its population of children under the age of 6 with elevated blood lead levels greater than or equal to 5 ug/dL . However, Wayne County (excluding Detroit) had less than 2 percent of its population of children under the age of 6 with elevated blood lead levels greater than or equal to 5 ug/dL. All seven counties in Southeastern Michigan had less than 2 percent of its population of children under the age of 6 with elevated blood lead levels. At the more local level though, the second map below shows that zip codes in the Port Huron area had between 55-99 children under the age of 6 with blood lead levels greater than or equal to 5 ug/dL. Portions of southern Oakland and Macomb counties, along with Ann Arbor/Ypsilanti area in Washtenaw County, had zip codes with no more than 14 children under the age of 6 with blood lead levels greater than or equal to 5 ug/dL. In Oakland County, the areas around Pontiac and Southfield, along with the area around the Detroit-Metro Airport in Wayne County had slightly higher numbers of children under the age of 6 with blood lead levels greater than or equal to 5 ug/dL; these numbers maxed out at 29, per zip code.

According to the Centers for Disease Control, 5 ug/dL is used a reference level by experts “to identify children with blood lead levels that are much higher than most children’s levels.” The CDC has recommended that public health actions be initiated in children under age 6 with blood lead levels above 5 µg/dL. Babies and young children can be more highly exposed to lead because they often put their hands and other objects that can have lead from dust or soil on them into their mouths.

Michigan Lead Data_County

Michigan Lead Data_Zip

When viewing the elevated blood lead levels in Lenawee County overall and at the more local level of zip codes, we see that the number of children under the age of 6 with elevated blood lead levels in Adrian contributed to the county as a whole having among the highest percentage of elevated lead levels. In 2015, according to MDHHS data, the zip code containing the city of Adrian had 67 children under the age of 6 with elevated blood lead levels.

Aside from Adrian, Detroit and the Port Huron area, the central portions of Muskegon County and Grand Rapids had substantial numbers of children with elevated blood lead levels in certain zip codes.

Adrian Lead Data

There were five zip codes in the city of Detroit in 2015 with more than 100 children under the age of 6 with elevated blood lead levels greater than or equal to 5 ug/dL. These zip codes were: 48238, 48204, 48210, 48209 and 48212. Four of these zip codes are aligned in a row on the west side of Detroit, including parts of neighborhoods such as Southwest Detroit. In total, 1,618 children under the age of 6 were reported to have elevated blood lead levels in Detroit in 2015.

Detroit Lead Data

In the southwestern portion of Grand Rapids the zip code of 49507 had 188 children under the age of 6 with elevated blood lead levels greater than or equal to 5 ug/dL. In total, the city had no more than 523 children under the age of 6 with elevated blood lead levels. The only other city with areas with numbers as high or greater was the city of Detroit, according to data supplied by MDHHS.

Grand Rapids Lead

The city of Flint is important when discussing elevated blood lead levels across the state of Michigan. Due to the water crisis that has been plaguing the city, children’s lead levels have gained national attention. The effect on children of lead in Flint’s water is unlikely to be correctly indicated by the 2015 numbers from MDHHS, first, because many children had not been tested, and second, because lead may not be found in their blood a certain amount of time after they quit drinking water containing lead. This is not to say the lead did not impact the children, but it may have been excreted or taken up into organs or bones. Many thousands of children may have been exposed to lead from the water, though the exact number is still unknown.

The 2015 data supplied by MDHHS shows that the highest number of children poisoned in Flint were in zip code 48503, which had 36 children under 6 with lead levels greater than or equal to 5 ug/dL. Portions of the zip codes of 48504, 48505, 48506 and 48507 are also within Flint’s city limits; these zip codes had 28, 15, 18, and 13 cases in 2015, respectively.

Flint Lead

While elevated blood lead levels in children in the city of Flint are being linked to lead found in the drinking water, as caused by the erosion of the city’s pipes, most lead poisoning in Michigan is related to lead in paint. In 1978, the federal government banned consumer uses of lead-containing paint, but some states banned it even earlier. Lead from paint, including lead-contaminated dust, is one of the most common causes of lead poisoning, and is almost exclusively the source of lead poisoning in the Detroit area, as discussed in a previous Drawing Detroit post.

Lead paint often deteriorates as housing ages, shedding dust and flakes, which becomes available to children to ingest. So the age of housing is a proxy for the risk of lead poisoning. The first map below shows that there are more than 50 counties across the state where 60 percent or more of the housing stock-either owner or renter occupied-was built prior to 1980. About 93 percent of all houses in Detroit and Flint were built before 1980, according to Census data. For the city of Grand Rapids 81.2 percent of the housing stock was built prior to 1980, and for the city of Adrian that percentage is 74.9. The second map below shows the percentage of renter-occupied housing units by county. It will require further examination for a conclusion about the statewide data, but certainly in Detroit lead poisoning tends to be higher in renter-occupied housing. This fact offers an opportunity in that it would be possible to use more assertive code enforcement to require landlords to abate lead paint hazards that are so pervasive in Michigan’s older housing. Several communities in Michigan have tested this approach, which has been very effective in other major cities.

Owner 1980

Renter 1980

Detroit Teen Pregnancy Rate Decreasing, Remains Above the Region’s and State’s

In 2014 in the seven county Southeastern Michigan region Wayne County had the highest teen pregnancy rate at 57.4 per 1,000 female residents between the ages of 15 and 19. This rate is largely reflective of the 84.8 teen pregnancy rate that Detroit had that year; without including Detroit into the calculation Wayne County had a teen pregnancy rate of 37.1 in 2014. And, while Wayne County had the highest teen pregnancy rate in the region in 2014 that rate was the lowest it had been since 1989. This trend of declining teen birth rates not only occurred in Wayne County, but throughout the seven county region, and in the city of Detroit.

According to the Michigan Department of Health and Human Services, the teen pregnancy rates discussed in this post were calculated by taking the estimated number of pregnancies, dividing that number by the female population of 15-19 year olds in each respective county and then multiplying that number by 1,000. Pregnancy numbers are a sum of estimated live birth, miscarriages and abortions. Information to calculate these numbers were provided to the Michigan Department of Health and Human Services through the Michigan Resident Live Birth Files, the Files of Induced Abortions Occurring in Michigan and the Michigan Division for Vital Records and Health Statistics.

Michigan Teen Pregnancy

In 2014 the Michigan Department of Health and Human Services reported there were an estimated 2,101 pregnancies amongst the 24,762 teens between the ages of 15-19 in the city of Detroit. As mentioned earlier, by excluding Detroit teen pregnancies from Wayne County the numbers significantly drop. This exclusion left Wayne County with a teen pregnancy rate of 37.1 in 2014, which is lower than St. Clair County’s pregnancy rate of 37.7 in 2014. St. Clair County’s pregnancy rate in 2014 is representative of a teen population of 5,011 females between the ages of 15-19, in which there were a reported 189 pregnancies. Only St. Clair and Wayne counties, along with the city of Detroit, had teen pregnancy rates above the state’s rate of 34.8 in the region. In Michigan in 2014 there were 330,141 females between the ages of 15-19; amongst this population there was an estimated 11,474 pregnancies. This produces a rate of 34.8

Washtenaw County had the lowest teen pregnancy rate in the region in 2014 at 14.2; this is representative of 213 estimated pregnancies amongst 15,510 females between the ages of 15-19.

Michigan Teen Pregnancy Historic

Overall teen birth rates in Southeastern Michigan have been declining; this is also a national trend. Wayne County, including the teen birth rate for the city of Detroit, consistently had the highest rate in the region. As for the lowest rate, it changed from Livingston County in 2005 to Washtenaw County in 2014. Additionally, while Wayne County had the highest teen birth rate in the region, it has also had the largest decrease of the seven counties. In 2005 the Wayne County teen birth rate was recorded at 76.5 and in 2014 that dropped to 57.4, a 19.1 decrease. In 2005 Washtenaw County’s teen birth rate was 28.2 (just above Livingston County’s rate at 24.9) and by 2014 it decreased to 14.2, making it the lowest teen birth rate in the region in 2014.

When not reviewing the teen birth rates solely at the county level we see that Detroit’s teen birth rates decreased from 107.8 to 84.8 between 2005 and 2014. This decrease was 23.8 points. While there was a decrease, Detroit’s pregnancy rates consistently remained above those in the seven county region. According to Michigan Planned Parenthood Communications Manager Julie McKeiver, both teen pregnancy, and abortion rates, tend to be higher in large cities and rural areas that have low income and low minority populations. This occurs because of the lack of access to health care and related services, she said. To help combat such high rates, Planned Parenthood of Michigan offers a Peer Education program in Detroit, which aims to educate teens on their sexual health. This education, according to McKeiver, is meant to empower the teens in the program, who will then share what they learned with their peers. This program is funded by the State of Michigan’s Taking Pride in Prevention Program (TPIPP). The TPIPP is statewide initiative that also aims to reduce pregnancy. The TPIPP not only funds the Detroit Peer Education Program but also the Safer Choices teen pregnancy curricula that Planned Parenthood implements in Detroit schools and community-based organizations, McKeiver said. This curricula touches on subjects such as delaying the initiation of sex and increasing the use of protection, according to the website.

Although programs are in place in Detroit that aim to decrease the pregnancy rate through education the question remains on how much impact those have versus the impact the lack of health care access that low income communities face.

Michigan Abortion Rates

In addition to teen pregnancy rates, the Michigan Department of Health and Human Services also tracks teen abortion rates. The city of Detroit had the highest rate at 26.3; there was a reported 652 abortions for the teen female population of 24,763 in 2014. When excluding Detroit, Wayne County had a teen abortion rate of 13; when including Detroit, Wayne County had a teen abortion rate of 18.7. The county with the next highest abortion rate was Macomb at 10.1; there were a reported 264 abortions for the 26,060 females between 15 to 19 in the county. The county with the lowest abortion rate was Monroe at 3.7. Michigan had a teen abortion rate of 8.6 in 2014 and the only other county in the region above that rate was Oakland County with a teen abortion rate of 8.8 ( 340 reported abortions for a population of 38,676).

The ability to view the abortion rates by county over a length of time was not made available by the Michigan Department of Health and Human Services. DrawingDetroit will continue pursuing these data.

Sexually Transmitted Infections (STI) in Southeastern Michigan: Chlamydia rate decreasing in Wayne County, but nearly double Michigan’s rate

In examining three major Sexually Transmitted Infections (STI) we find Chlamydia experienced rate increases in five of the seven counties in Southeastern Michigan between 2004 and 2014, according to the Michigan Department of Community Health. Oakland and Wayne counties were the only two that didn’t experience rate increases for this sexually transmitted infection (STI). These two counties were inline with the state trend; Michigan experienced a chlamydia rate decrease between 2004 and 2014, from 484.3 per 100,000 people to 452.5. According to the Centers for Disease Control, the increase in chlamydia rates was a national trend, as it increased about three percent from 2013 to 2014.


Chlamydia and gonorrhea were most commonly diagnosed in 15-24 year-olds throughout the country, according to the Centers for Disease Control. This is an ongoing national trend that a Centers for Disease Control Doctor Gayle Bolan said is occurring, in part, because of sexual relationships beginning at an early age, according to NBC News. Overall STI rates are increasing nationally because budget cuts to STI programs, changed behavior of gay and bi-sexual men and better reporting mechanisms, Bolan said. She said chlamydia is the most affected by better reporting mechanisms, as it has always been amongst the most common STI, while syphilis rates seem to be increasing because of the changed behavior of gay and bi-sexual men.

Also, officials from Rhode Island to Kent and Wood counties on Michigan’s west side are attributing their STI rate increases to “hook-up” apps like Tinder because of the increased opportunities they allow for casual sex.


In Michigan as a whole, not only are chlamydia rates decreasing, but so are gonorrhea rates; conversely, syphilis cases are increasing. This trend is similar with regional trends.


Chlamydia was the only sexually transmitted infection for which data were recorded for all seven counties at three time periods (2004-2008 average; 2009-2013 average and 2014). The sexually transmitted infection of syphilis has counties lacking data for all three time periods. Data on gonorrhea for all seven counties is available only for the 2004-2008 and 2009-2013 time periods. It is unclear if missing data is due to data suppression or low numbers.

All rates are per 100,000 residents.

Detroit Chlamydia Rates 2008

Detroit Chlamydia rates 2013

Detroit Chlamydia Rates 2014

St. Clair County experienced the largest chlamydia rate increase of all seven counties from a 2004-2008 average rate of 275.7 per 100,000 per residents to a 2014 rate of 402.4,. In 2014, though, it was Wayne County that had the highest overall Chlamydia rate per 100,000 residents at 811.1, a rate nearly 400 points higher than the states. The 2014 rate of 811.1 decreased from 1076.5 for the 2009-2013 average and from 1007.3 for the 2004-2008 average rate.

As noted earlier, Wayne and Oakland counties were the only two in the region to experience a rate decrease for chlamydia between 2004 and 2014. Oakland County’s average chlamydia rate for 2004-2008 was 300.5, and the 2014 rate was 280.7. Between the 2009-2013 average and 2014 Oakland County also experienced a rate decrease, from 297.6 to 280.7.

The state’s chlamydia rate for 2014 was 452.5, a decrease from 484.3 per 100,000 people for the 2004-2008 average and a decrease from 490.7 per 100,000 people for the 2009-2013 average.

Detroit Gonnorhea rates 2008

Detroit Gonnorhea rates 2013

Detroit Gonnorhea rates 2014

Between 2004 and 2014, of the counties with available data, Wayne County experienced the largest gonorrhea rate decrease from 376.6 for the 2004-2008 rate average to 231.4 for the 2014 rate per 100,000 people. Even so Wayne County had the second highest gonorrhea rate in the state in 2014 (Kent County had the highest rate at 255), according to the Michigan Department of Community Health, but the highest percent distribution of gonorrhea cases in the state came from Wayne County, with 42.4 percent of cases coming from there. The rate decreases for the other three counties with information available-Macomb, Washtenaw and Oakland-ranged between 9 and 15 points between 2004 and 2014. Washtenaw County’s 2014 gonorrhea rate was 72.9, decreasing from the 88.5 average from 2004-2008. Macomb County’s rate of 55.8 per 100,000 in 2014 was a decrease from the 64.7 average rate of 2004-2008. Oakland County’s 2014 rate of 49.6 per 100,000 was a decrease from the 78.7 average rate of 2004-2008.

St. Clair, Livingston and Monroe counties were missing rate data on gonorrhea for 2014. Between the 2004-2008 and 2009-2013 averages St. Clair and Monroe counties both experienced rate increases per 100,00 people and Livingston County experienced a rate decrease. For the 2004-2008 rate averages St. Clair County’s rate was 45, Monroe’s was 41.8 and Livingston County’s was 10.7. The 2009-2013 rate for St. Clair County was 46.6, Monroe 42.2 and Livingston County was 10.5.


Slide11 Slide12


Detroit Syphillis Rates 2014

For syphilis data, Wayne, Oakland and Macomb Counties were the only three with consistent data between 2004 and 2014. According to the Michigan Department of Community Health, Wayne County had the highest rate of the three counties in 2014 at 32.4 per 100,000 people; this was an increase from 21.9 for the 2009-2013 average and an increase from 20.5 from the 2004-2008 average. Macomb County’s syphilis rate per 100,000 people in 2014 was 9 and Oakland County’s rate was 12.1. These two counties also experienced rate increases from the 2004-2008 average and the 2009-2013 average. For the 2004-2008 average, Macomb County’s rate was 5.6 and Oakland County’s rate was 7.6. For the 2009-2013 average, Macomb County’s rate was 7.5 and Oakland County’s rate was 7.8.

Washtenaw County had data recorded for the 2004-2008 average and the 2009-2013 average. This information that Washtenaw County’s rate between those two time periods experienced a miniscule rate increase, from 7.8 for the 2004-2008 average to 7.9 for the 2009-2013 average.


In 2014, Michigan’s syphilis rate was 11.3, an increase from both the 2004-2008 average (7.5) and the 2009-2013 average (7.6). The 2014 rate is nearly a third of Wayne County’s 2014 syphilis rate.

Cancer incidence rates declining across Southeastern Michigan

Overall cancer rates declined across all counties in Southeastern Michigan in the last decade. Cancer rates also declined for nearly all major categories—breast, colon/rectal, lung/bronchial and prostrate—in most counties. The category “all other sites” of cancer, however, increased between the 1998-2002 period and the 2008-2012 period for four of seven counties. These counties were Livingston, Macomb, Washtenaw and Wayne.

Slide03

Slide21

For the total average cancer incidence rates per 100,000 people Monroe County had the largest decrease at nearly 100 between 1998 and 2012; the 1998-2002 average was 478.6 and the 2008-2012 average was 378.8. Oakland and St. Clair counties had similar rate decreases (73.8 and 84.1, respectively) between that time. For the 1998-2002 average Oakland County’s overall cancer incidence rate was 565.9, and St. Clair County’s rate for this time was 581. For the 2008-2012 averages, Oakland County posted a rate of 492.1 and St. Clair County posted a rate of 496.9.

From 477.6 to 471.9, Washtenaw County had the lowest decrease at 5.7. It was Livingston County that had the lowest average rate for 2008-2012 at 441.1 per 100,000 people; Livingston County’s average rate for 1998-2002 was 451.5.

For Wayne County, the average cancer incidence rate per 100,000 people was 568.2 for 1998-2002 and 525.5 for the 2008-2012 average.

Slide05

Slide06

Livingston, St. Clair and Oakland counties all experienced a decrease in their average breast cancer rates between 1998 and 2012. From 1998-2002 Oakland and St. Clair counties had the highest breast cancer rates with Oakland County reporting a breast cancer rate of 84.6, and St. Clair County a rate of 83.7. St. Clair County had the largest decrease from the 1998-2002 to 2008-2012 average; the rate dropped 20.4 points, from 83.7 to 63.3.

Washtenaw County only experienced a 2 point decrease across those two time periods; it had the highest average rate for the 2008-2012 time period of 73.1.

Slide08

Slide09

Average colon and rectum cancer incidence rates throughout the seven county region decreased between 1998 and 2012, with Monroe County posting the largest rate decrease. For the 1998-2002 average rate per 100,000 people Monroe County’s average incidence rate was 60.2, and for the 2008-2012 average the rate per 100,000 people was 35.8; the overall decrease was 24.4. For the 2008-2012 period St. Clair County had the highest average rate per 100,000 people at 51.6, though it had experienced a very substantial reduction from 74.2 in the 1998-2002 period.

Slide11

Slide12

Lung and bronchus average cancer incidence rates in all seven counties decreased between 1998 and 2012, with St. Clair County experiencing the largest decrease at 17.3, from 90.1 to 72.8. Wayne County had the highest rate at 82.9 for 2008-2012, compared to 90.1 for 1998-2002.

Slide14

Slide15

Monroe County had the largest average prostate cancer incidence rate decrease per 100,000 between 1998 and 2012 of 36.1; the 1998-2002 rate was 76.7 and the 2008-2012 rate was 40.6. Oakland County also experienced a large rate decrease from the 1998-2002 average to the 2008-2012 average; the Oakland County rates went from 104.7 to 79.4. Despite the 25.3 average rate decrease Oakland County’s average prostate rate remained the highest in the region for 2008-2012 at 79.4.

Slide17

Slide18

When looking at all other average cancer incidence rates for the region four of the seven counties experienced rate increases per 100,000 people. Those four counties were Livingston, Macomb, Washtenaw and Wayne counties. Washtenaw County had the largest average rate increase at 15.1 per 100,000 between 1998 and 2012, from 216.4 to 231.5. Monroe County had the largest average incidence rate decrease between 1998 and 2012 at 22. Monroe County’s 2008-2012 average rate was 185.4, the lowest rate in the region, and its 1998-2002 rate was 207.4. Overall, Macomb County had the highest average incidence rate for 2008 to 2012 at 246.4; its 1998-2002 rate was 241.7.

Macomb County sees largest rate increases for drug-, alcohol-induced deaths

As with other regions Southeastern Michigan has rising drug-related death rates, which the Centers for Disease Control (CDC), have attributed to increased use and abuse of opioids. According to the CDC, opioid overdose death is an epidemic that can be found within even the quietest communities. In 2013, on the national scale, drug overdoses were the leading causes of injury death and 51 percent of those deaths were related to prescription drugs. While data at the county level on opioid specific deaths was unavailable, below are maps showing how drug-induced death rates have increased in every Southeastern Michigan county (where data is available) between 2003 and 2013. In addition to an increase in drug-induced death rates since 2003 there has also been an increase in alcohol-induced death rates and “all other causes” of death.

All of the information presented in this presented was obtained from the CDC. According to the CDC, data is unreliable if the number of deaths for a specific cause is too small to create an accurate rate. Additionally, some counties have suppressed rates, meaning the information obtained is below the determined “cut-off” value and the conditions for suppression are met, according to the CDC. Rates are per 100,000 residents.

Metro-Detroit Drug-induced Deaths 2003

Metro-Detroit Drug Induced Deaths 2013

Macomb County had the highest increase in drug-induced death rates between 2003 and 2013, with the rate climbing 16.2 per 100,000. In 2013 Macomb County had the second highest drug-induced death rate though at 29.2; Monroe County had the highest rate at 30.6. It was Washtenaw County that had the lowest drug-induced death rate in 2013 at 16.1; in 2003 the Washtenaw’s drug-induced death rate was 8.9.

In 2003 Monroe and St. Clair counties had too few drug-induced deaths (18 and 12, respectively) for reliable rates to be created. However, with such low drug-induced death numbers in 2003 for those two counties we can infer that Monroe and St. Clair counties also experienced an increase in their rates between 2003 and 2013, especially since the CDC was able to determine rates for 2013.

According to the CDC, those between the ages of 25 and 54 have the highest rate of opioid overdose deaths. While rates for drug-induced deaths at these age levels were not explicitly available, the data does show that Macomb County had 157 drug-induced deaths for residents between the ages of 25 and 54 in 2013. Monroe County had at least 20 such deaths, however numbers were not available for the 35-44 age group because the numbers were too small to report.

Metro-Detroit Alcohol Induced Deaths 2003

Metro-Detroit Alcohol Induced Deaths 2013

While there were fewer alcohol-induced deaths than drug-induced deaths in both 2003 and 2013 in each county with available data, there was still across-the-board increases between those dates. Of those documented rate increases, Macomb County again had the largest increase between 2003 and 2013 at 3.2. In 2013 Macomb County also had the highest alcohol-induced death rate of the counties in the region; this rate was 10.8.

Livingston, St. Clair and Washtenaw counties had to few of deaths for accurate rates to be presented.

Metro-Detroit Deaths 2003

Metro-Detroit Deaths 2013

As expected, the death rates for all other death throughout the region were much higher than either and both drug- and alcohol-induced death rates. One trend to note is that “other causes” death rates also increased between 2003 and 2013. St. Clair County had the largest increase at 184.9; its death rate in 2003 was 870.8 and in 2013 it was 1055.7. In 2013 St. Clair County had the highest rate and Washtenaw County had the lowest.

Just a few weeks ago we drilled down on how the death rate for white, middle aged population is increasing, largely in part to suicide and substance abuse. While numbers were unavailable for alcohol- and drug-induced death rates at the county levels for age groups, this post does highlight how deaths related to alcohol and drugs have been increasing over the last 10 years.