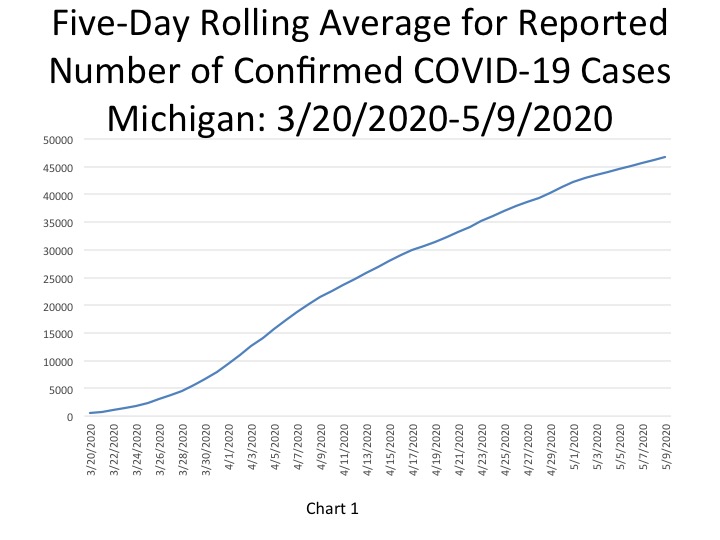
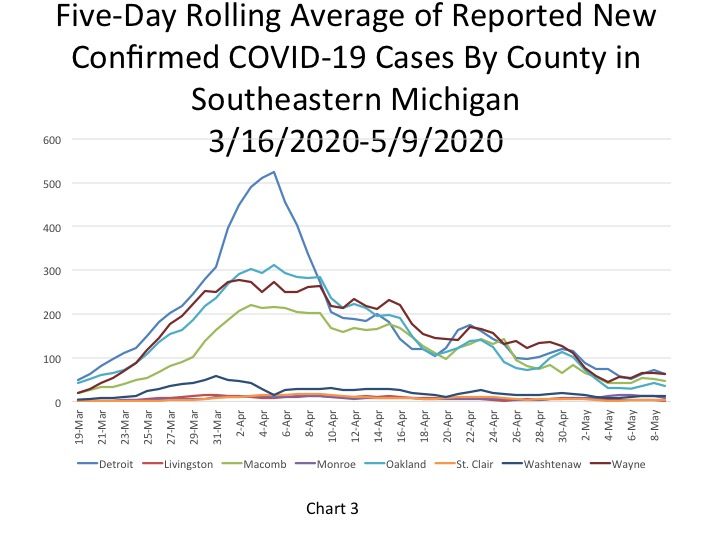
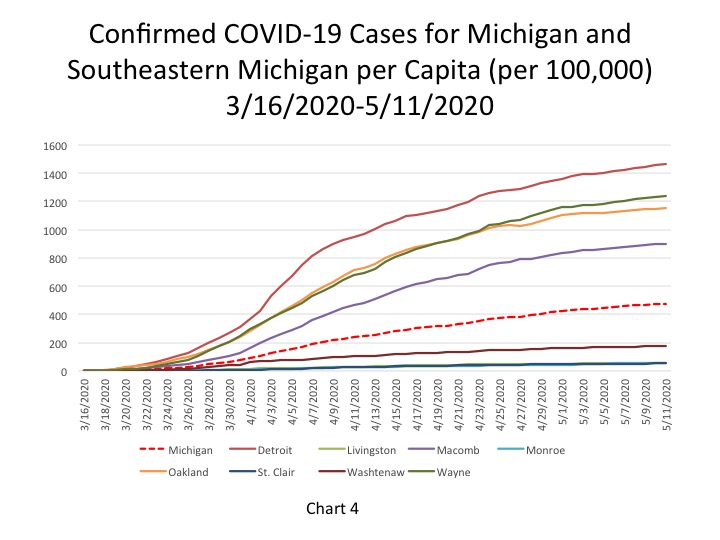
According to the State of Michigan, the total number of COVID cases in Michigan rose to 47,552on May 11, an increase of 414 cases from the previous day. This total was equivalent to 476 cases per 100,000 people (Chart 4). The five-day rolling average for the total number of COVID cases (Chart 1) reflects a smoother curve and adjusts for fluctuations in testing and/or the quality of reporting or failure to report. That upward trend of the curve has been flattening in recent weeks as the number of new COVID cases, both throughout the State and regionally, gradually declines. In Southeastern Michigan, Detroit reported the highest number of daily cases at 63 on May 9; this was a decline from the day before (Chart 3). Note that this five day rolling average causes these daily case and daily death charts to lag two days behind.
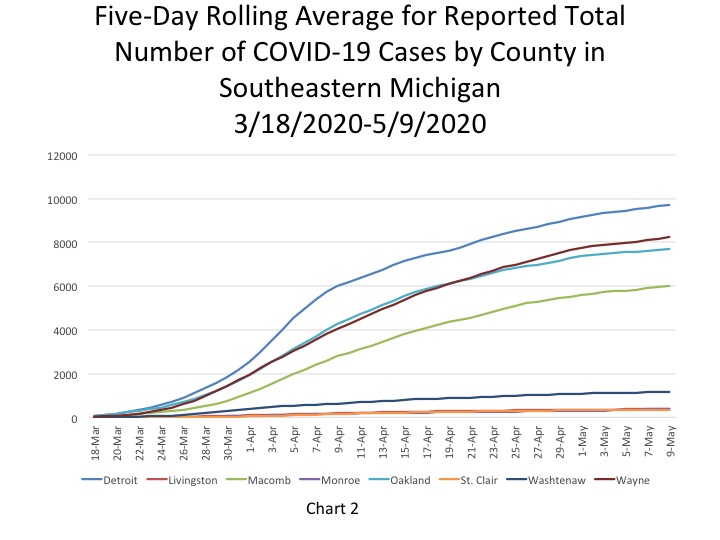
Chart 2 shows that over the last several days, based on the five-day rolling averages, the number of new COVID cases in Southeastern Michigan has remained fairly consistent, allowing the curve to flatten. The number of cumulative COVID cases remains the highest in Detroit at 9,712 on May 9, with Wayne County following at a reported 8,232 cases. On May 9, the five-day rolling average for the number of COVID cases in Oakland County was 7,694, and Macomb County reported 5,993.
The daily data highlighted in these posts is from Michigan.gov/coronavirus, where data is updated daily at 3 p.m. Historical data were supplied from covidtracking.com, which republishes COVID data from the State.
The City of Detroit had 1,464 COVID cases per 100,000 people on May 11, an increase from 1,455 the day before (Chart 4). This is based upon a reported increase of 65 new cases, bringing the total number of COVID cases in Detroit to 9,851. Wayne County reported 1,240 cases per 100,000 people, and Oakland County had 1,152 cases per 100,000 people. These per capita rates were based upon 8,343 total cases for Wayne and 7,752 for Oakland. Macomb County reported 901 cases per 100,000 people, which is based upon 6,064 cases.
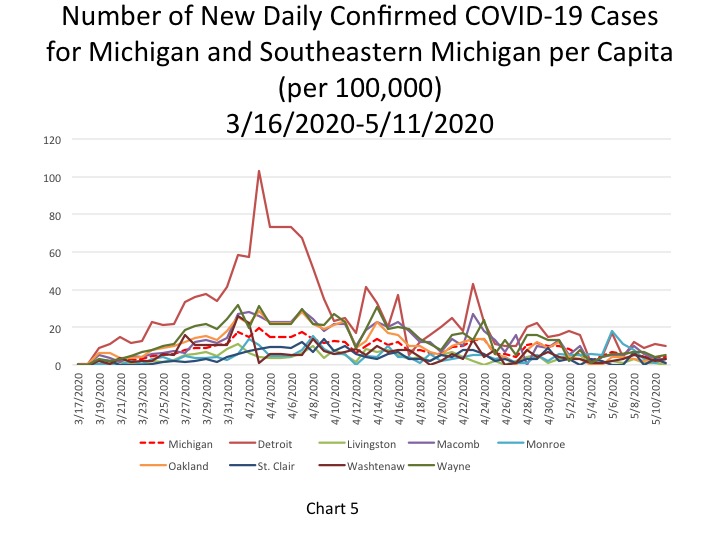
Chart 5 shows that the per capita rate for the number of new daily COVID cases per 100,000 people remained fairly stable for Detroit since May 8. On May 11 Detroit reported 10 new COVID cases per 100,000 people, which was equivalent to 65 new cases. Detroit experienced a small decline in its per capita rate while Monroe, Washtenaw and Wayne counties all experienced small increases. On May 11 Monroe County reported 3 daily COVID cases per 100,000 people, as did Washtenaw County; Wayne County reported 5 daily COVID cases per 100,000 people. These per capita rates were equivalent to 4, 10 and 54 new cases, respectively. Oakland County reported a per capita rate of 1 new case per 100,000 people on May 11, which was equivalent to 16 new cases, and Macomb County reported a rate of 3, which was equivalent to 22 new cases.
The State’s per capita rate was 3.8 new cases per 100,000 people, equivalent to 382 new cases. In total, of the 414 new cases, Southeastern Michigan accounted for 195 of them.
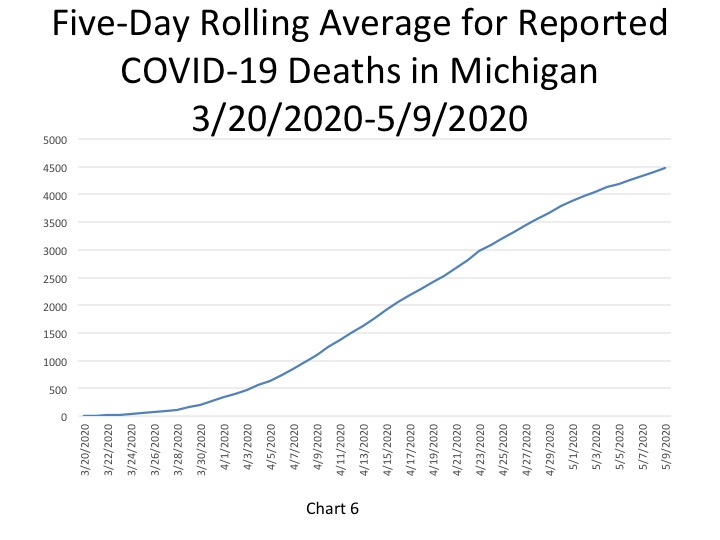
In Chart 6, the five-day rolling average for the number of deaths shows a continuing slow increase (a lagged number of 4,480 deaths, an increase of 67deaths). The actual reported COVID-19 deaths reached 4,584 on May 11, an increase of 33 deaths from the day prior. Of those 33 daily deaths reported on May 11, 16 were in Southeastern Michigan. While there was a small increase in the number of daily deaths between May 10 and 11, the numbers reported both days are still significantly lower than what has been reported for more than a month.
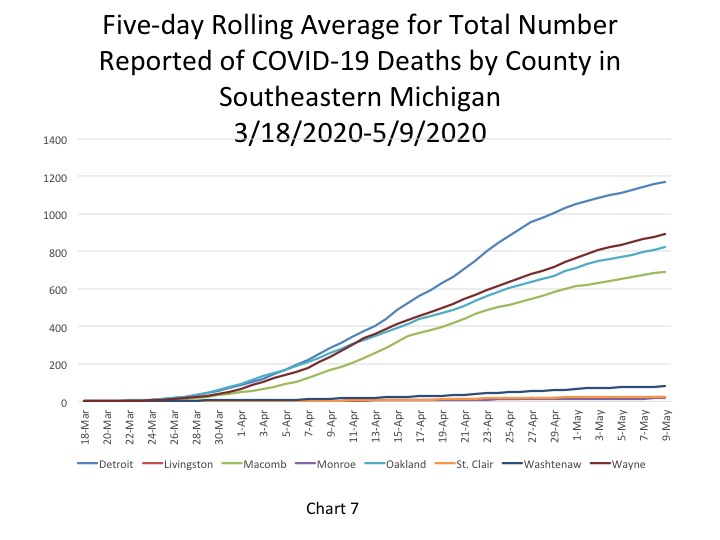
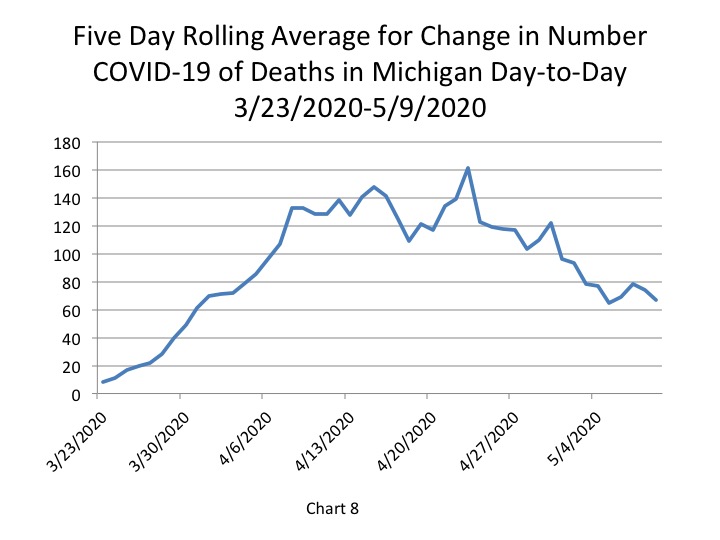
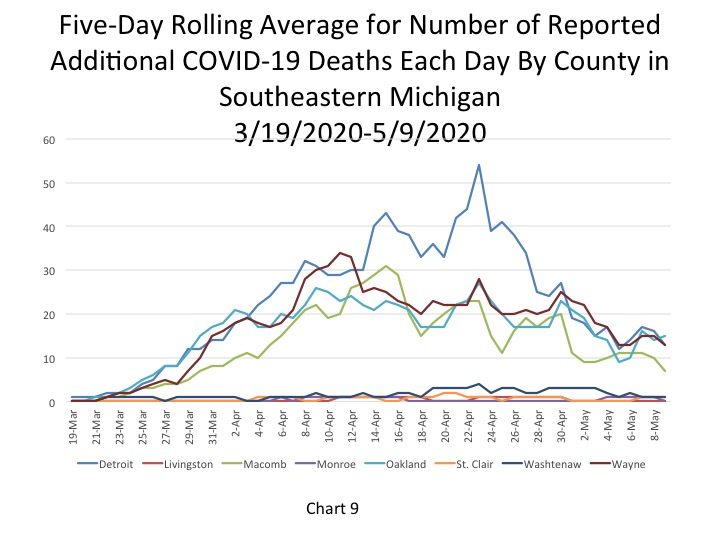
Chart 7 portrays how the total number of COVID deaths in Southeastern Michigan continues to increase, but that rate of increase has been gradually declining overall, showing that the curve is slowly starting to flatten. Chart 9 highlights how the curve is flattening throughout Southeastern Michigan, with the number of daily deaths throughout the region not reaching more than 15 in any one government entity on May 9. Oakland County reported the highest number of additional deaths on May 9 at 15, this was based on a 5-day rolling average calculation. Detroit and Wayne County each reported 13 additional daily deaths. Such declines in the number of daily deaths in Southeastern Michigan is why, in large part, the State continues to experience a decline in its daily death numbers (Chart 8), which reflects a slower increase in the overall number of COVID deaths.
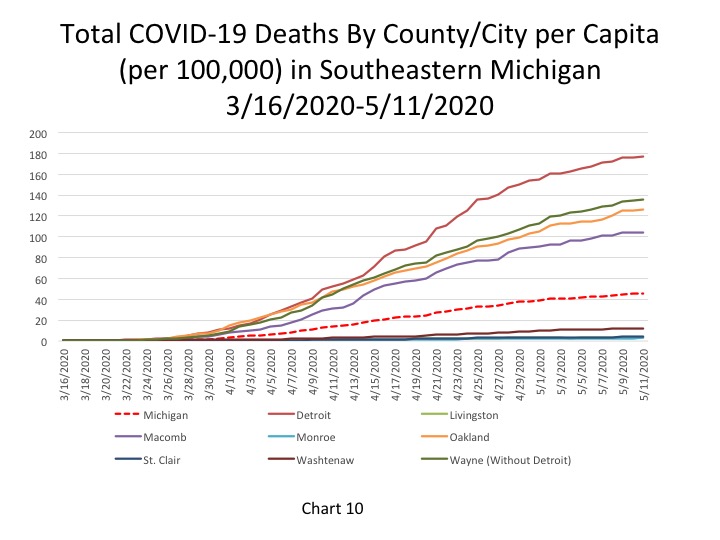
Chart 10 portrays the total number of COVID deaths per 100,000 people. As of May 11, the cumulative total of COVID deaths per 100,000 people in Detroit was 177 (representing 1,192 deaths). In Wayne County there were 136 COVID deaths per 100,000 people (913 total deaths), in Oakland County there were 126 deaths per 100,000 people (849 total deaths), and in Macomb County there were 104 COVID deaths per 100,000 people (699 total).
The State of Michigan had 46 COVID deaths per 100,000 people, a rate that continues to remain lower than the four entities discussed above.
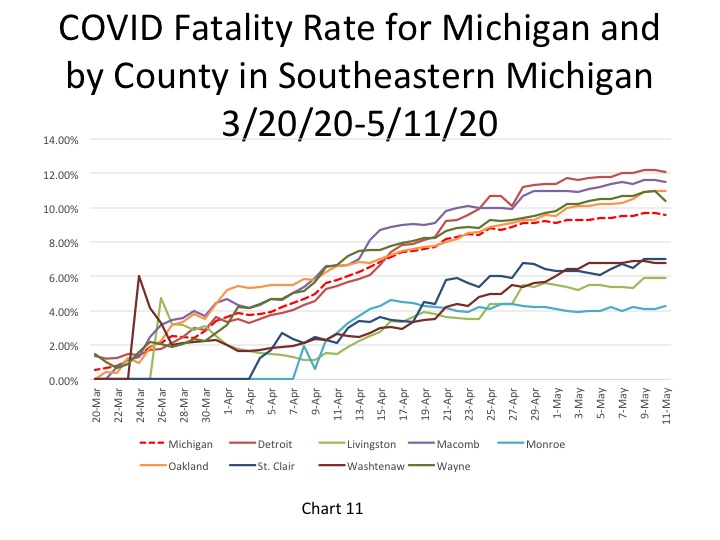
The fatality rate for Detroit and the State both declined by 0.1 percent on May 11. Detroit reported a fatality rate of 12.1 percent, and the State reported a fatality rate of 9.6 percent. Detroit and the three largest counties in the region continue to have fatality rates at or above 11 percent.
One reason we may be seeing such high fatality rates in Michigan is due to the low testing rates. When only having-presumably-a lower of number confirmed COVID cases than is actually likely due to the limited availability of tests, the fatality rate appears higher because the base comparison is smaller than it might be.
Michigan reported 33 additional deaths on May 11, and while this was an increase from the day before, it was still among the lowest number of daily deaths reported since late March. The data shows that daily death and case numbers continue to trend downward. However, Michigan remains one of the hardest hit states. It ranks seventh in the nation in confirmed cases and fourth in deaths.