The number of COVID cases in Michigan has flattened over the last several months, but as daily data show new cases continue to be reported. On June 22, the State of Michigan reported a total of 61,609 cases, an increase of 179 cases from the day prior. The daily total was equivalent to 615 cases per 100,000 people (Chart 4). Of those 179 cases, 61 were documented in Southeastern Michigan. In total, 34 percent of the new COVID cases were in Southeastern Michigan, meaning case numbers are increasing at a higher rate outside of the region than locally. In Chart 1 we show that the State total for the number of COVID cases on June 20 was 61,034–a five-day rolling average. The five-day rolling average for the total number of COVID cases (Chart 1) reflects a smoother curve and adjusts for fluctuations in testing and/or the quality of reporting or failure to report. This continues to be important as the State of Michigan regularly updates its past COVID data and not all State changes can continuously be updated here.
Chart 2 shows that, based on the five-day rolling averages, the growth of new COVID cases in Southeastern Michigan has been increasing at a much slower pace compared to previous months. However, Detroit and Wayne, Oakland and Macomb counties continue to add cases. On June 20 the number of cases in Detroit reached 11,376, the highest in the region, and Wayne County reported the second highest number of cases at 9,946. On June 20, the five-day rolling average for the number of COVID cases in Oakland County was 8,864, and Macomb County reported 6,974.
The City of Detroit had 1,694 COVID cases per 100,000 people as of June 20, an increase from 1,692 on June 19 (Chart 3). This is based upon a reported increase of 13 new COVID cases since June 19, bringing the total number of COVID cases in Detroit to 11,394. Wayne County reported 926 cases per 100,000 people, and Oakland County had 690 cases per 100,000 people. These per capita rates were based upon 9,970 total cases for Wayne and for 8,674 Oakland. Macomb County reported 799 cases per 100,000 people, which is based upon 6,983 cases.
The daily data highlighted in these posts is from Michigan.gov/coronavirus, where data is updated daily at 3 p.m. Historical data were supplied from covidtracking.com, which republishes COVID data from the State. Additionally, the case totals do not reflect the number of people who have recovered, just those who have been infected. In early June the State changed how it reports its data on the website, making data more accurate in the long-term but more complicated to track as well. The State regularly updates older data and as we continue to publish regular updates on COVID the State’s changes to past data many not always be reflected in our posts. The data published in new posts is accurate for the day we received it on though.
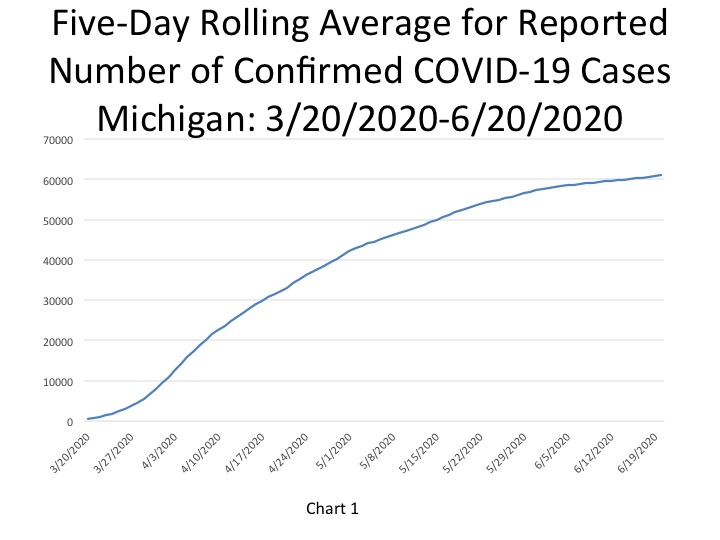
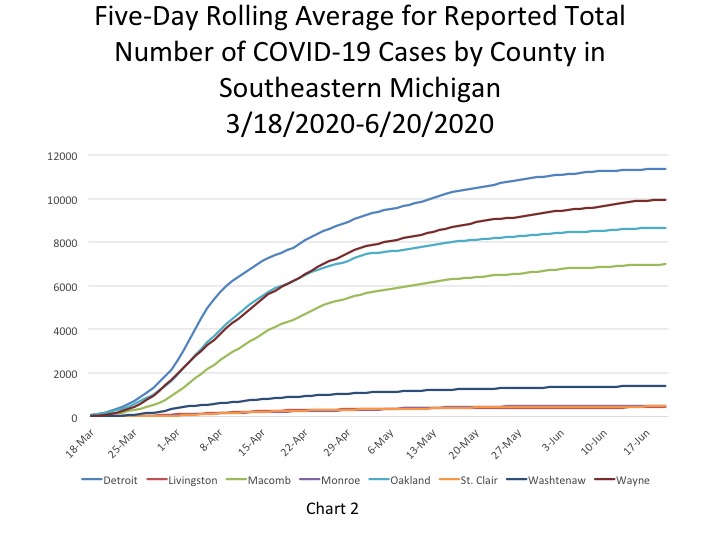
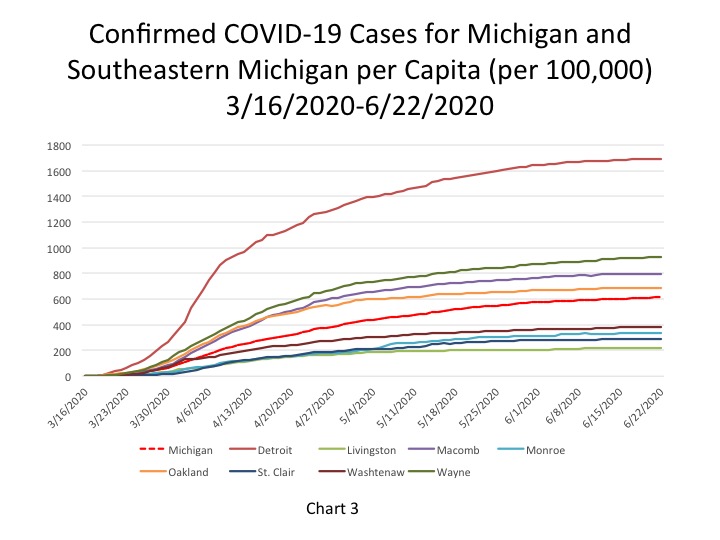
Chart 4 shows that Wayne County reported the highest number of daily cases, according to the five-day rolling average, at 13 on June 20. Detroit reported 8 new daily cases while Oakland County reported 6 and Macomb County reported 3. As Map 1 shows, Detroit and Wayne and Macomb counties all reported a lower number of new daily cases on June 20 than what the average was for last week (June 11-18). For example, last week Detroit averaged 12 new COVID cases and on June 20 it reported 8. Oakland County though had an average of 0.6 new cases last week and reported 6 new cases on June 20 through 5-day rolling average calculations. So, while there are signs the number of new cases are declining regionally, the data also shows that nowhere is immune from having its numbers increase again.
On June 22, the per capita rate for the number of new daily COVID cases per 100,000 people was 2 for the State, which was equivalent to 179 new cases. On June 22, Detroit and Monroe and Washtenaw counties all reported the same per capita rate for the number of new daily COVID cases per 100,000 people as the State-2. Detroit’s per capita rate of 2 was equivalent to 13 new cases per 100,000 people, based on an actual number of cases. St. Clair County reported a per capita rate of 3 and the remaining counties all reported per capita rates of 1. Wayne County’s per capita rate of 1 was equivalent to 22 new cases, the highest in the region that day. The second map below (Map 2) shows that while Detroit’s per capita rate on June 22 is on par with its average rate for the number of new daily COVID cases per 100,000 people for the week of June 11-18, St. Clair County is experiencing higher numbers this week than last. St. Clair County had a per capita rate of 3 on June 22 and an average per capita rate of 0.8 last week.
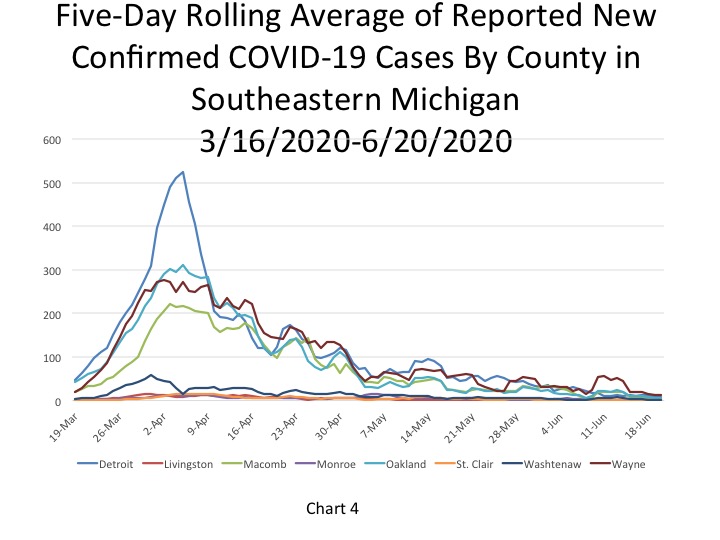
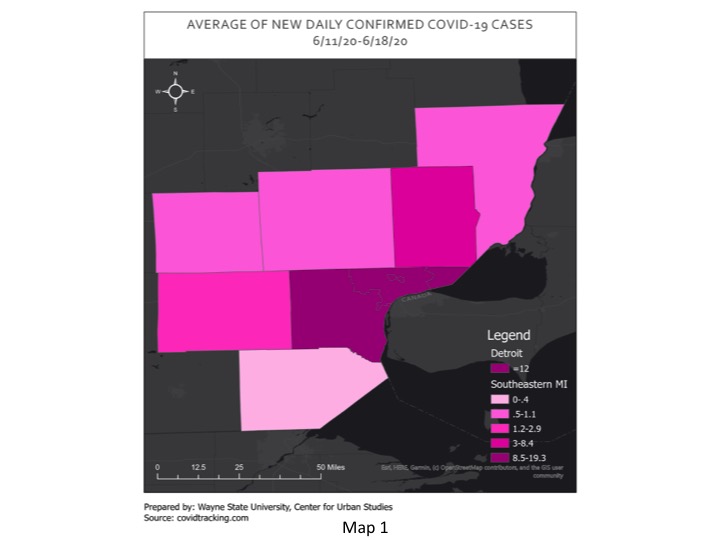
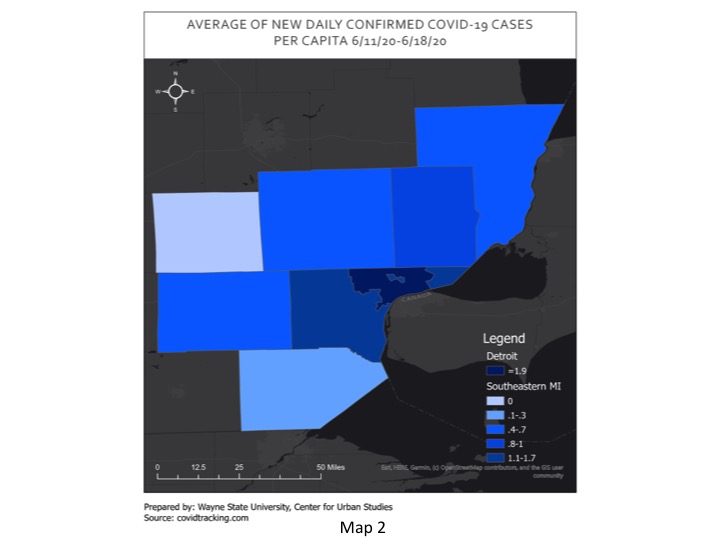
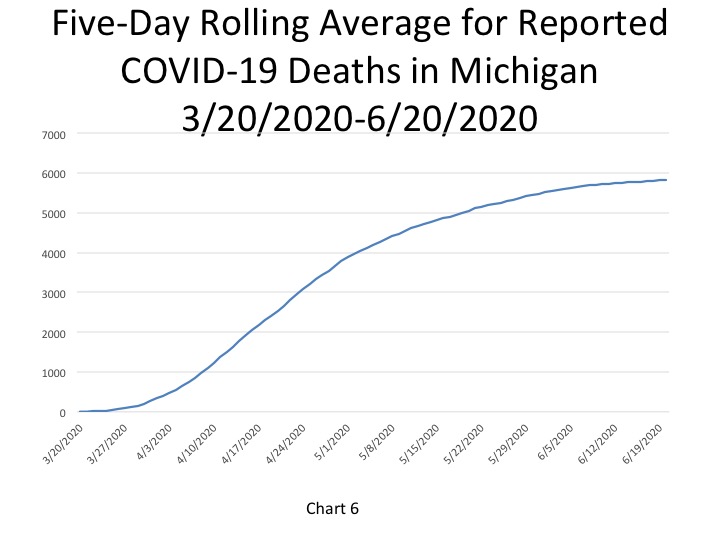
In Chart 6, the five-day rolling average for the number of deaths in Michigan shows how they have leveled off during the month of June. On June 20 there were 5,837 deaths (an increase of 12 deaths from the day prior). The actual cumulative COVID-19 deaths on June 22 was 5,853, an increase of 7 deaths from the prior day. Of those deaths that occurred, 4 were in Southeastern Michigan.
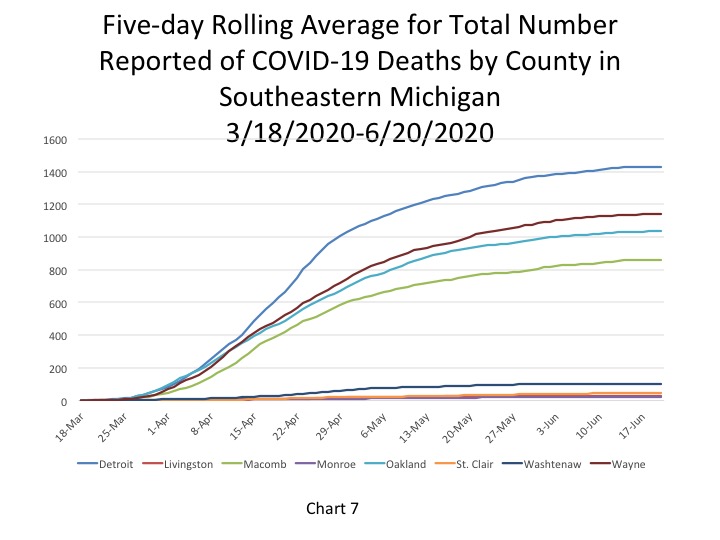
Chart 7 (a 5-day rolling average) further reflects how the number of deaths has leveled off in the State and Southeastern Michigan. On June 20 the City of Detroit reported 1,428 deaths, and while it is still the highest number in the region, that number has only increased by 25 total deaths since June 8. Wayne County had the second highest total at 1,141 deaths on June 20; Wayne County had 1,120 deaths on June 8.
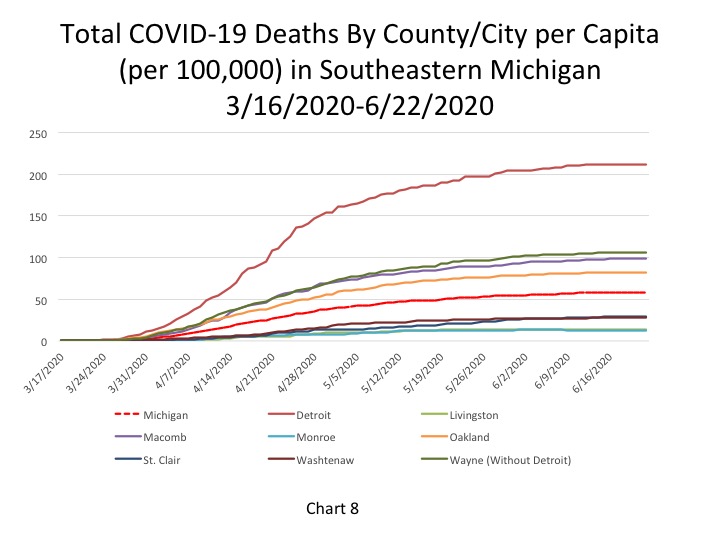
The per capita rates for the number of total COVID deaths in Southeastern Michigan remained the same for each entity on June 22; these rates have all remained the same since June 14. Detroit reported 212 total COVID deaths per 100,000 people (1,428 deaths), Wayne County reported a per capita rate of 106 (1,143 deaths), Macomb County reported a per capita rate of 99 (862 deaths) and Oakland County reported a per capita rate of 82 (1,037 deaths).
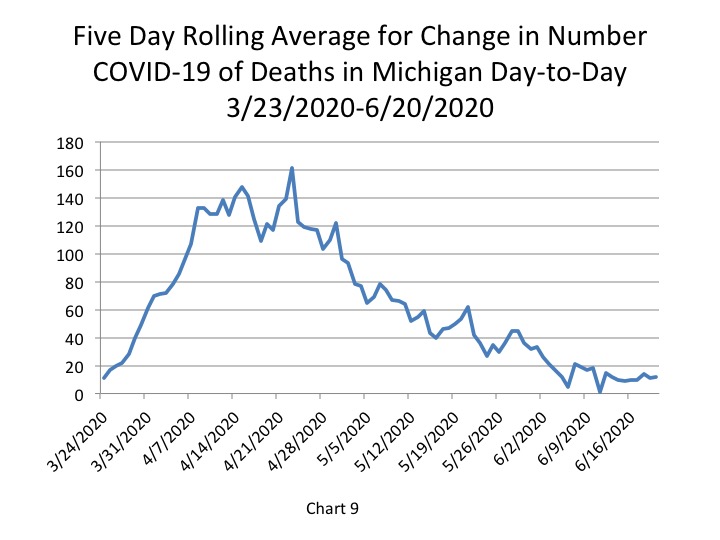
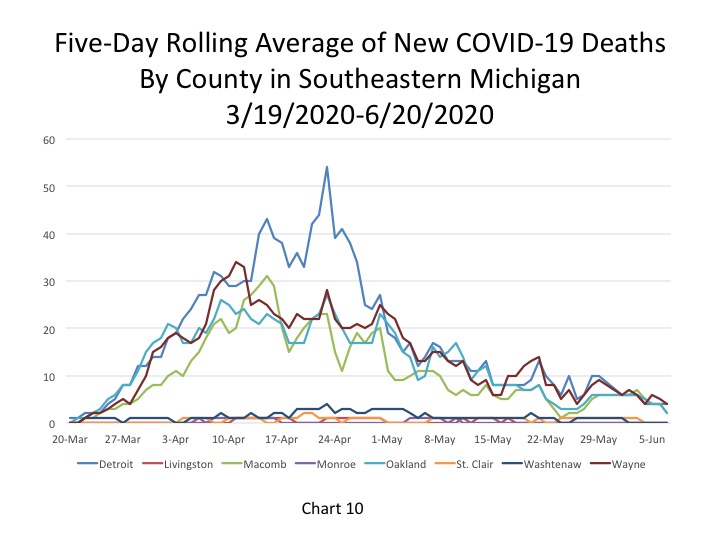
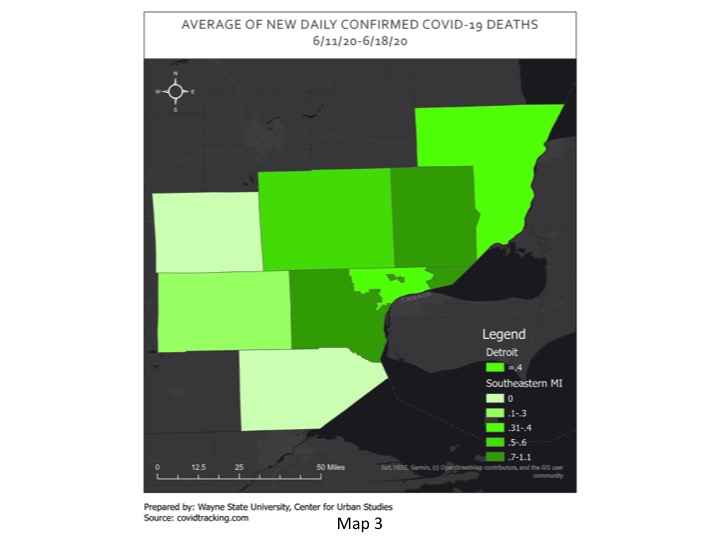
Chart 9, the five day rolling average of deaths, shows the number of new statewide deaths was reported at 12 on June 20, an increase from the 11 new deaths reported the day before. While the number new statewide deaths did slightly increase on June 20, the overall number has not gone above 18 since June 10. In mid-April the number of new deaths in Michigan reached a peak at 145. Furthermore, Chart 10 shows how the number of deaths in Southeastern Michigan continues to decline, a trend we are eager to see continue. Oakland and Wayne counties each reported 1 new death, the highest in the region. These numbers are based on 5-day rolling averages. As the map below shows, Detroit and each county in the region experienced a decrease in the number of deaths from June 20 and the average number of deaths last week. Wayne County had the highest average number of deaths from the week of June 11 to 18 at 1.1, and on June 20 it was reported at 1. Detroit averaged 0.4 deaths last week and reported 0 new deaths on June 20.
While we know that the number of COVID cases and deaths has decreased throughout the month of June we also continue to see spikes in new cases periodically in different areas throughout the State. For example, note how majority of the number of new cases reported in Michigan on June 22 were from outside the State’s most populate region. Additionally, Southeastern Michigan has been the last area in the State to loosen restrictions. Overall, Michigan has experienced a recent uptick in the number of new cases. According to Mlive, the seven average for new COVID cases this week is 192 and last week it was 152. So, while the data shows that the curve has certainly flattened it also reflects how abiding by health recommendations set forth by the Centers for Disease Control plays a large role in flattening that curve.