The era of COVID continues, especially as we again are witnessing a case surge due to the Delta-variant. In Michigan, the level of transmission is now considered substantial, according to the Centers for Disease Control (CDC). The CDC states there are now 71 counties that are places of “substantial” or “high” transmission: Livingston, Monroe, Macomb, Oakland, Washtenaw and Wayne are included in this list. A county is considered to have a substantial transmission rate if there are 50-99 cases per week per 100,000 people and/or a test positivity between 8 and 9.9 percent; all counties in Southeastern Michigan are considered substantial by the CDC, except St. Clair County. A county is considered to have a high transmission rate if there are 100 new cases per week per 100,000 residents, and/or there is a positive test rate of 10 percent or higher. Those Michigan counties that have a high transmission rate are Alpena, Branch, Charlevoix, Huron, Iosco, Kalkaska and Montmorency counties, according to the CDC.
Michigan reported 910,500 total confirmed COVID cases as of Aug. 6, 2021. Of that total 3,962 are confirmed new COVID cases from August 3,4 and 5, 2021 (the State no longer reports case numbers daily).
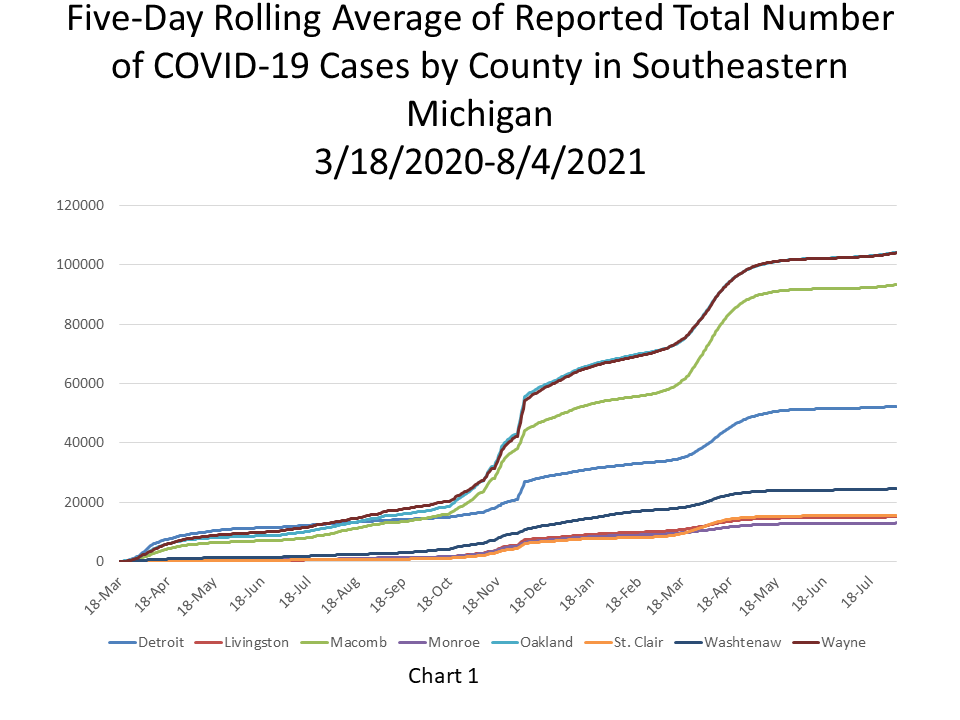
In Chart 1 we drill down into the number of confirmed COVID cases for Southeastern Michigan, by county and for the City of Detroit; all numbers are represented of a five-day rolling average. The five-day rolling average for the total number of COVID cases (Chart 1) reflects a smoother curve and adjusts for fluctuations in testing and/or the quality of reporting or failure to report. This chart also shows that, while the total number of COVID cases has grown overall since March 2020, there have certainly been surges. We also see that Oakland and Wayne counties continue to have the highest total number of COVID cases. Oakland County had the highest number of confirmed COVID cases at 104,354, followed by Wayne County with 104,090 new cases as of August 4, 2021. The City of Detroit had 52,394 confirmed cases.
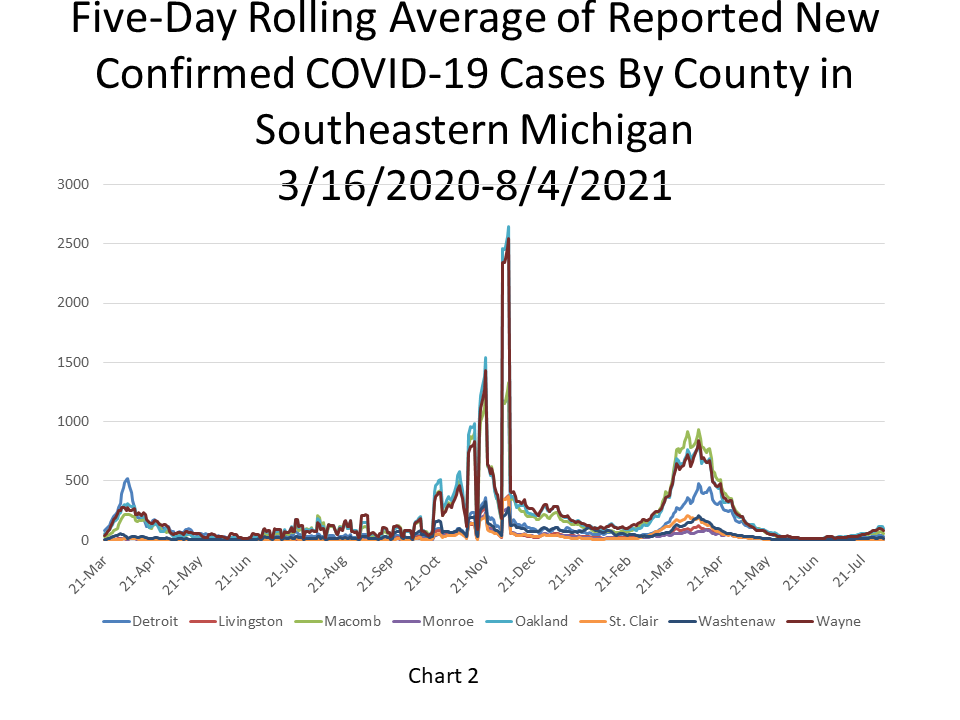
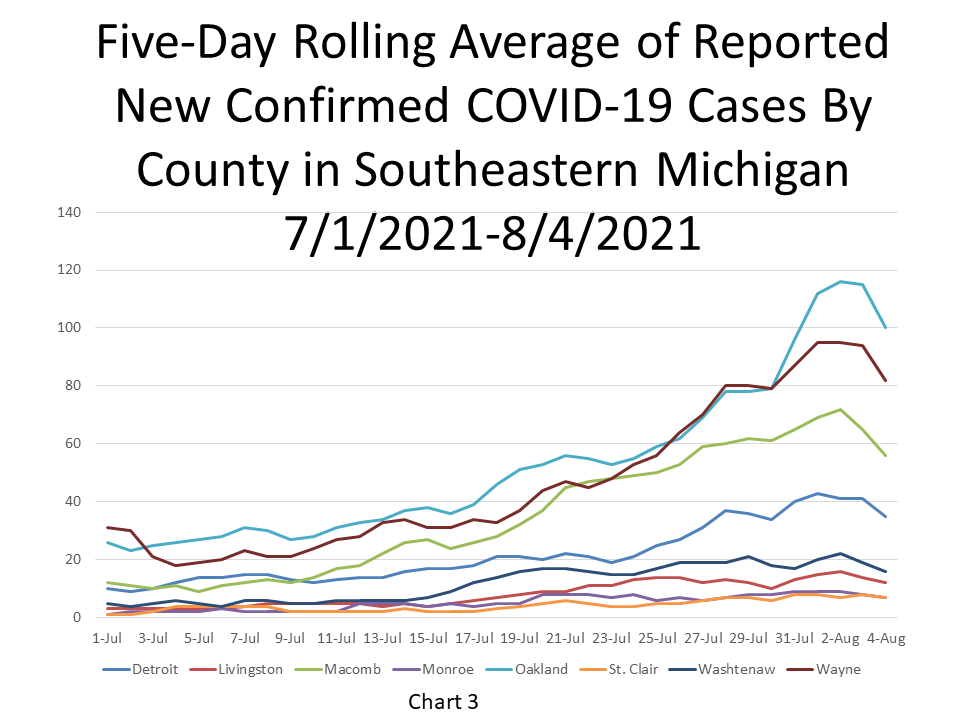
Charts 2 and 3 provide a closer look at the number of new COVID cases over time. In Chart 2 we are reminded of the COVID case surges in fall/winter of 2020 and again in spring of 2021. However, as Chart 3 shows with a zoomed in look at the last month. New COVID case numbers are again on the rise. Oakland County had the highest number of new confirmed COVID cases on August 4, 2021 with 100, followed by Wayne County with 82 new cases and Macomb County with 56 new confirmed cases.
The daily data highlighted in these posts is from Michigan.gov/coronavirus, where data is updated daily at 3 p.m. Historical data were supplied from covidtracking.com, which republishes COVID data from the State. Additionally, the case totals do not reflect the number of people who have recovered, just those who have been infected. In June of 2020 the State changed how it reports its data on the website, making data more accurate in the long-term but more complicated to track as well. The State regularly updates older data, and as we continue to publish regular updates on COVID the State’s changes to past data many not always be reflected in our posts. The data published in this post is accurate for the day we it was received and published though.
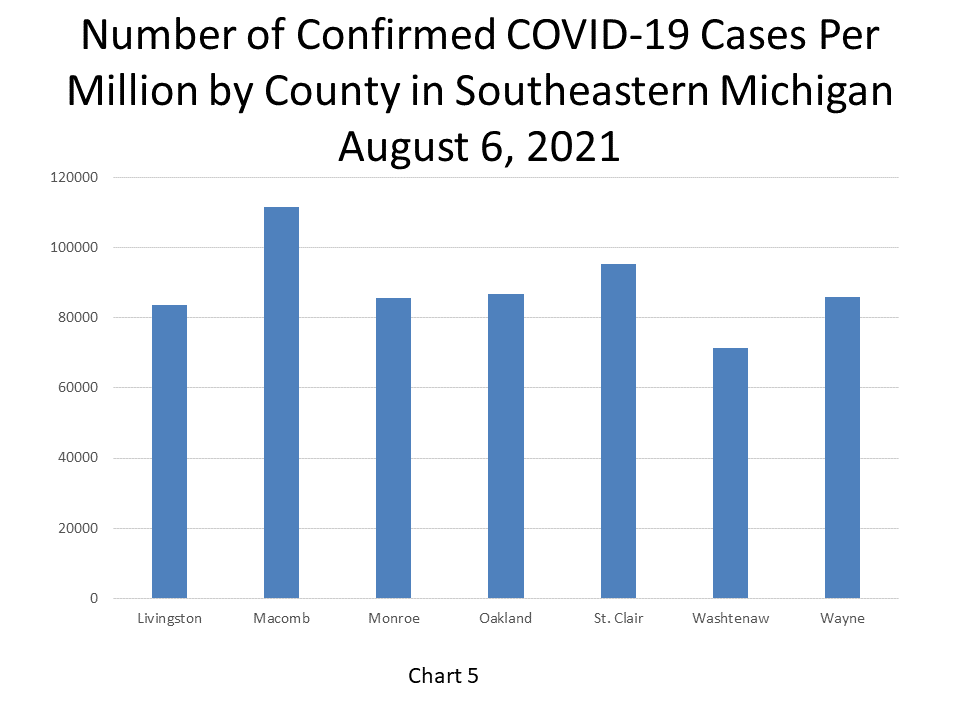
The chart below (Chart 4) shows that Macomb County had the highest number of COVID confirmed cases per capita. According to the data released on August 6, 2021 by the State of Michigan, Macomb County had 111,540 COVID cases per million people. St. Clair County had the second highest number of confirmed cases per million people at 95,339. Washtenaw County had the lowest per capita rate at 71,278 confirmed COVID cases per million people.
While the current surge of COVID cases may not numerically appear to be as troubling as what we experienced in the spring and fall, the Delta variant is highly transmissible and a cause for both caution and concern, especially for the unvaccinated. As of last week the variant was confirmed in 40 different Michigan counties.
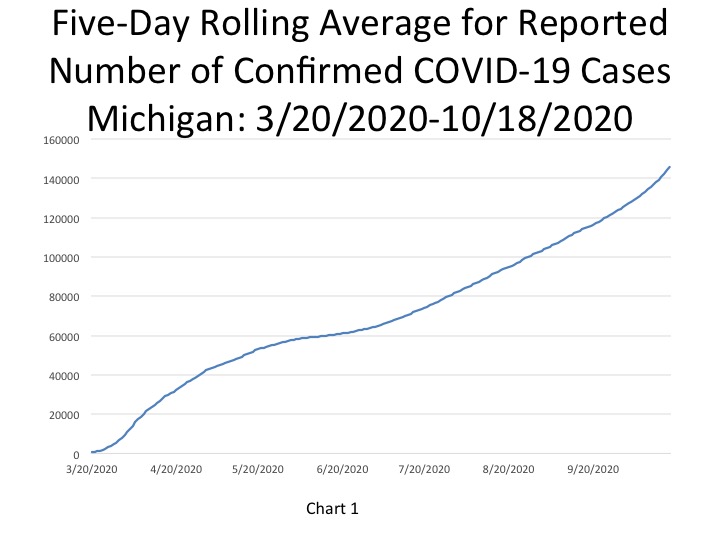
Michigan reported 1,586 new COVID cases on Oct. 20, 2020, bringing the total number of cases reported to 149,392. In Chart 1 we show that the State total for the number of COVID cases on Oct. 18 was 145,751–a five-day rolling average. The five-day rolling average for the total number of COVID cases (Chart 1) reflects a smoother curve and adjusts for fluctuations in testing and/or the quality of reporting or failure to report.
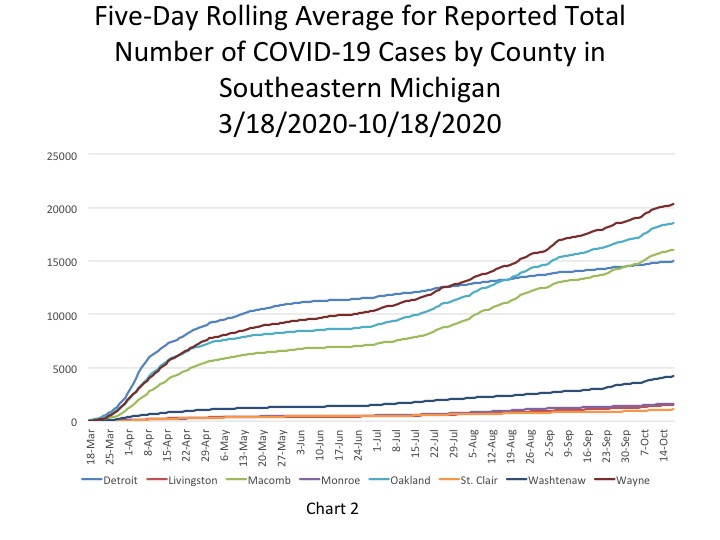
Chart 2 shows that, based on the five-day rolling averages, the growth of new COVID cases in Wayne, Oakland and Macomb counties continues to increase at higher rates than the other counties in the region and than Detroit. On Oct. 18, Wayne County reported the highest number of cases in the region at 20,322. Oakland County reported 18,589 cases and Macomb County reported 16,065. Detroit reported 14,969 COVID cases on Oct. 18; Macomb County surpassed the total number of confirmed cases in Detroit on Oct. 6. While the more densely populated areas in the region have the highest number of confirmed cases, Washtenaw County has pulled away from the other more rural counties in with higher numbers as well. Washtenaw County reported 4,190 confirmed cases on Oct. 18.
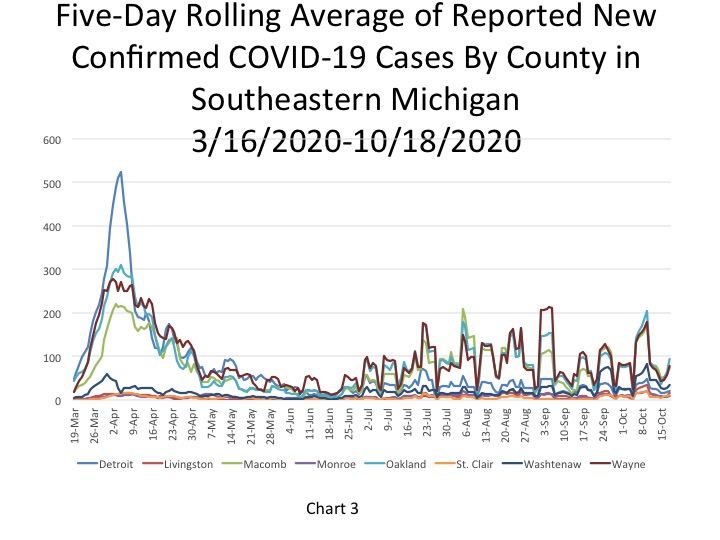
As shown in Chart 3, Oakland County reported the highest number of new daily confirmed cases on Oct. 18 at 94, followed by Wayne County with 78 new confirmed cases and Macomb County with 73. Washtenaw County reported 35 new daily confirmed COVID cases on Oct. 18 while Detroit reported 21. These numbers are also based on a five-day rolling average.
The daily data highlighted in these posts is from Michigan.gov/coronavirus, where data is updated daily at 3 p.m. Historical data were supplied from covidtracking.com, which republishes COVID data from the State. Additionally, the case totals do not reflect the number of people who have recovered, just those who have been infected. In early June the State changed how it reports its data on the website, making data more accurate in the long-term but more complicated to track as well. The State regularly updates older data and as we continue to publish regular updates on COVID the State’s changes to past data many not always be reflected in our posts. The data published in new posts is accurate for the day we received it on though.
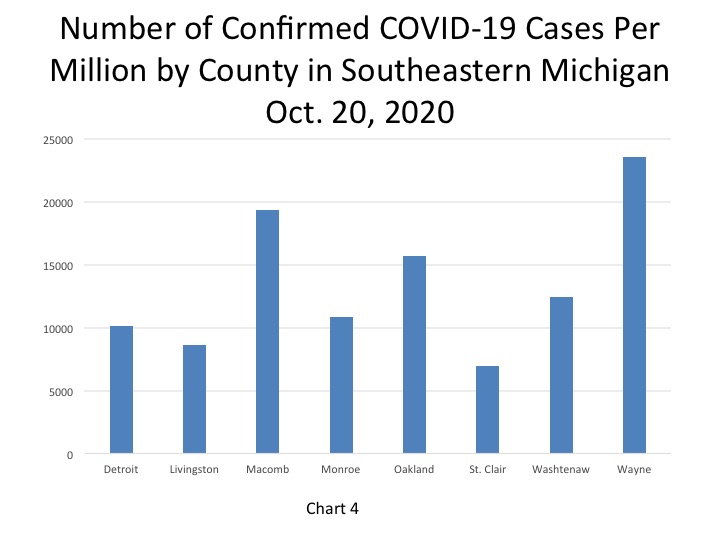
The chart below (Chart 4) highlights how Wayne County not only has the highest number of confirmed total COVID cases in the region (this data does not include Detroit’s numbers) it also has the highest number of confirmed cases per capita. According to the data released on Oct. 20, Wayne County had 23,598 COVID cases per million people. Macomb County had the second highest number of confirmed cases per million people at 19,351. Detroit had 10,019 confirmed COVID cases per million people; the only two counties in the region with few number of cases per capita were Livingston and St. Clair counties.
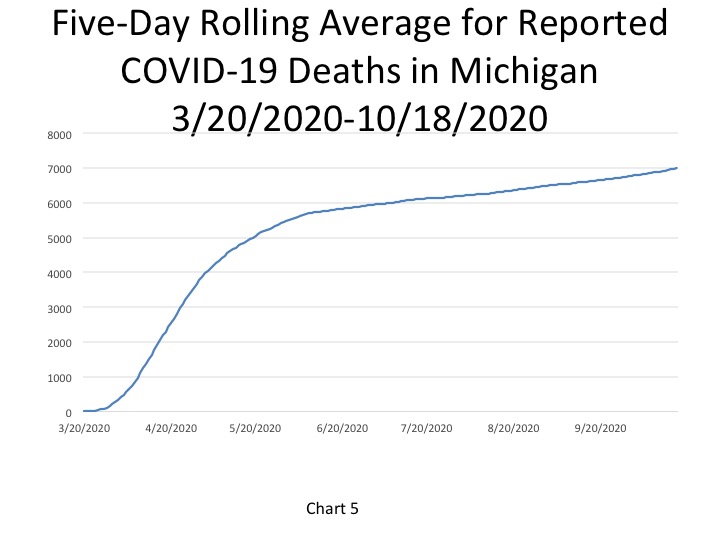
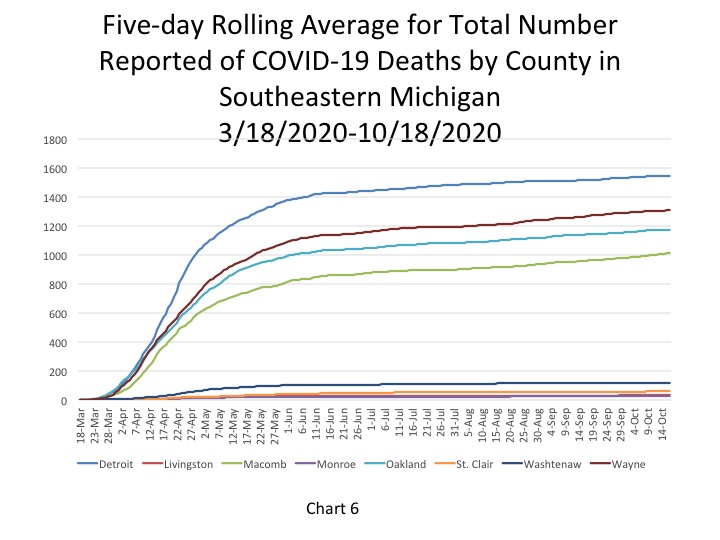
In Chart 5, the five-day rolling average for the number of deaths, shows the number of deaths in the State of Michigan reached 6,996 on Oct. 18. The actual cumulative COVID-19 deaths on Oct. 20 was 7,053, an increase of 22 deaths from the prior day, with one of those deaths being added to the total through death record reviews. Chart 6 (a five-day rolling average) shows that on Oct. 18, the City of Detroit reported 1,546 deaths. Wayne County had the second highest total at 1,309 deaths on Oct. 18. Although the curved has flattened for the number of COVID deaths in Southeastern Michigan, the numbers are still growing, just at a much slower pace.
COVID-19 numbers in Michigan continue to increase at a quicker rate than what has occurred in months. Classrooms and gatherings some of the main areas where outbreaks are occurring. According to the State of Michigan, as of Oct. 15, there were outbreaks in 84 Michigan school buildings in 31 counties. Overall, between Oct. 8 and Oct. 15 there was a 25 percent increase in K-12 classroom outbreaks. Furthermore, universities are also seeing increases in the student population contracting COVID. To slow the spread within this community some universities and local health departments are taking their own precautions. For example, the Washtenaw County Health Department just issued a 2-week stay at home order for University of Michigan undergraduate students to curb the spread. In Washtenaw County last week the number of new confirmed and probable COVID cases increased by more than 600.
As the daily number of confirmed COVID cases continue to increase by more than 1,000 daily we must continue practice the mandates set forth by the Michigan Department of Health and Human Services, which includes wearing masks, remaining socially distant and limiting social gatherings.
The coronavirus pandemic has impacted the daily lives of everyone-from their work and school schedules to the way we obtain goods and services to how we recreate and interact with others. These changes directly relate to national and local mobility trends, especially since several Executive Orders in Michigan have either mandated or encouraged people to stay home and telecommute whenever possible.
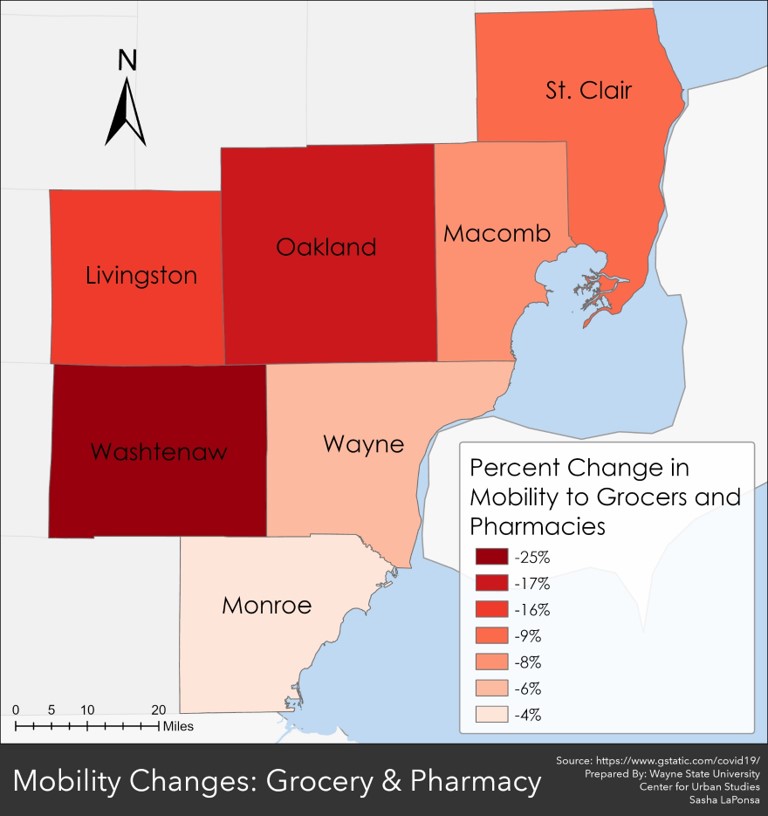
The data we present here show the changes in mobility in Southeastern Michigan. These data were produced by Google, which is creating mobility reports for each State during this pandemic. The data presented below highlights the percent change in visits to places like grocery stores and parks in the seven counties that make up Southeastern Michigan. The list below is the percent change in mobility to these places between the first of April to mid-May for the State of Michigan. The maps below also reflect that timeframe and show the percent change in mobility trends at the county level for Southeastern Michigan compared to what baseline for mobility was to these places before the pandemic hit.
Shifts in Mobility Trends: Michigan
Residential: +8%
Workplaces: -28%
Grocery and pharmacy: -6%
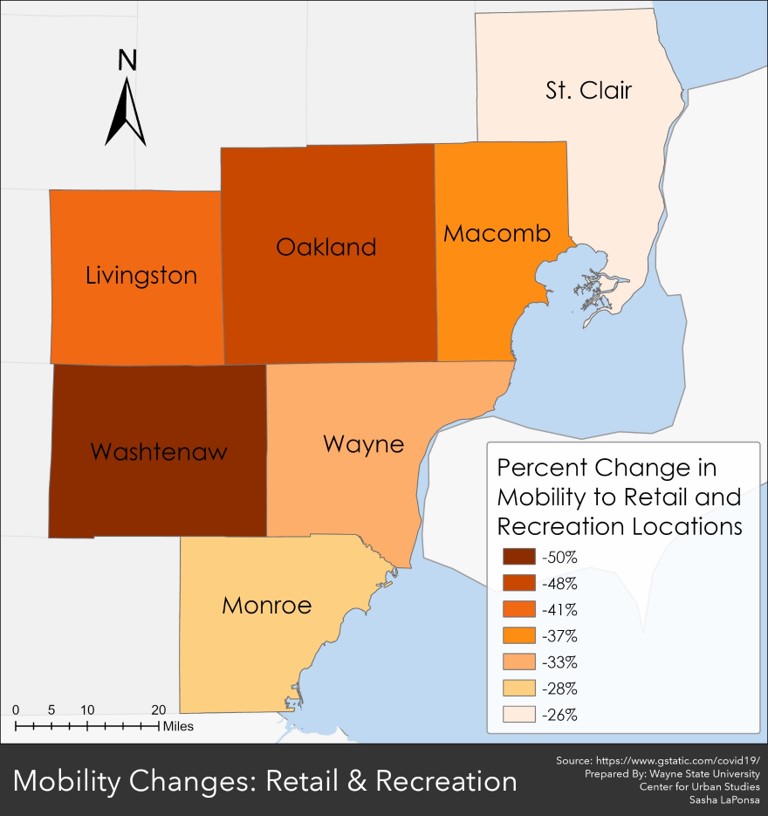
Retail and recreation: -34%
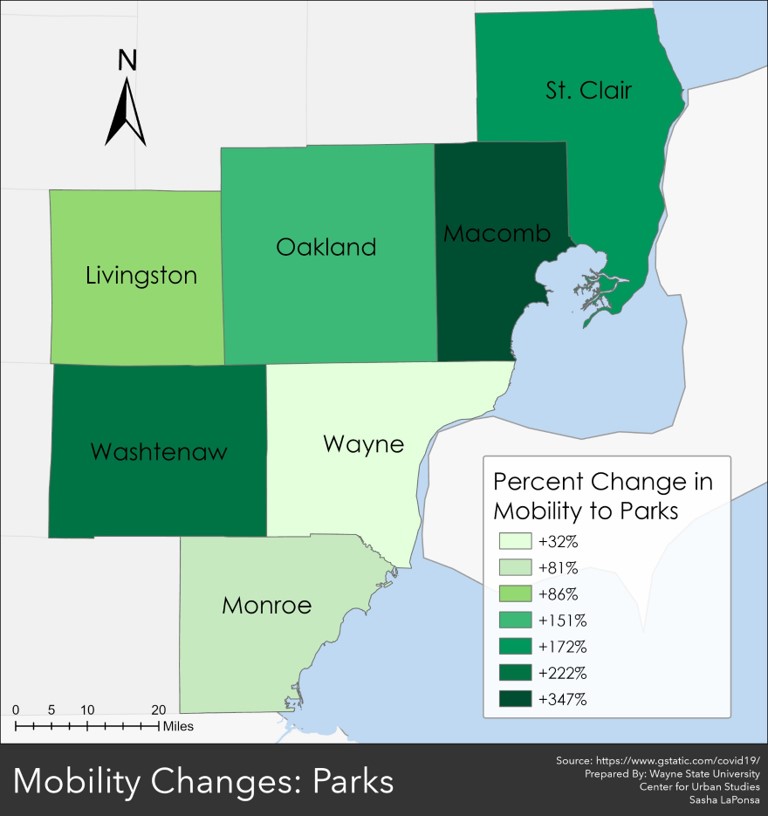
Parks: +180%
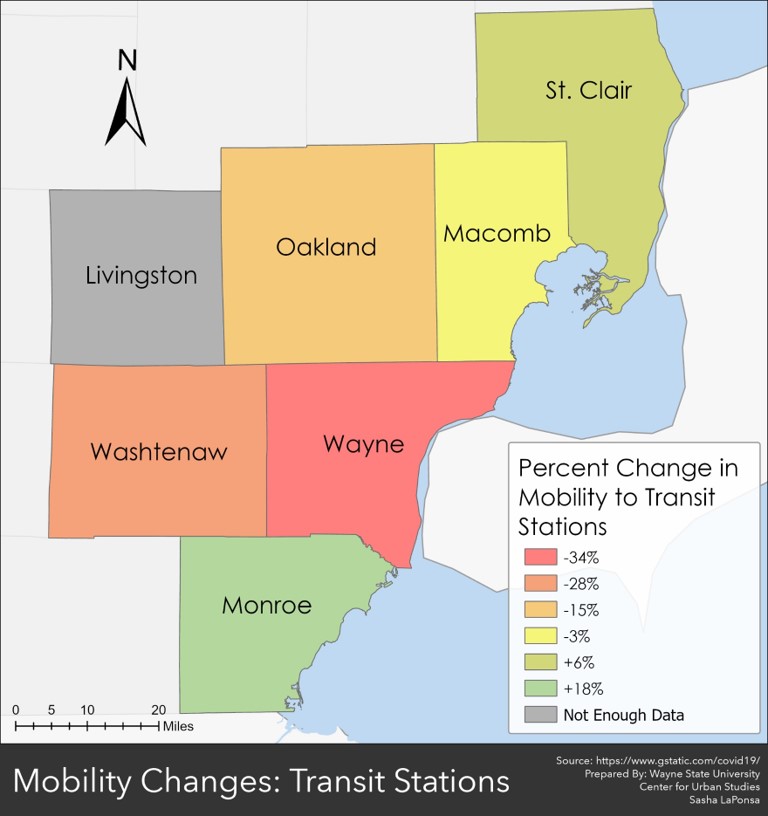
Transit stations:-24%
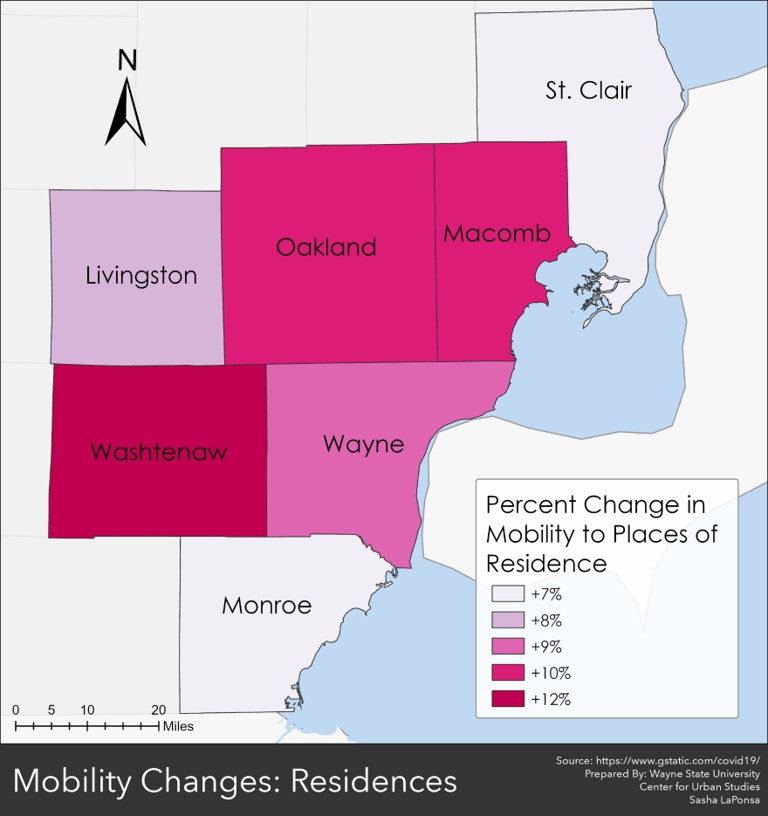
Places of Residence
With the coronavirus pandemic came a statewide lockdown, which mandated people only leave their homes for necessities and not to visit with anyone outside of their homes, unless they were an essential worker. However, even with the mandate there was an increase in mobility between residences, statewide and locally. Statewide, there was an 8 percent increase in mobility to residential homes, and in Southeastern Michigan there was between a 7-12 percent increase, depending on the county. Washtenaw County had the highest percent increase in mobility between residences at 12 percent; St. Clair County had the lowest percent change at 7 percent. In Wayne County there was a 9 percent increase in mobility between residences, and in Macomb and Oakland counties there was a 10 percent increase.
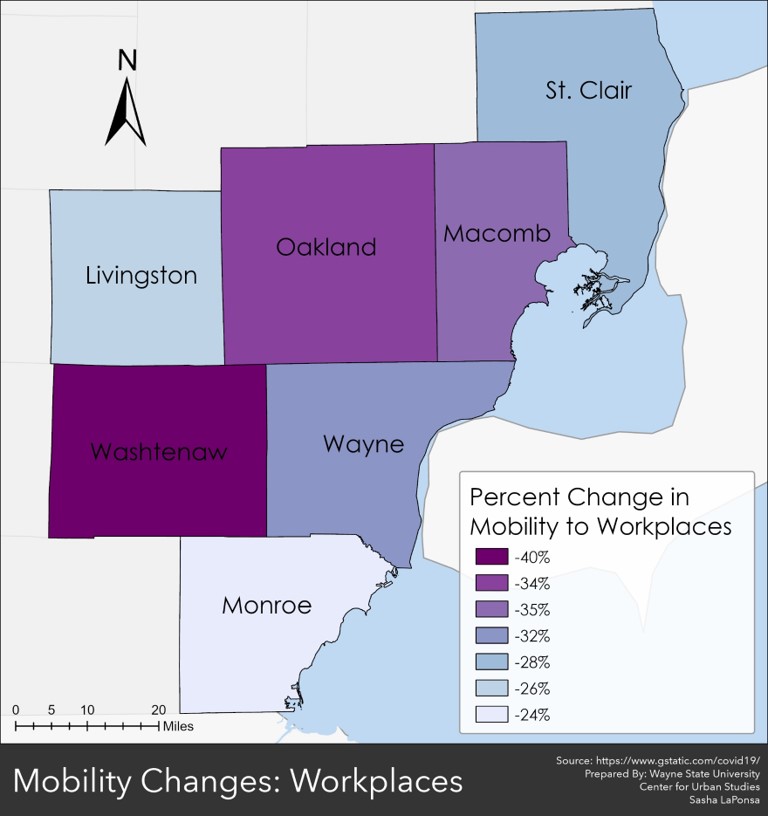
Workplaces
As noted, the Governor’s emergency orders throughout the pandemic have required certain places of business to close and for others to allow for telecommuting whenever possible. With such policy shifts came a decline in mobility to workplaces all throughout Michigan. At the State level there was a 28 percent decline from the normal amount of mobility to workplaces, and throughout Southeastern Michigan there was between a 24-40 percent decline in mobility to workplaces between the beginning of April and mid-May. Washtenaw County had the largest decline at 40 percent. In Wayne County there was a 32 percent decline in mobility to workplaces prior the coronavirus pandemic, in Oakland County there was a 36 percent decline, and in Macomb County there was a 35 percent decline. Monroe County had the smallest percent decline from the baseline at 24 percent.
Grocery Stores and Pharmacies
Between April and mid-May there was a decrease in mobility to grocery stores and pharmacies throughout Michigan, including in Southeastern Michigan. Washtenaw County experienced the largest decline at 25 percent while Monroe County’s shift was only 4 percent lower than the amount residents normally commute to these places. Although we witnessed bare shelves at the beginning of the pandemic, with certain product shortages continuing through today, the decline in mobility to these stores is not surprising as both consumers and businesses shifted to online and third party delivery services.
Retail and Recreation Locations
With the restrictions on business operations, including if they could even remain open to the public, it is also not surprising that at the State and local levels mobility trends have experienced a decline to retail and recreation locations. Washtenaw County again experienced the largest decline in mobility from the frequency residents were traveling before the pandemic to retail and recreation locations. According to the data, there was a 50 percent decline in commuting to retail and recreation locations for Washtenaw County. In Wayne County that decline was 33 percent, in Macomb County it was 37 percent, and in Oakland County it was 48 percent. At the State level there was a 34 percent decline from the baseline in the amount people traveled to retail and recreation locations.
Parks
Similar to the trend being experienced at the State level, all counties in Southeastern Michigan have experienced an increase in mobility to parks. Wayne County experienced the smallest percent change at 32 percent while Macomb County experienced the largest percent change at 347 percent. There were three counties-Macomb, St. Clair and Washtenaw – where mobility to parks increased at a higher rate than the mobility rate increase at the State level (180 percent).
Transit Stations
The data also shows that there was a decrease in mobility to transit stations throughout most of Southeastern Michigan, but not the entire region. In Monroe and St. Clair counties there was an 18 and 6 percent increase in mobility, respectively. In Wayne County, which provides public transportation via both the Detroit Department of Transportation and the Southeastern Michigan Authority of Regional Transit (SMART) mobility to these stations decreased by 34 percent. There are also communities in Oakland County and all of Macomb County that offers public transportation via SMART; mobility to these stations declined by 15 percent and 3 percent, respectively. In Washtenaw County, where there is also a local transportation system, mobility to these stations declined by 28 percent. There was a 24 percent decline in mobility to transportation stations at the State level.
Overall, this data provides a glimpse into how the coronavirus pandemic has shifted certain aspects of our everyday ways of life. These current shifts could lead to long-term policy changes as we as a state and a nation are seeing that telecommuting, road diets and contactless shopping, among other changes, are possible. Pros and cons can be argued for the long-term impacts of such changes, however, decreases in commuting does mean a decline in certain pollutants being emitted, which is environmentally beneficial and a shift we need to implement for the long-term viability of this planet.
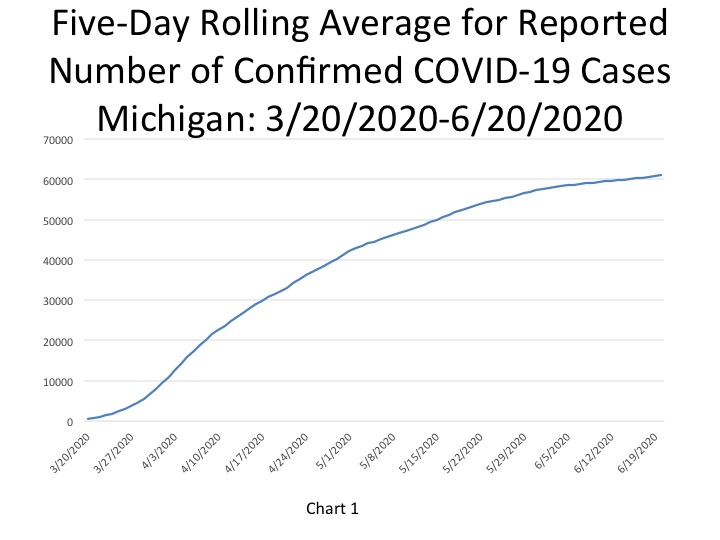
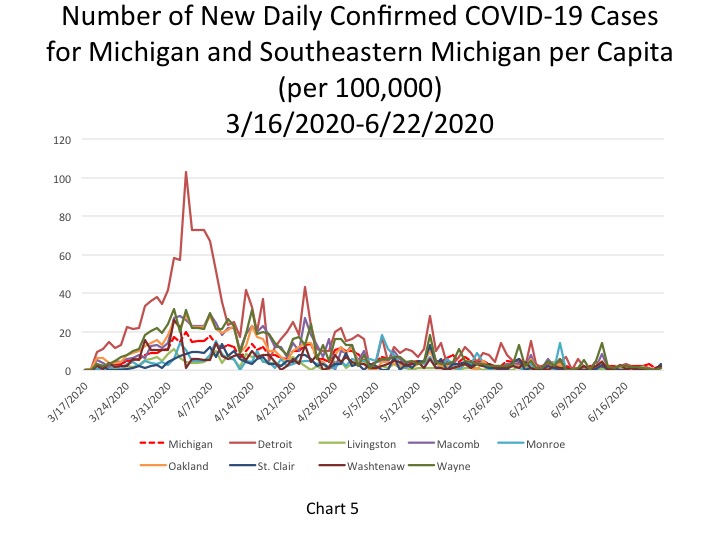
The number of COVID cases in Michigan has flattened over the last several months, but as daily data show new cases continue to be reported. On June 22, the State of Michigan reported a total of 61,609 cases, an increase of 179 cases from the day prior. The daily total was equivalent to 615 cases per 100,000 people (Chart 4). Of those 179 cases, 61 were documented in Southeastern Michigan. In total, 34 percent of the new COVID cases were in Southeastern Michigan, meaning case numbers are increasing at a higher rate outside of the region than locally. In Chart 1 we show that the State total for the number of COVID cases on June 20 was 61,034–a five-day rolling average. The five-day rolling average for the total number of COVID cases (Chart 1) reflects a smoother curve and adjusts for fluctuations in testing and/or the quality of reporting or failure to report. This continues to be important as the State of Michigan regularly updates its past COVID data and not all State changes can continuously be updated here.
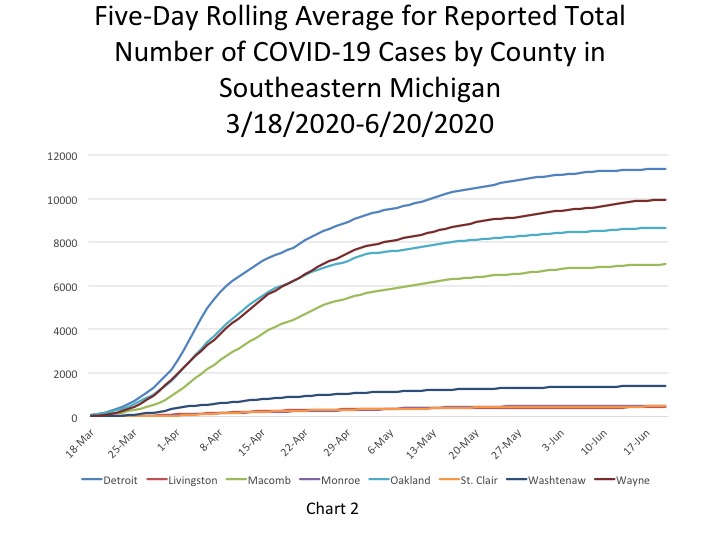
Chart 2 shows that, based on the five-day rolling averages, the growth of new COVID cases in Southeastern Michigan has been increasing at a much slower pace compared to previous months. However, Detroit and Wayne, Oakland and Macomb counties continue to add cases. On June 20 the number of cases in Detroit reached 11,376, the highest in the region, and Wayne County reported the second highest number of cases at 9,946. On June 20, the five-day rolling average for the number of COVID cases in Oakland County was 8,864, and Macomb County reported 6,974.
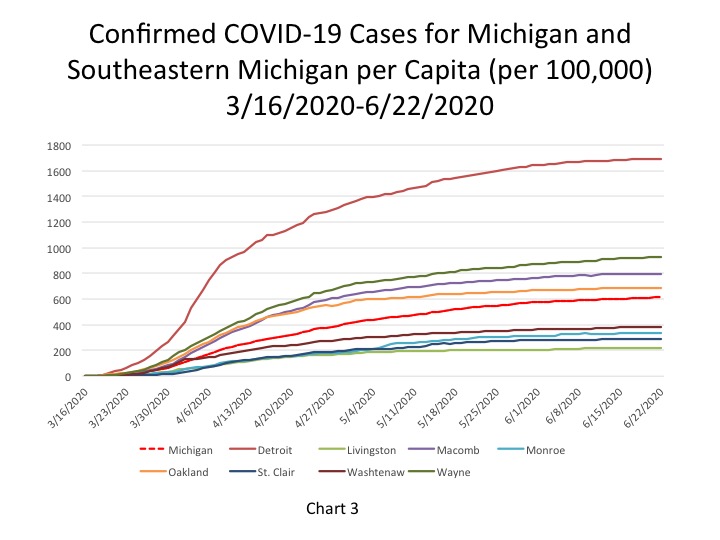
The City of Detroit had 1,694 COVID cases per 100,000 people as of June 20, an increase from 1,692 on June 19 (Chart 3). This is based upon a reported increase of 13 new COVID cases since June 19, bringing the total number of COVID cases in Detroit to 11,394. Wayne County reported 926 cases per 100,000 people, and Oakland County had 690 cases per 100,000 people. These per capita rates were based upon 9,970 total cases for Wayne and for 8,674 Oakland. Macomb County reported 799 cases per 100,000 people, which is based upon 6,983 cases.
The daily data highlighted in these posts is from Michigan.gov/coronavirus, where data is updated daily at 3 p.m. Historical data were supplied from covidtracking.com, which republishes COVID data from the State. Additionally, the case totals do not reflect the number of people who have recovered, just those who have been infected. In early June the State changed how it reports its data on the website, making data more accurate in the long-term but more complicated to track as well. The State regularly updates older data and as we continue to publish regular updates on COVID the State’s changes to past data many not always be reflected in our posts. The data published in new posts is accurate for the day we received it on though.
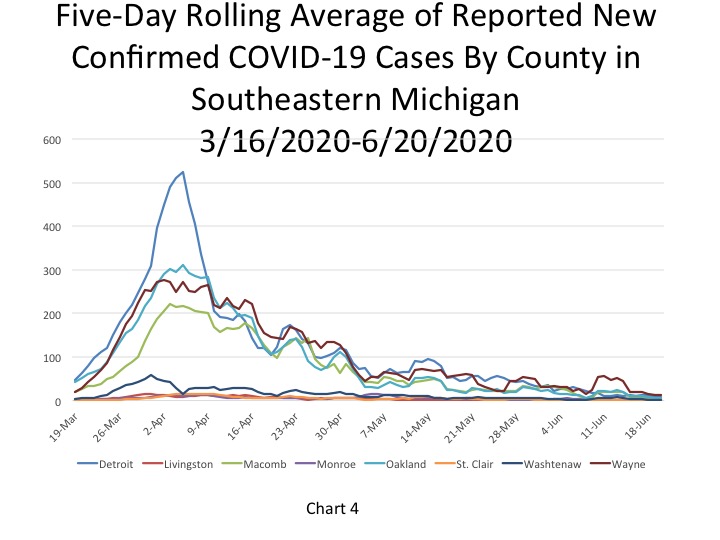
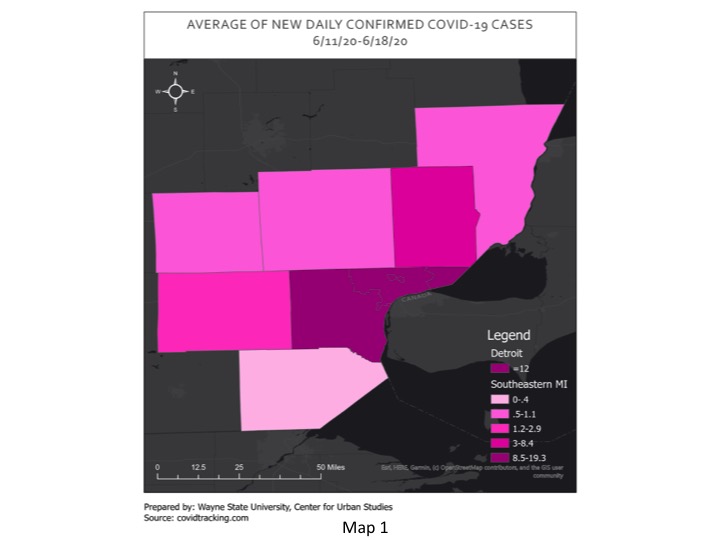
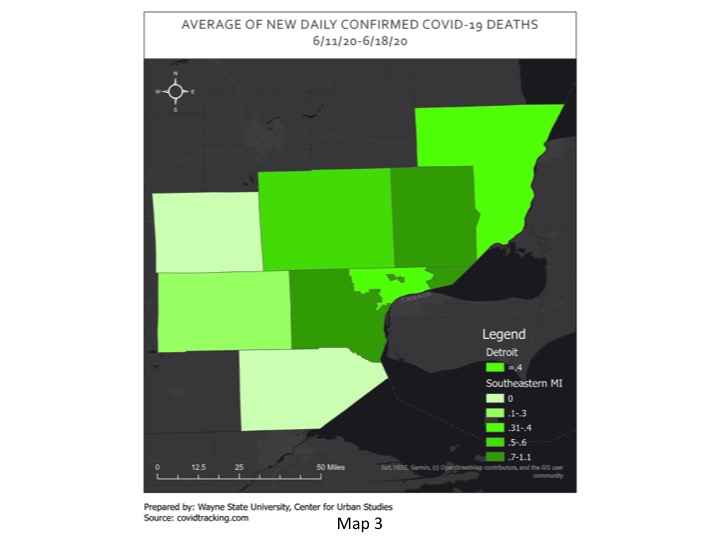
Chart 4 shows that Wayne County reported the highest number of daily cases, according to the five-day rolling average, at 13 on June 20. Detroit reported 8 new daily cases while Oakland County reported 6 and Macomb County reported 3. As Map 1 shows, Detroit and Wayne and Macomb counties all reported a lower number of new daily cases on June 20 than what the average was for last week (June 11-18). For example, last week Detroit averaged 12 new COVID cases and on June 20 it reported 8. Oakland County though had an average of 0.6 new cases last week and reported 6 new cases on June 20 through 5-day rolling average calculations. So, while there are signs the number of new cases are declining regionally, the data also shows that nowhere is immune from having its numbers increase again.
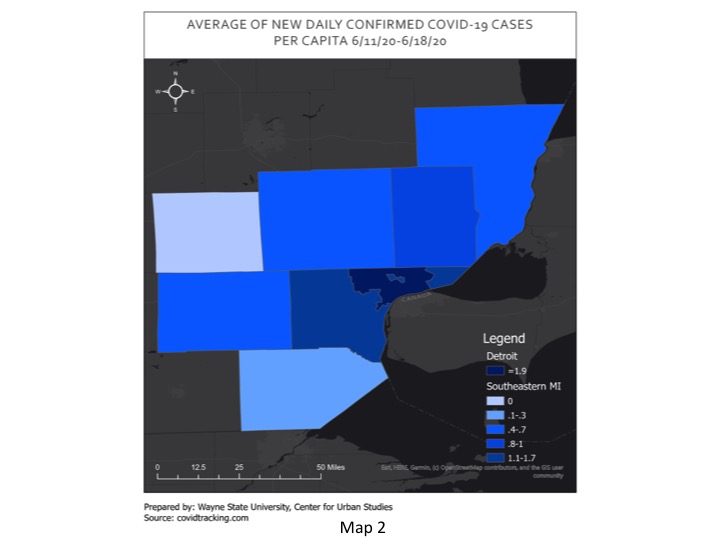
On June 22, the per capita rate for the number of new daily COVID cases per 100,000 people was 2 for the State, which was equivalent to 179 new cases. On June 22, Detroit and Monroe and Washtenaw counties all reported the same per capita rate for the number of new daily COVID cases per 100,000 people as the State-2. Detroit’s per capita rate of 2 was equivalent to 13 new cases per 100,000 people, based on an actual number of cases. St. Clair County reported a per capita rate of 3 and the remaining counties all reported per capita rates of 1. Wayne County’s per capita rate of 1 was equivalent to 22 new cases, the highest in the region that day. The second map below (Map 2) shows that while Detroit’s per capita rate on June 22 is on par with its average rate for the number of new daily COVID cases per 100,000 people for the week of June 11-18, St. Clair County is experiencing higher numbers this week than last. St. Clair County had a per capita rate of 3 on June 22 and an average per capita rate of 0.8 last week.
Chart 4 shows that Wayne County reported the highest number of daily cases, according to the five-day rolling average, at 13 on June 20. Detroit reported 8 new daily cases while Oakland County reported 6 and Macomb County reported 3. As Map 1 shows, Detroit and Wayne and Macomb counties all reported a lower number of new daily cases on June 20 than what the average was for last week (June 11-18). For example, last week Detroit averaged 12 new COVID cases and on June 20 it reported 8. Oakland County though had an average of 0.6 new cases last week and reported 6 new cases on June 20 through 5-day rolling average calculations. So, while there are signs the number of new cases are declining regionally, the data also shows that nowhere is immune from having its numbers increase again.
On June 22, the per capita rate for the number of new daily COVID cases per 100,000 people was 2 for the State, which was equivalent to 179 new cases. On June 22, Detroit and Monroe and Washtenaw counties all reported the same per capita rate for the number of new daily COVID cases per 100,000 people as the State-2. Detroit’s per capita rate of 2 was equivalent to 13 new cases per 100,000 people, based on an actual number of cases. St. Clair County reported a per capita rate of 3 and the remaining counties all reported per capita rates of 1. Wayne County’s per capita rate of 1 was equivalent to 22 new cases, the highest in the region that day. The second map below (Map 2) shows that while Detroit’s per capita rate on June 22 is on par with its average rate for the number of new daily COVID cases per 100,000 people for the week of June 11-18, St. Clair County is experiencing higher numbers this week than last. St. Clair County had a per capita rate of 3 on June 22 and an average per capita rate of 0.8 last week.
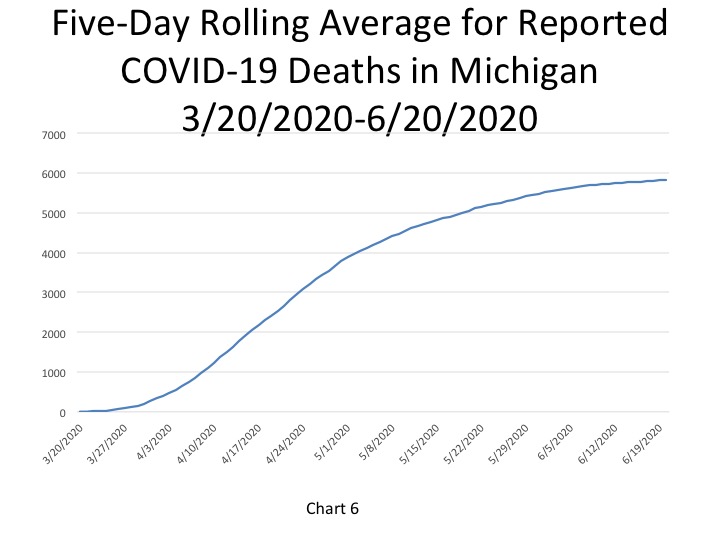
In Chart 6, the five-day rolling average for the number of deaths in Michigan shows how they have leveled off during the month of June. On June 20 there were 5,837 deaths (an increase of 12 deaths from the day prior). The actual cumulative COVID-19 deaths on June 22 was 5,853, an increase of 7 deaths from the prior day. Of those deaths that occurred, 4 were in Southeastern Michigan.
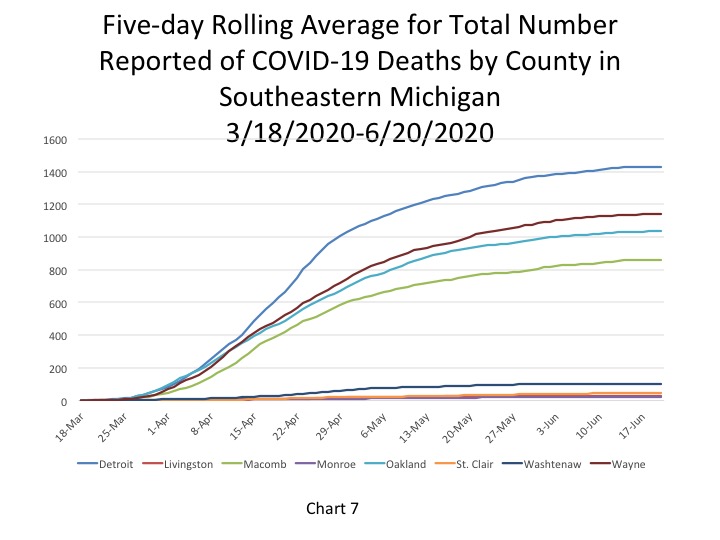
Chart 7 (a 5-day rolling average) further reflects how the number of deaths has leveled off in the State and Southeastern Michigan. On June 20 the City of Detroit reported 1,428 deaths, and while it is still the highest number in the region, that number has only increased by 25 total deaths since June 8. Wayne County had the second highest total at 1,141 deaths on June 20; Wayne County had 1,120 deaths on June 8.
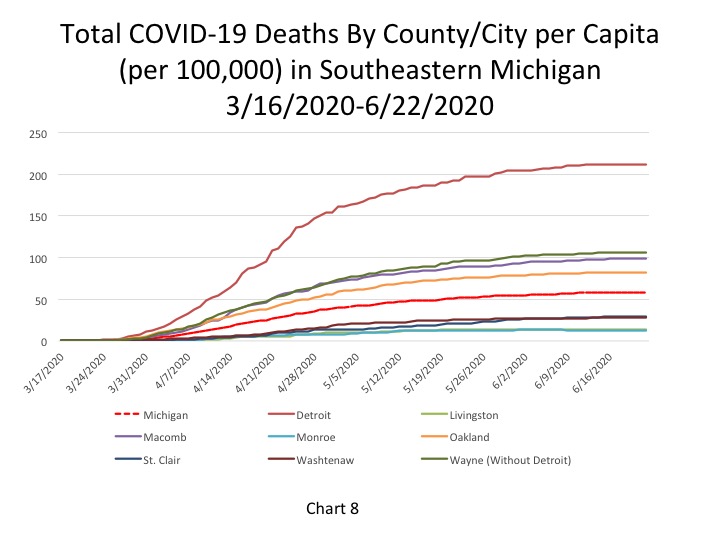
The per capita rates for the number of total COVID deaths in Southeastern Michigan remained the same for each entity on June 22; these rates have all remained the same since June 14. Detroit reported 212 total COVID deaths per 100,000 people (1,428 deaths), Wayne County reported a per capita rate of 106 (1,143 deaths), Macomb County reported a per capita rate of 99 (862 deaths) and Oakland County reported a per capita rate of 82 (1,037 deaths).
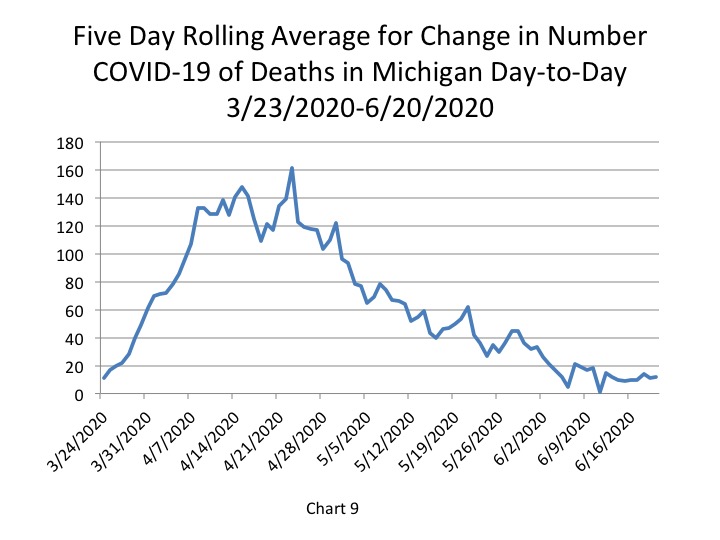
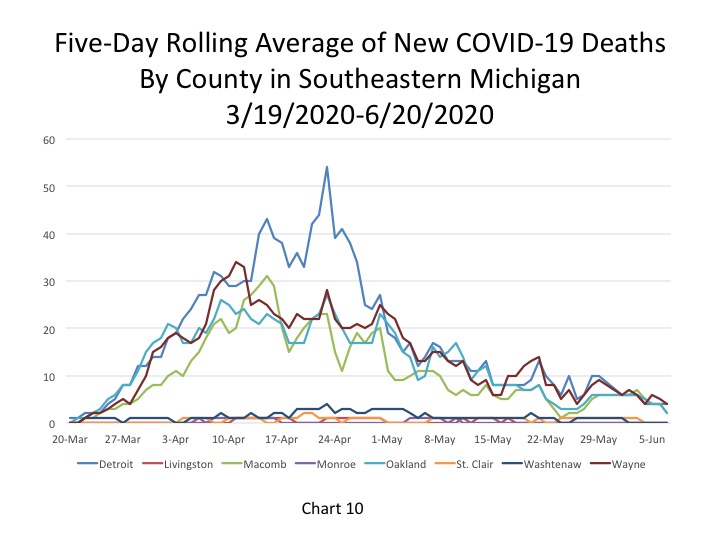
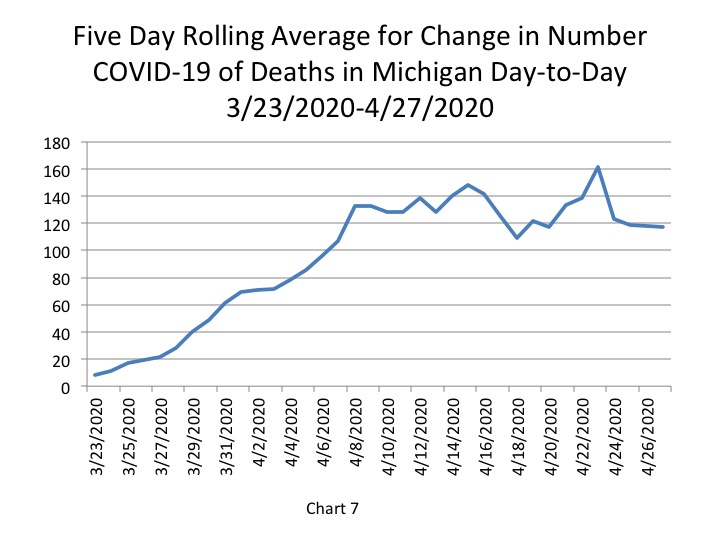
Chart 9, the five day rolling average of deaths, shows the number of new statewide deaths was reported at 12 on June 20, an increase from the 11 new deaths reported the day before. While the number new statewide deaths did slightly increase on June 20, the overall number has not gone above 18 since June 10. In mid-April the number of new deaths in Michigan reached a peak at 145. Furthermore, Chart 10 shows how the number of deaths in Southeastern Michigan continues to decline, a trend we are eager to see continue. Oakland and Wayne counties each reported 1 new death, the highest in the region. These numbers are based on 5-day rolling averages. As the map below shows, Detroit and each county in the region experienced a decrease in the number of deaths from June 20 and the average number of deaths last week. Wayne County had the highest average number of deaths from the week of June 11 to 18 at 1.1, and on June 20 it was reported at 1. Detroit averaged 0.4 deaths last week and reported 0 new deaths on June 20.
While we know that the number of COVID cases and deaths has decreased throughout the month of June we also continue to see spikes in new cases periodically in different areas throughout the State. For example, note how majority of the number of new cases reported in Michigan on June 22 were from outside the State’s most populate region. Additionally, Southeastern Michigan has been the last area in the State to loosen restrictions. Overall, Michigan has experienced a recent uptick in the number of new cases. According to Mlive, the seven average for new COVID cases this week is 192 and last week it was 152. So, while the data shows that the curve has certainly flattened it also reflects how abiding by health recommendations set forth by the Centers for Disease Control plays a large role in flattening that curve.
According to the State of Michigan, the
total number of COVID cases in Michigan rose above 40,000 on April 29, bringing
the new total to 40,399, an increase of 1,137 cases from the previous day. This
total was equivalent to 404.5 cases per
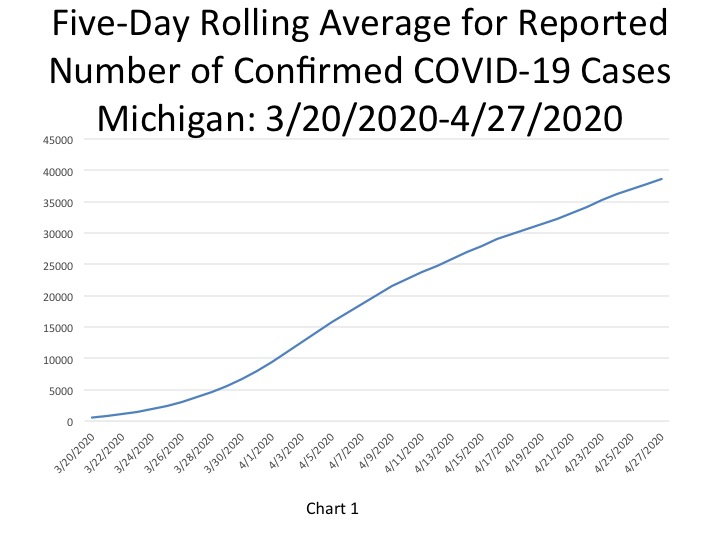
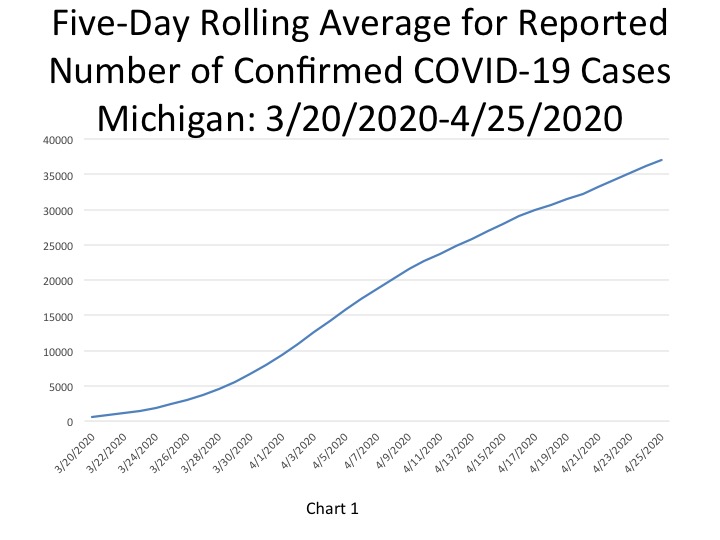
100,000 people (Chart 4) on April 29. The five-day rolling average for the
total number of COVID cases (Chart 1) reflects a smoother curve and adjusts for
fluctuations in testing or the quality of reporting or failure to report. The
five day rolling average means our daily
case and death charts lags two days behind. Based on this approach, the COVID
cases increased to 38,570.
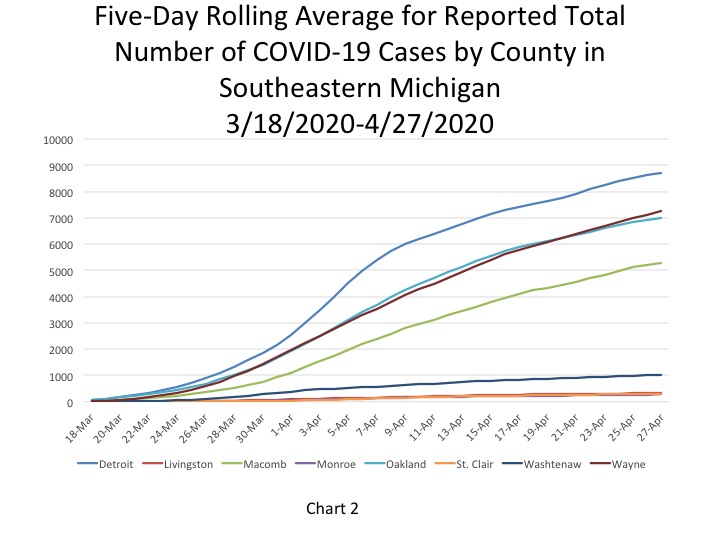
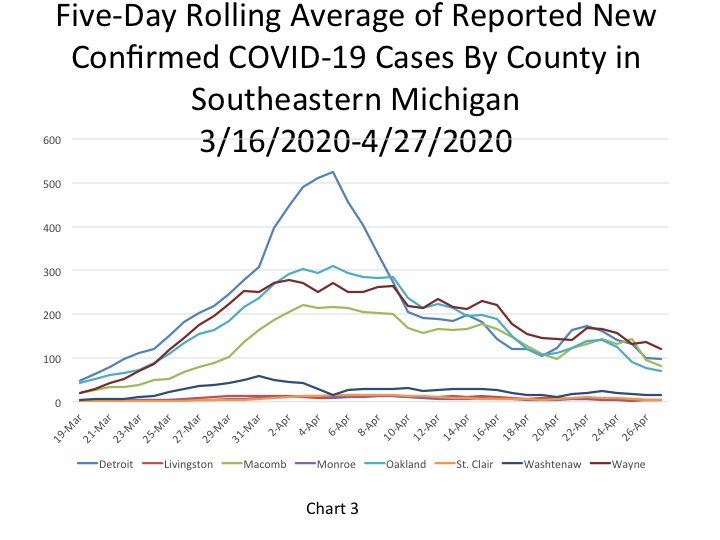
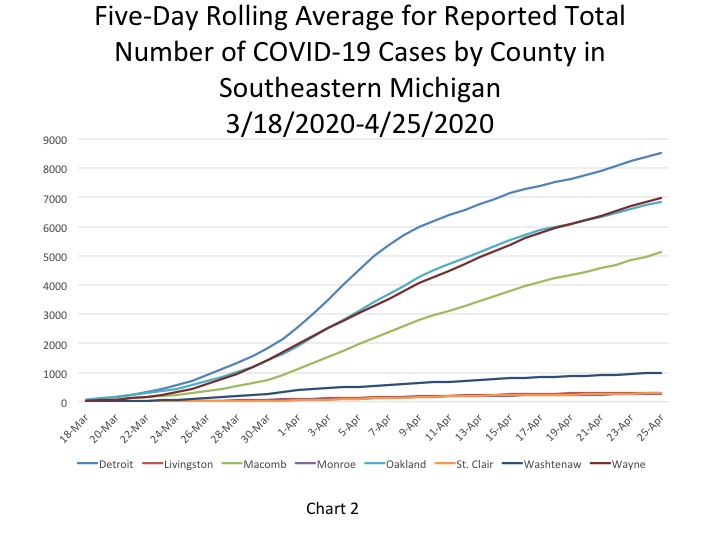
In Chart 2, which reflects the five-day
rolling averages at the County level and for the City of Detroit, we continue to see Detroit and Wayne County
having the highest number of cases at 8,722 and 7,245 on April 27,
respectively. Those case numbers appear
to be increasing at a higher rate than those in Oakland and Macomb counties,
which were recorded at 6,979 and 5,291, respectively on April 27. Additionally,
we have yet to see slower rate of increase in the number of cases at the State
level and in Detroit, Wayne, Oakland and Macomb counties.
We continue to see both an overall and
recent decline in the number of new daily COVID cases in Chart 3. While the
number of new reported cases is reliant on testing for the virus, there is hope
that the decrease in new cases reflects a slower spread of the virus.
The daily data highlighted in these posts is from Michigan.gov/coronavirus, where data is updated daily at 3 p.m. Historical data was supplied from covidtracking.com, which republishes COVID data from the State.
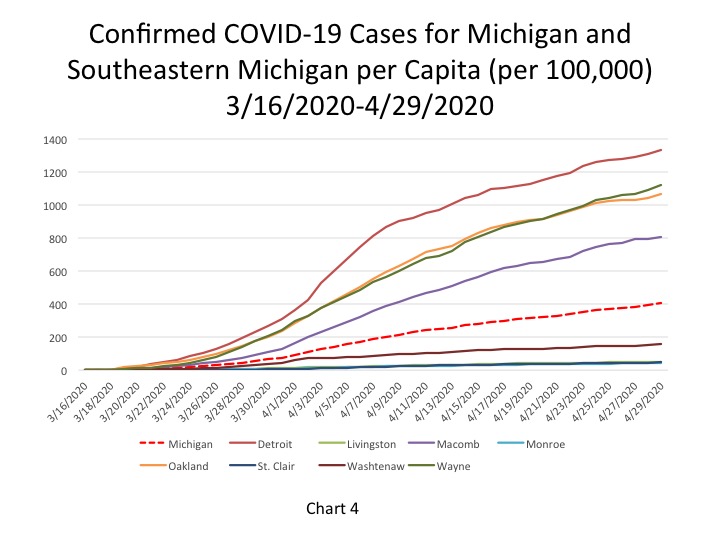
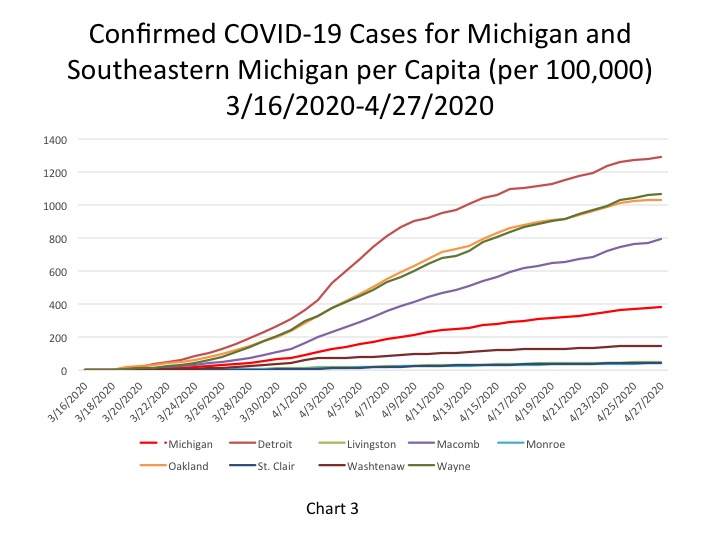
The City of Detroit had 1,332 COVID cases per 100,000 people on April 29, an increase from 1,310 the day before (Chart 4). This is based upon a reported increase of 146 new cases, bringing the total number of COVID cases in Detroit to 8,957. Wayne County reported 1,120 cases per 100,000 people, and Oakland County had 1,064 cases per 100,000. These April 29 per capita rates were based upon 7,537 cases for Wayne and 7,159 for Oakland. Macomb County reported 807 cases per 100,000 people, which is based upon 5,430 cases.
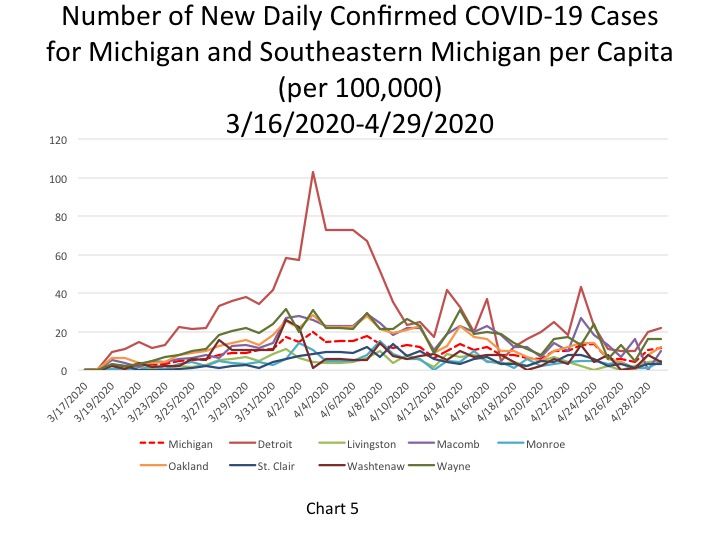
Chart 5 shows that Detroit and Wayne County had the highest number of new COVID cases per 100,000 people on April 29. Detroit had 22 new COVID cases on April 29 per 100,000, which was equivalent to 146 new cases, and Wayne County continued to have 16 new cases per 100,000 people (the same rate as the day before) which was equivalent to 175 new cases. This chart also shows that Oakland County’s per capita rate of new COVID cases per 100,000 people rose above the State’s rate on April 29. Oakland County’s rate was 12 new COVID cases per 100,000 people, which was equivalent to 147 new cases, and Michigan’s rate was 11.4 new COVID cases per day. The State’s per capita rate was equivalent to 1,137 new cases per day.
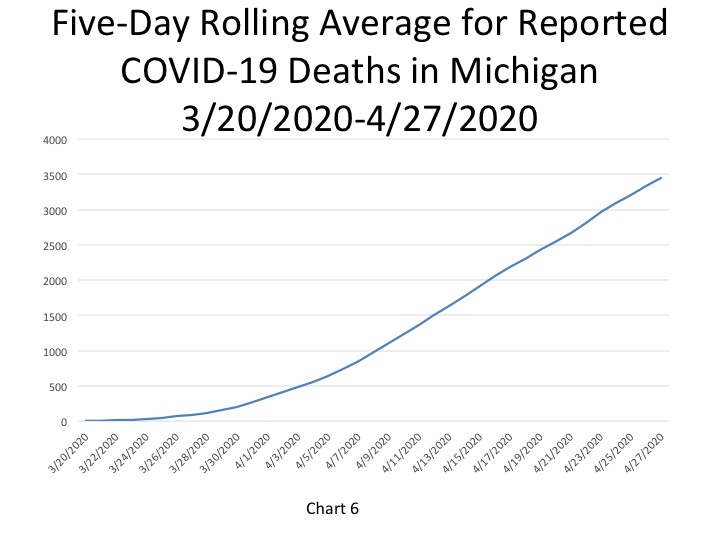
In Chart 6 the five-day rolling
average for the number of deaths shows a continuing steady increase (a lagged
number of 3,446 deaths, an increase of 117 deaths). The actual reported COVID-19
deaths reached 3,670 on April 29,
an
increase of 103 deaths from the day prior.
Chart 7, a five-day rolling average chart, shows how the new data reflects
another decline in the number of additional deaths statewide.
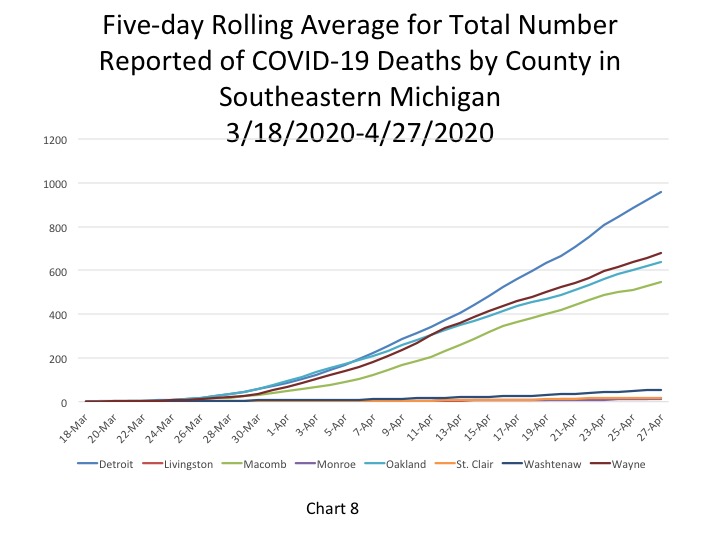
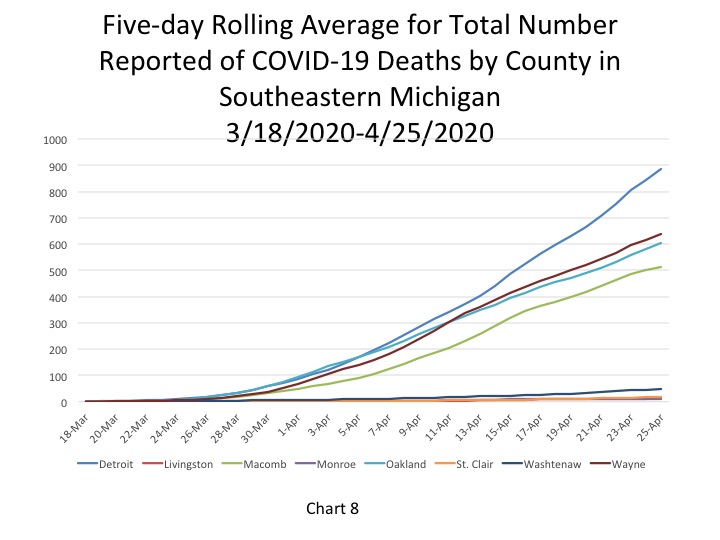
Chart 8, a five-day rolling average
for the number of COVID deaths by each county, shows how Detroit continues to
pull farther away from the other units in Southeastern Michigan when looking at
the total number of COVID deaths. Wayne County, which has the second highest
number of deaths, and Oakland County follow a similar pattern in COVID death
totals and remain close in their numbers. Macomb County consistently has the
fourth highest total number of deaths and its rate of increase appears to have
experienced an uptick since mid-April.
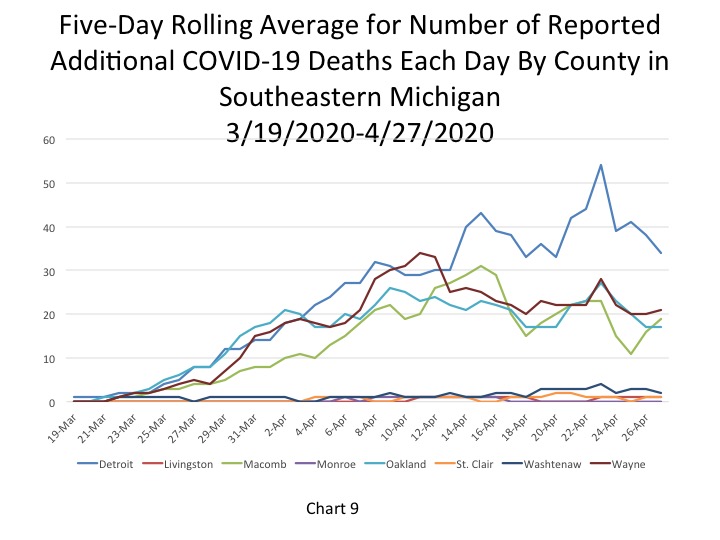
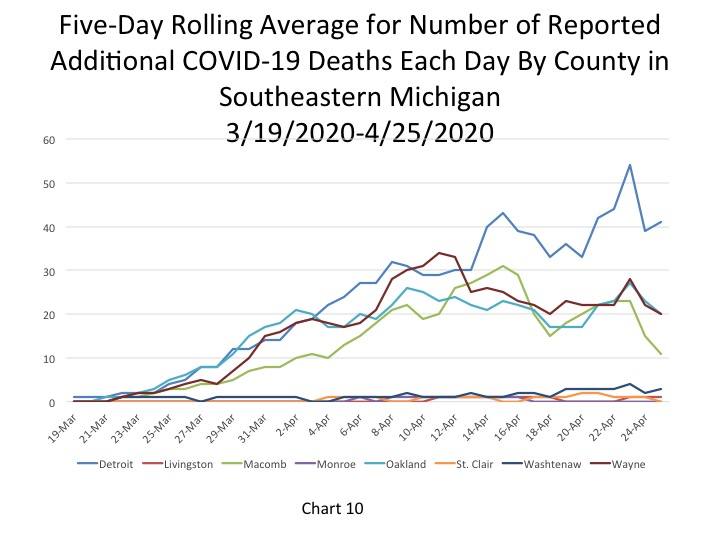
Chart 9 shows how Detroit’s numbers
of additional deaths have been declining, which is likely part of the cause of
the decline at the state level. The same pattern is occurring in Oakland County’s counts of additional
deaths. The number of daily deaths in
Macomb County has been increasing over the last several days though.
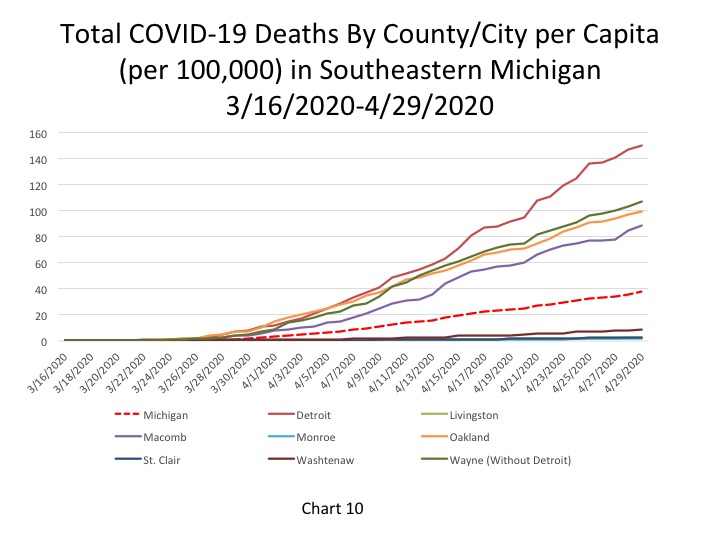
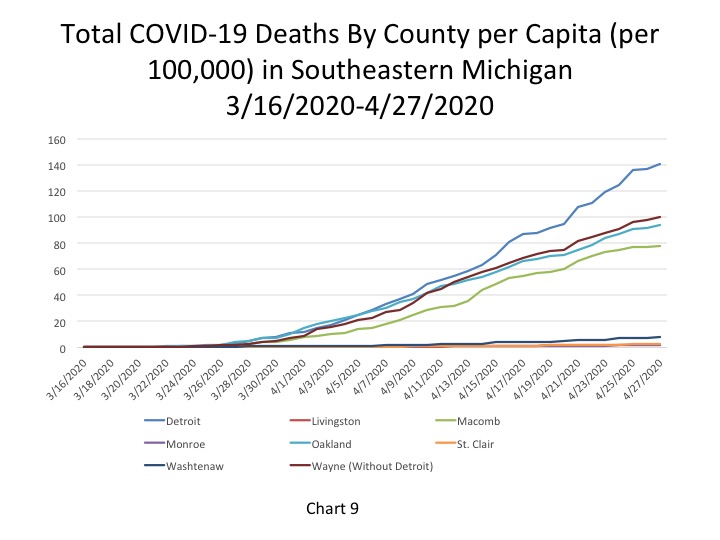
Chart 10 represents the total number of COVID deaths per 100,000 people. For Detroit on April 29 there were 150 COVID deaths per 100,000 people (representing 1,008 deaths). In Wayne County there were 107 COVID deaths per 100,000 people (719 total deaths), in Oakland County there were 99 deaths per 100,000 people (668 total deaths), and in Macomb County there were 89 COVID deaths per 1000,000 people on April 29 (597 total). The State of Michigan had 38 COVID deaths per 100,000 people, a rate which was lower than the four entities discussed above. Wayne and Macomb counties both reported 25 new deaths on April 29; Detroit had 20.
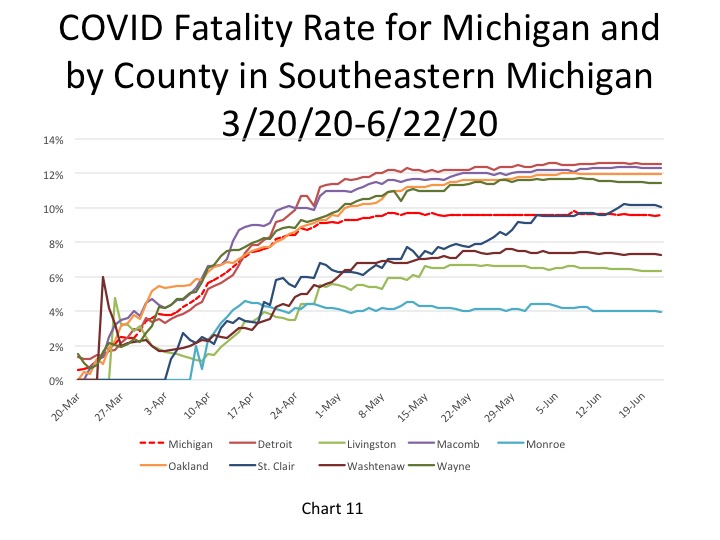
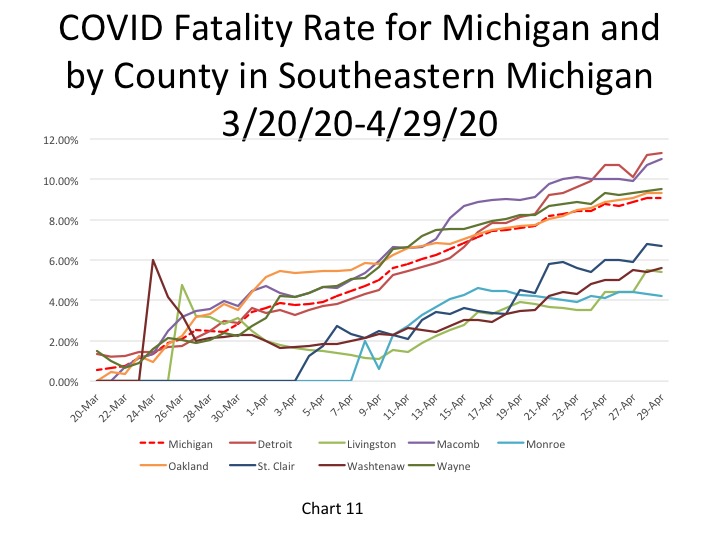
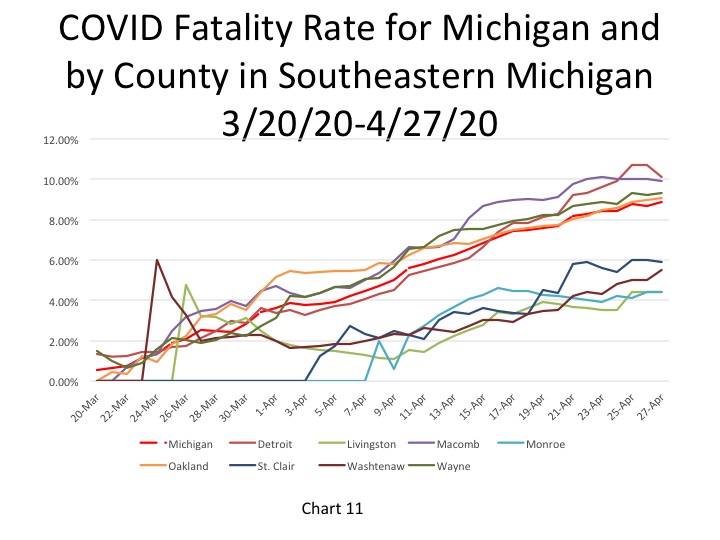
The fatality rate in the City of the Detroit increased to 11.3 percent on April 29, which is higher than the State’s fatality rate (9.1 percent) and the rates of the counties in Southeastern Michigan. The fatality rate in Macomb County continued to increase on April 29, reaching 11 percent for the first time. The fatality rate in Monroe County continued to decline.
The total number of deaths in Detroit surpassed 1,000 on April 29, accounting for 27% of the 3,670 deaths in the State. So, while the number of daily deaths in Detroit has been declining in recent days, it’s clear the overall impact of the virus continues to hit Detroit hard. Detroit has experienced the largest decline in the number of additional COVID deaths in recent days, which could be a cautious sign of hope.
According to the State of Michigan, the
total number of COVID cases in Michigan increased to 38,210
on April 27, which was an increase of 432 cases from the previous day. This
total was equivalent to 382
cases per
100,000 people
(Chart 3) on
April 27.
The five-day rolling average for the total number of (Chart 1) reflects a
smoother curve and adjusts for fluctuations in testing or the
quality of reporting or failure to report. The five day rolling average means our daily case and death charts will lag two
days behind. The COVID cases
increased to 37,025,
based on this approach. Even with the smoothing, however, there is no decline.
Chart 2 reflects the five-day rolling
averages at the County level and for the City of Detroit. As was shown in Chart
2, Detroit continues to have the highest number of confirmed cases, recorded at
8,526 on April 25. The number of cases
in Wayne County increased to 6,988 for a five-day rolling average on April 25
while in Oakland County the number of cases increased to 6,832 and in Macomb
County it increased to 5,114.
The City of Detroit showed total COVID
per capita cases of 1,289 per 100,000 people on April 27, an increase from
1,280 the day before (Chart 3); this represents a reported increase of 66 new
cases. Wayne County reported 1,069 cases per 100,000 people, and Macomb County
had 795 cases per 100,000. The per capita rate in Oakland County dropped to
1,028 cases per 100,000 people, when it was 1,030 the day prior. This is a
result of the State reporting a decrease in the total number of cases between
April 26 and 27. This is likely a lapse in reporting reflected in Chart 3, Chart 4 and Chart 5. Macomb
County had the highest per capita increase between April 26 and April 27 at 22
new cases per 100,000 people.
The daily data highlighted in these posts is from Michigan.gov/coronavirus, where data is updated daily at 3 p.m. Historical data was supplied from covidtracking.com, which republishes COVID data from the State.
As noted, Chart 4 shows that Oakland
County had 0 new cases reported on April 27; this is due to the State reporting
a decreased number of cases between April 26 and 27. To reflect this we show no
new cases being reported on April 27 for Oakland County. (We’ll be checking on
this number.) Macomb County reported the highest number of new COVID cases on
April 27 at 142, Detroit reported 66, and Wayne County reported 58.
Chart 5 again shows that Macomb County had the highest increase in the number of new COVID cases between April 26 and April 27. On April 27 Macomb County reported 16 new COVID cases per 100,000 people; that County reported 7 new COVID cases per 100,000 on April 26. In Detroit there were 10 new COVID cases per 100,000 people from April 26 to April 27. In Wayne County there were 5 new COVID cases per 100,000 people on April 27 compared to 13 on April 26.
In Chart 6 the five-day rolling
average for the number of deaths shows a continuing steady increase (a lagged
number of 3,212 deaths, an increase of 119 deaths). The actual reported COVID-19
deaths reached 3,407 on April 27, an increase of 92 deaths from the day prior
(Chart 7).
Breaking down the five-day rolling
average of COVID deaths, Detroit still has a far higher rate of increase than
the other units. Wayne County is second, followed by Oakland and Macomb
counties. Each county but Monroe and St. Clair experienced an increase in the
total number of deaths. These increases continue to be represented in Charts 9
and 10.
Chart 9 represents the total number of
COVID deaths per 100,000 people. For Detroit on April 27 there were 141 COVID
deaths per 100,000 people (equivalent to 950 deaths). In Wayne County there
were 100 COVID deaths per 100,000 people (672 total deaths), in Oakland County
there were 94 deaths per 100,000 people (631 total deaths) and in Macomb County
there were 78 COVID deaths per 1000,000 people on April 27 (672 total).
Detroit, Macomb, Oakland, Washtenaw and Wayne counties all experienced a small
increase in the number of new deaths, with Detroit experiencing an increase of
28 and Wayne County experiencing an increase of 14.
Chart 10 shows the five-day rolling average for the number of new COVID deaths, Here we see a number of counties showing a decline in additional deaths, a good sign if this trend continues.
Notably in Chart 11 we see that the fatality rate in Detroit on April 27 decreased from 10.7 percent to 10.1 percent. The data also shows that the fatality rate in Macomb County is slowly decreasing. Just last week it was the highest in the region and now it has decreased below Detroit’s rate and from its peak of 10.1 percent to 9.9 percent. The State’s fatality rate on April 27 was 8.9 percent, a small decrease from the fatality rate the day prior. These declines may represent real changes or simply an increase in testing (the denominator here).
It appears as though the number of deaths is slowing, however we also know that the State releases additional COVID death numbers through another method of confirmation sporadically throughout the week. Such data releases could reveal that we are not slowing the spread and impact of the virus as much as we think. The Governor did note yesterday that they believe there is a plateauing in the number of cases and deaths in the State.
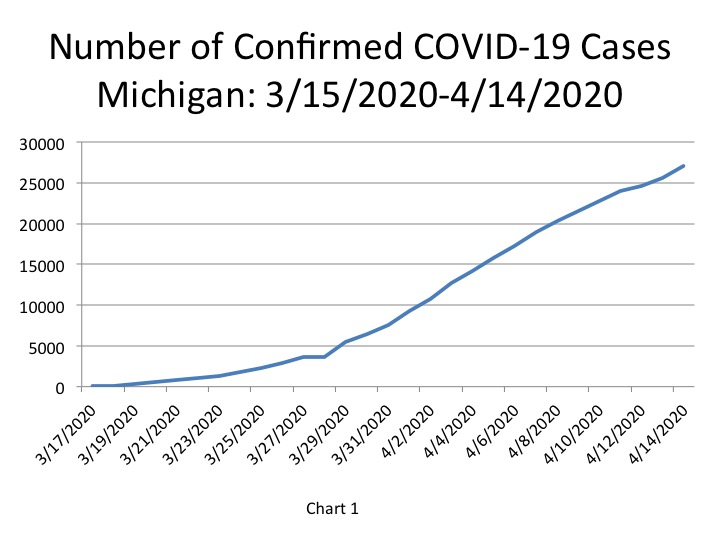
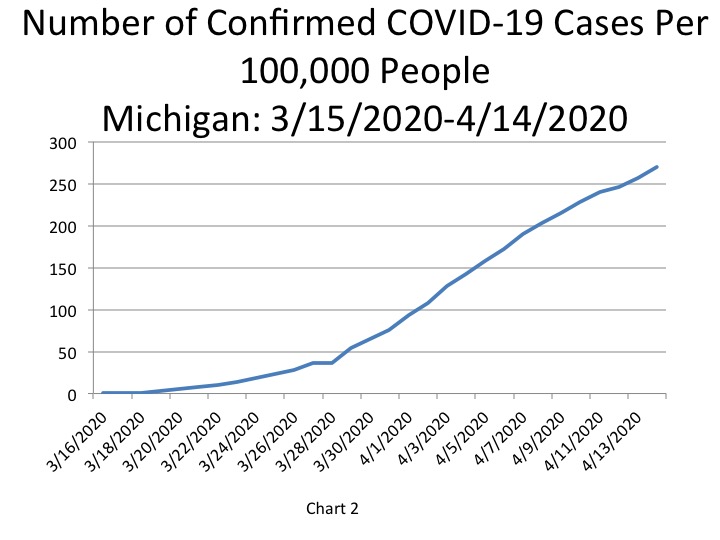
The total number of COVID cases
in Michigan increased
to 27,001 (Chart 1), which was equivalent to 270 cases per 100,000 people
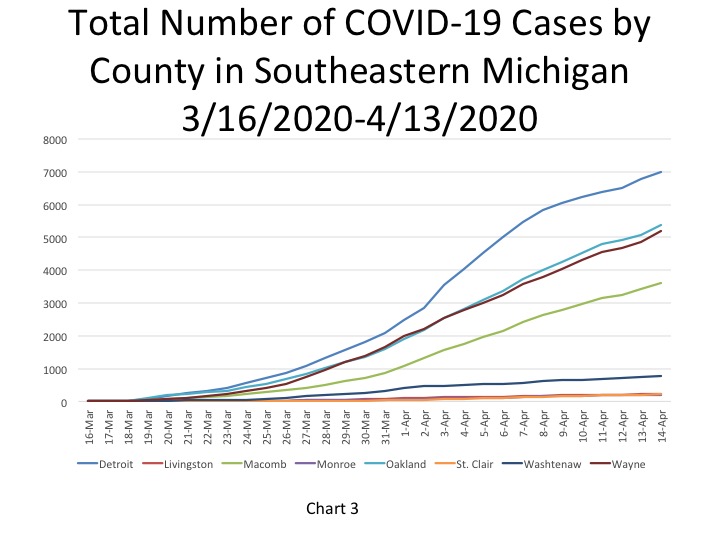
(Chart 2) on April 14. Of those total COVID cases, the City of Detroit had
7,004 cases, Oakland County had 5,364 cases, Wayne County (excluding Detroit)
had 5,002 cases and Macomb County had 3,620 cases (Chart 3). The number of confirmed cases in Washtenaw,
Livingston, Monroe and St. Clair counties combined totaled 1,471, with
Washtenaw County accounting for 772 of those cases, according to the most recent data from the
State.
The daily data highlighted in these posts is from Michigan.gov/coronavirus. Historical data was supplied from covidtracking.com, which republishes COVID data from the State.
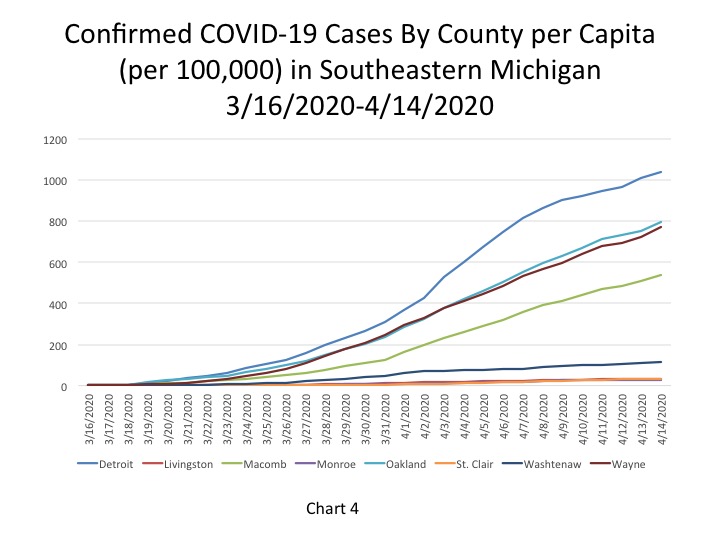
In Chart 4 we see that the City of
Detroit has consistently had the highest number of COVID cases per 100,000
people, which was a rate of 1,004 on April 14. Oakland County had the second
highest rate at 797 cases per 100,000 people and Wayne County (excluding
Detroit) had 774 cases. Macomb County had 538 COVID cases per 100,000 people.
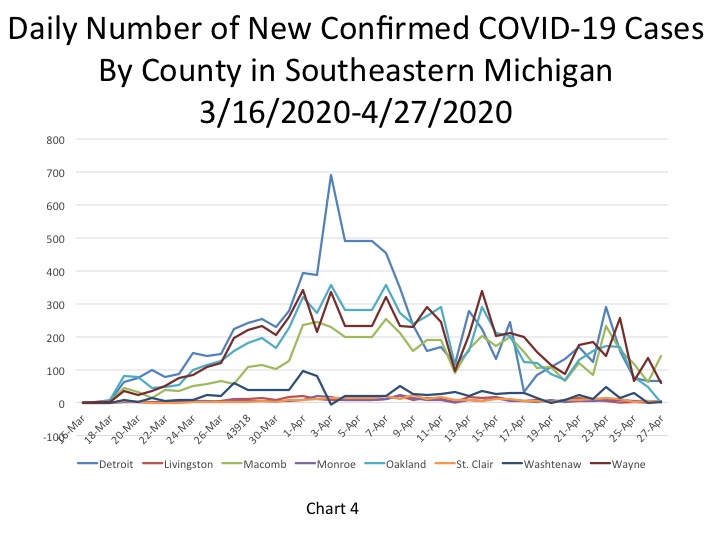
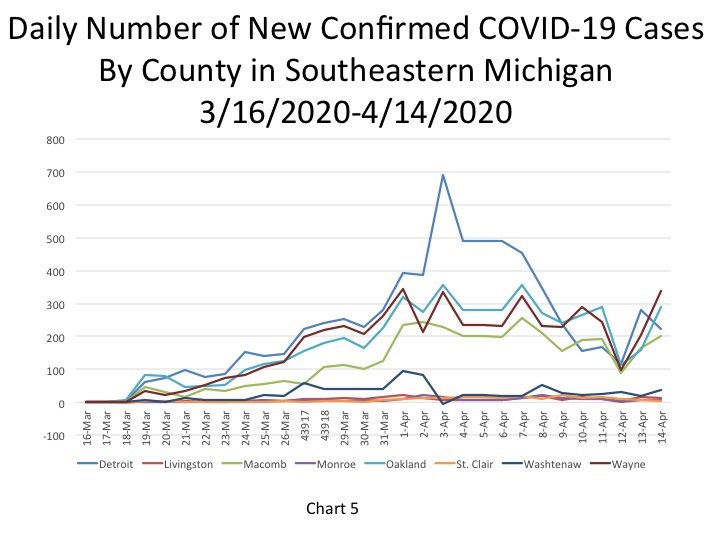
Chart 5 shows that Detroit experienced a
decrease in the number of new daily confirmed cases from April 13 to April 14
while Wayne, Oakland and Macomb experienced increases. Wayne County had the
highest number of new cases on April 14 at 338, followed by Oakland County with
291 new cases. Detroit reported 223 new
cases on April 14, a decrease from the 279 new COVID cases reported on April
13. Macomb County reported 202 new cases on April 14.
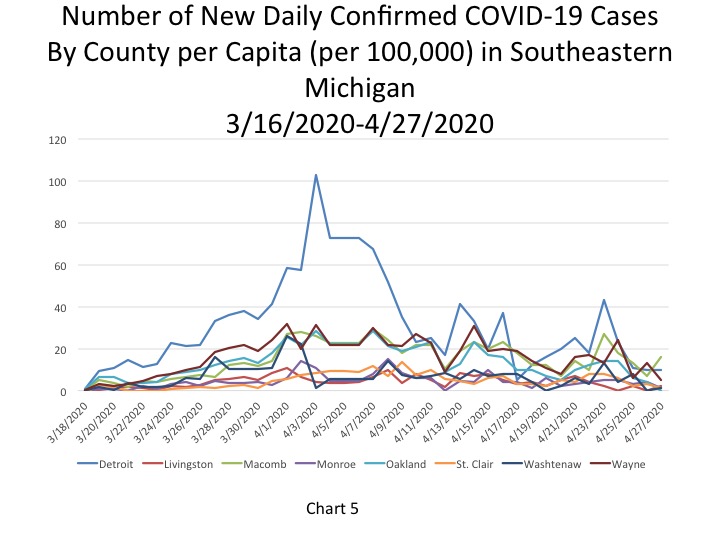
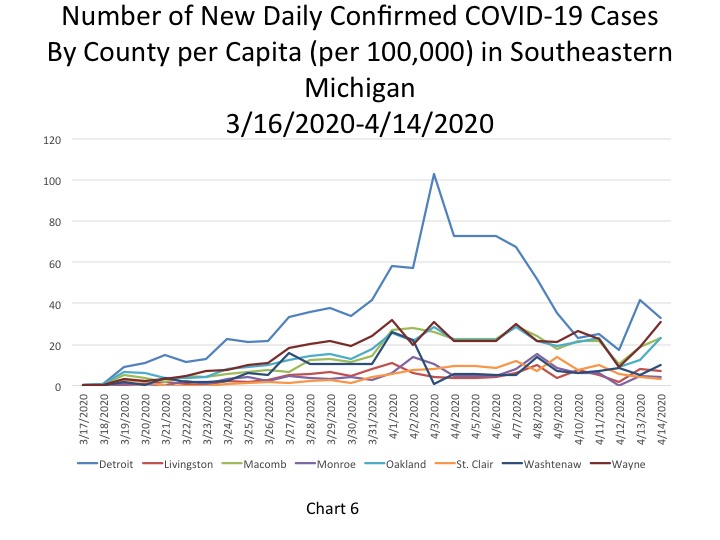
When looking at new COVID cases on a per capita basis, the data shows that Detroit continues to have the highest rates (Chart 6). According to the data, on April 14 Detroit had 33 new COVID cases per 100,000 people and Wayne County had 31. Oakland and Macomb counties each had 23 new COVID cases per 100,000 people on April 14.
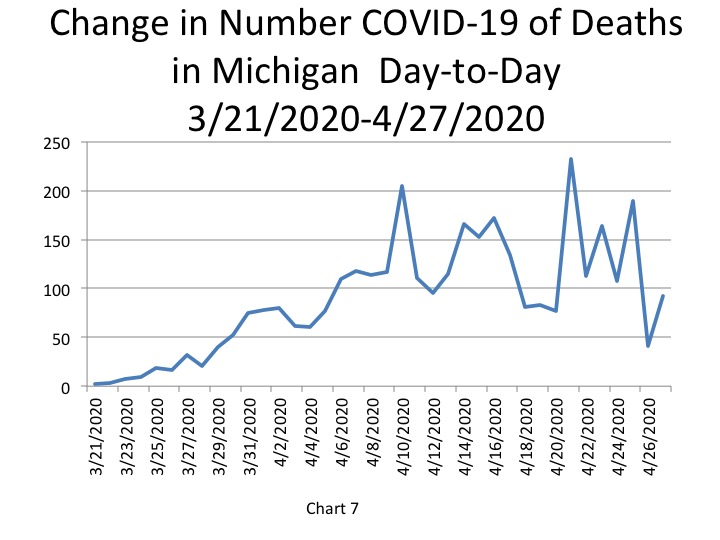
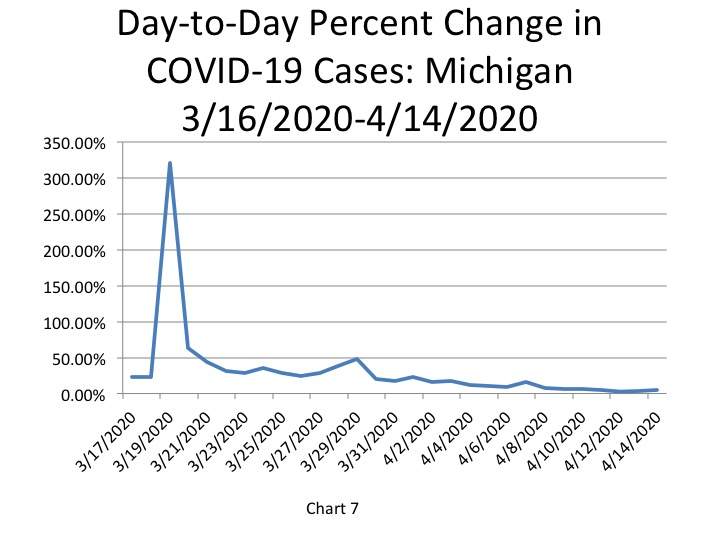
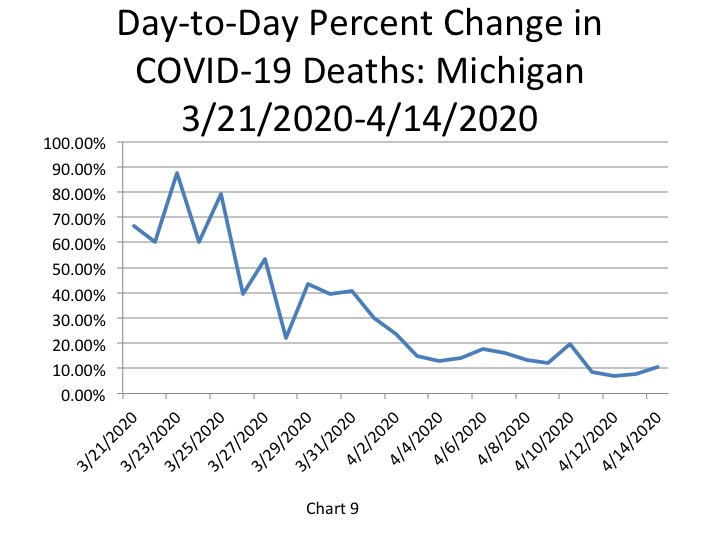
In addition to the raw data of confirmed cases, we also show the percent change in the number of cases reported day-to-day. For Michigan, the largest percent change thus far reported was on March 19 at 320 percent-this increase was also likely related to an increase in the number of available tests at that time. On April 14 the percent change from April 13 was 5.33 percent, an increase from the day’s prior change of 4 percent. Recall that the state has reported that new tests are being implemented, so this increase could be a result of this. Test more; find more cases.
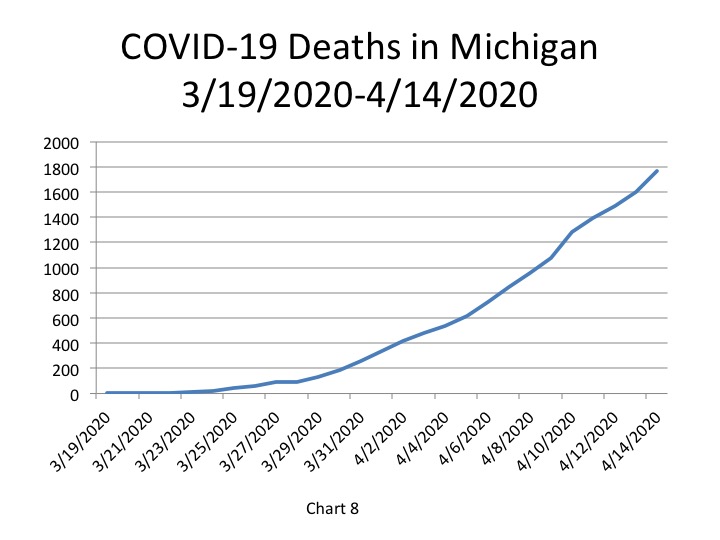
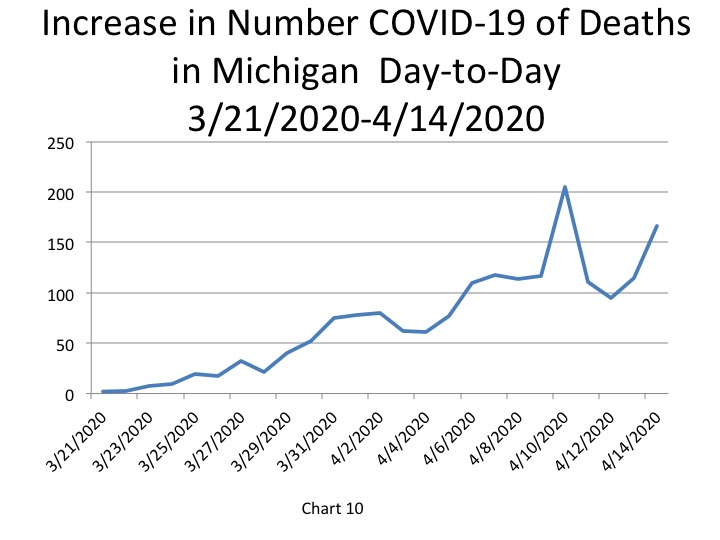
It was reported by the State of
Michigan that on April 14 the total of COVID-19 deaths reached 1,768. This was
a percent change of 10.4 percent from April 13, which was an increase from the
7.7 percent increase of the day prior (Chart 9). The 1,768 total deaths
reported for April 14 was 166 deaths higher than what was reported on April 13
(Chart 10). The new deaths reported on April 14 was the second day of
increases; both April 13 and April 14 had more than 100 new COVID deaths each
day.
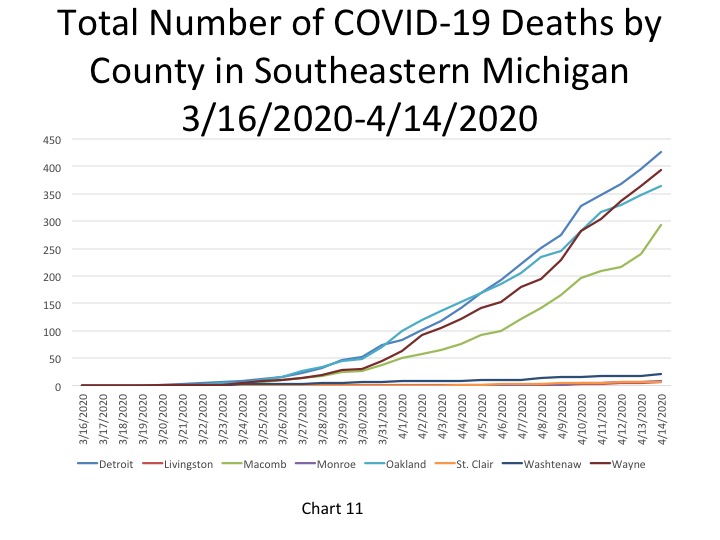
Of the total deaths reported, Detroit
continues to make up the majority of them. On April 14, the Michigan Department
of Health and Human
Services reported 427
total deaths in Detroit-the highest total number of deaths in one city or county
in the state. Wayne County, excluding Detroit, continued to have a higher
number of total deaths than Oakland County. On April 14 there were 393 COVID
deaths in Wayne County and 364 deaths in Oakland County (Chart 11). The data
shows that number of COVID deaths may be slowing in Oakland County, at least
compared to the rate of deaths in Wayne County.
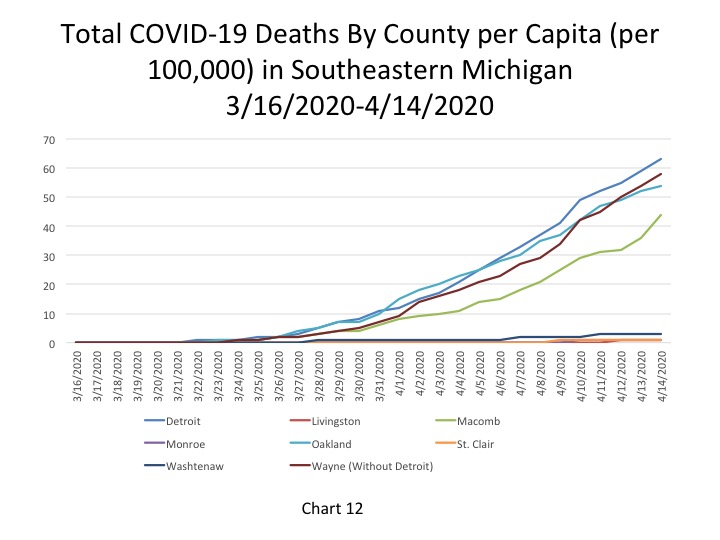
On a per capita basis, per 100,000
people, Detroit also continues to have the highest number of deaths per 100,000
people at 63 (Chart 12). The rate of
COVID deaths in Macomb County has increased by 12 in just the last two
days. On April 12 there 32 COVID deaths per 100,000 people in Macomb County and
on April 14 that had increased to 44.
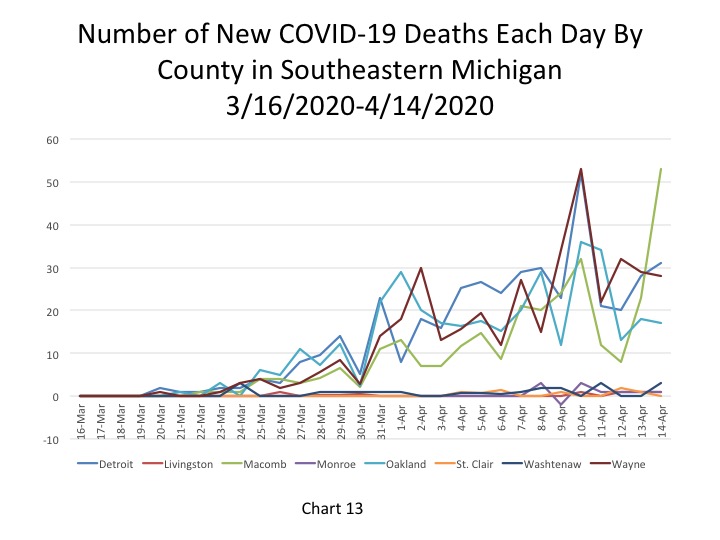
Macomb County also had the highest of new
daily COVID deaths for April 14 at 53; just two days prior (April 12) 8 deaths
were reported for Macomb County. In Detroit there were 31 new COVID deaths, a
continued increase since April 12. In Wayne County a decrease in the number of
new deaths continued with 28 being reported for April 14. Oakland County had 17
deaths on April 14.
Even though Detroit still has the highest total number of deaths, the increases in deaths in places such as Macomb County highlights that the virus is spreading out of the urban core and into the suburbs.
Despite some saying that Michigan is turning the corner, there is little evidence to this effect. Deaths, our strongest indicator, are still climbing steadily. Bridge Magazine cited Michigan as having the highest number of coronavirus deaths per capita and Deadline Detroit said Michigan has conducted the fewest number of tests per capita. Due to this gap in testing we may see the number of deaths per confirmed case be much greater than other states, and we anticipate that the number of confirmed cases may rise due to testing but the true infection rate may not be rising or rising as quickly. Gov. Gretchen Whitmer has recently authorized additional testing criteria and sites and many more will likely be getting tested.
According to Whitmer, all projections regarding the apex of the curve and when it will flatten are based on social distancing and as many people remaining home as possible. Now is not a time to loosen up on any restrictions you have been following.