Over the next four weeks we will be looking at the energy production and consumption of various states throughout the U.S. to highlight how energy is produced and our reliance on it for consumption. For this series we featured 15 different states, including Michigan. These state are:
- Michigan
- Illinois
- Iowa
- Indiana
- Minnesota
- Missouri
- Nebraska
- North Dakota
- Ohio
- South Dakota
- Wisconsin
- New York
- Georgia
- Oregon
- California
(If one of the above states is not colored in a map it means it produced zero energy for that source. The other 35 states are not highlighted though because they were not chosen for comparison; this does not mean they didn’t produce a source of energy).
These states were chosen either because of their proximity to Michigan, their similarity in size or because they represent a benchmark state with higher production and consumption of renewable energy sources.
In this series we show how Michigan compared to the featured states for energy production and consumption in 2013 (the most recent data from the U.S. Energy Information Administration) and, later, how each of these state’s consumption has changed between 2003 and 2013.
In this post we show how each state’s energy production, in trillion BTUs, differs by source. The production sources shown are: coal, natural gas, biofuels and other renewables (which include solar and wind power). Just because a state produces a certain energy source does not mean all of that energy created in the state is consumed there. For example, you will see in this post that Michigan, along with Iowa, Minnesota, South Dakota, Wisconsin, New York, Georgia, Oregon and California, do not produce coal as a form of energy, but each consume it (as will be seen next week).
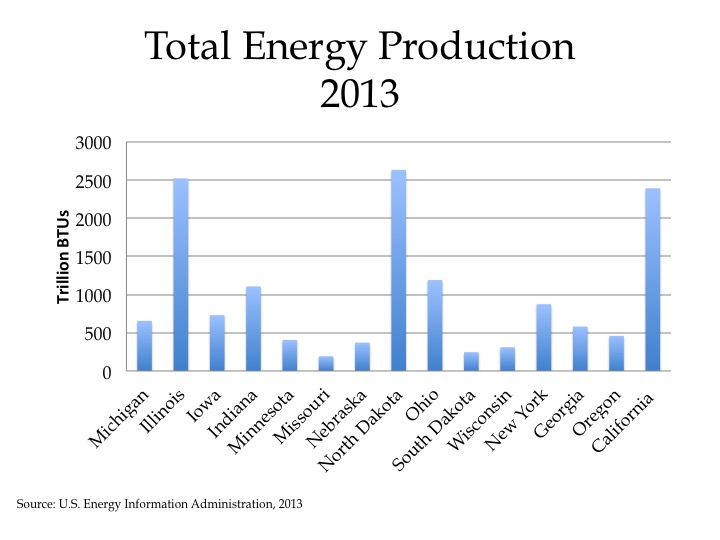
Of the 15 states highlighted in this series Michigan was not the top energy producer for any of the sources. On a national basis Michigan ranked 26th for energy production, producing .8 percent of the country’s energy. Of the 14 other states featured in this post, seven states produced more energy than Michigan did in 2013. North Dakota produced the highest amount of energy at 2,632.3 trillion BTUs, with crude oil being its primary production source. Missouri produced the least amount at 191.8 trillion BTUs.
(On a national basis, Texas produced 19.8 percent of the nation’s energy, giving it the highest level of energy production.)
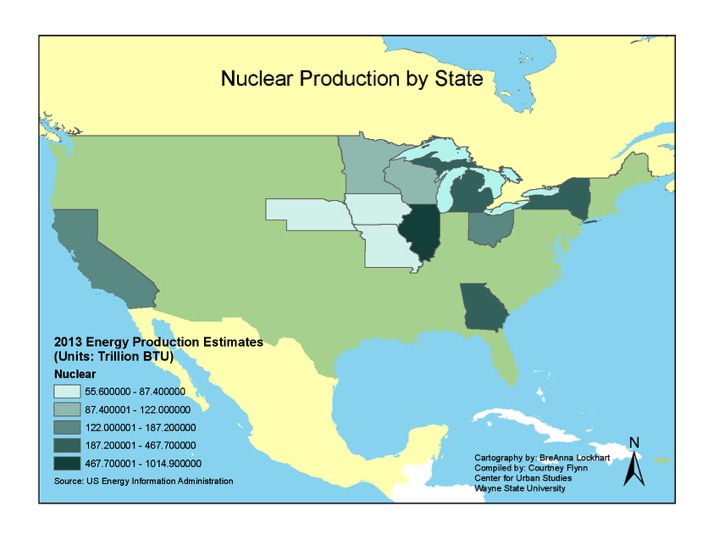
At 302.2 trillion BTUs in 2013, Michigan produced more nuclear energy than any other source of energy. Michigan has three operating nuclear power plants.
The only other featured states that produced a higher amount of nuclear energy in 2013 were Illinois (1014.9), New York (467.7), and Georgia (343.8). States that did not produce nuclear energy were Indiana, North Dakota and Oregon.
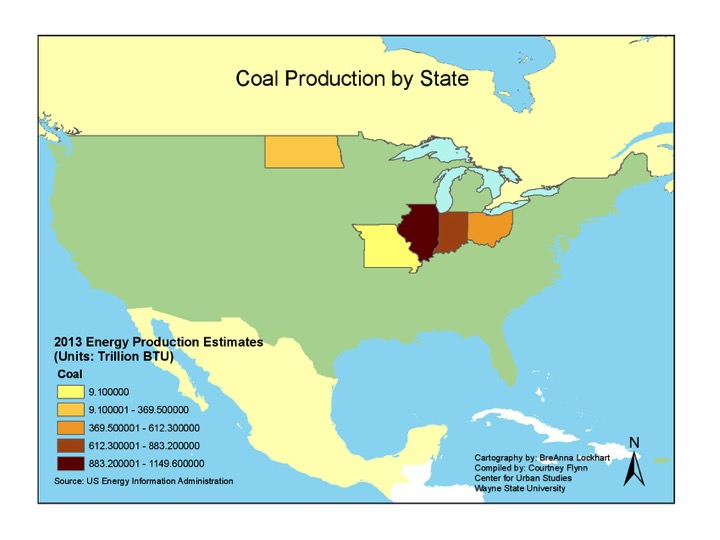
More trillion BTUs of coal powered energy were produced by the states featured in this post, and on an overall national basis, than any other source of energy. Interestingly enough though, 10 out of the 15 states featured didn’t produce coal-based energy. Of the five states that did produce coal powered energy though, Illinois produced the highest amount in 2013 at 1149.6 trillion BTUs; Indiana followed at 883.3 trillion BTUs.
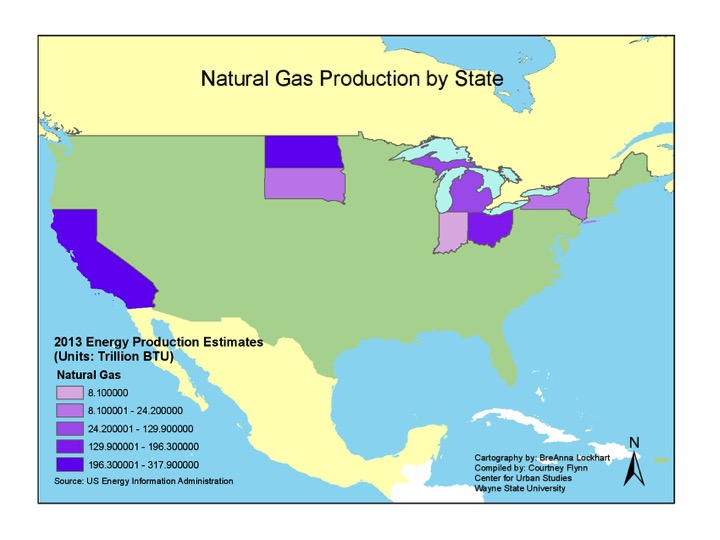
Natural gas was a key source for energy produced in Michigan, and in 2013 it produced 129.9 trillion BTUs of it; North Dakota (317.9), California (287.3) and Ohio (196.3) were the only three states featured that produced more units of natural gas than Michigan did. States that did not produce any natural gas as an energy source were Iowa, Minnesota, Missouri, Wisconsin and Georgia. While not noted on the map, Oregon did produce a small of energy from natural gas in 2013, .8 trillion BTUs.
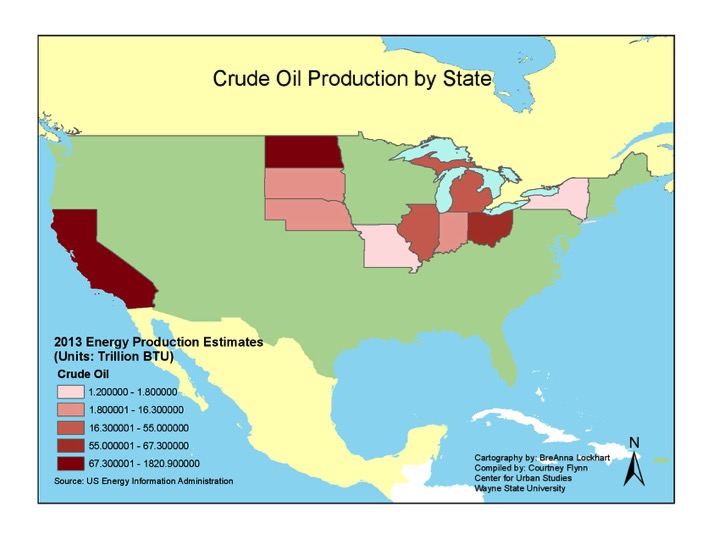
For crude oil production Michigan produced 44.7 trillion BTUs in 2013; North Dakota produced the most at 1,820.9. The only featured states to produce no energy from crude oil in 2013 were Iowa, Minnesota, Wisconsin, Georgia and Oregon.
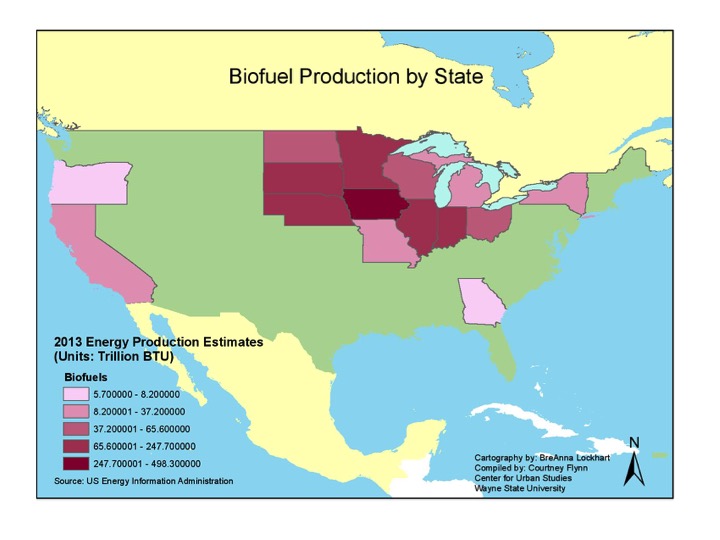
Biofuels and other renewable forms of energy were the sources of energy production that each state featured produced in 2013. For biofuels, Michigan was more on the low end, producing 37.2 trillion BTUs; New York, Georgia and Oregon were the only other three states featured that produced less. Of the states featured, Iowa produced the highest amount of biofuel energy at 498.3 trillion BTUs.
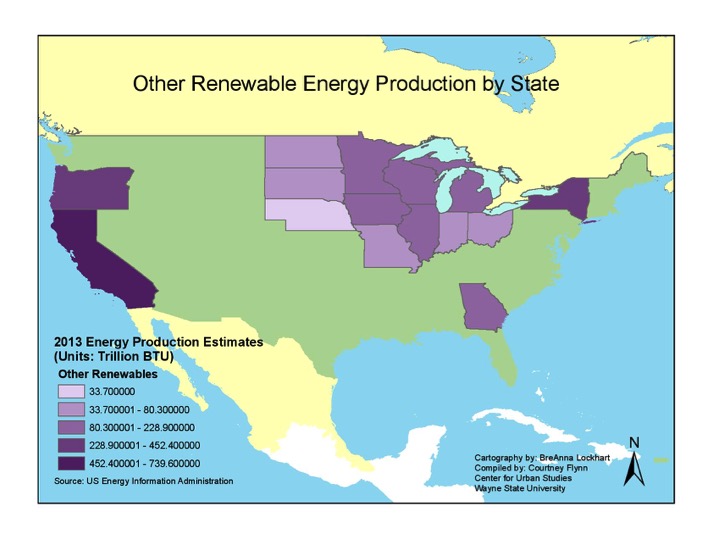
For other renewable energy production, Michigan ranked somewhere in the middle of the featured states. In 2013 it produced 141.9 trillion BTUs of other renewable forms of energy, which include solar and wind energy (currently Michigan has 21 wind farms). California produced the most at 739.6 trillion BTUs, followed by Oregon at 452.4. Of the energy produced by Oregon, other renewables made up for 99 percent of its energy production.
Next week we will view how much energy each featured state consumes and by what source.