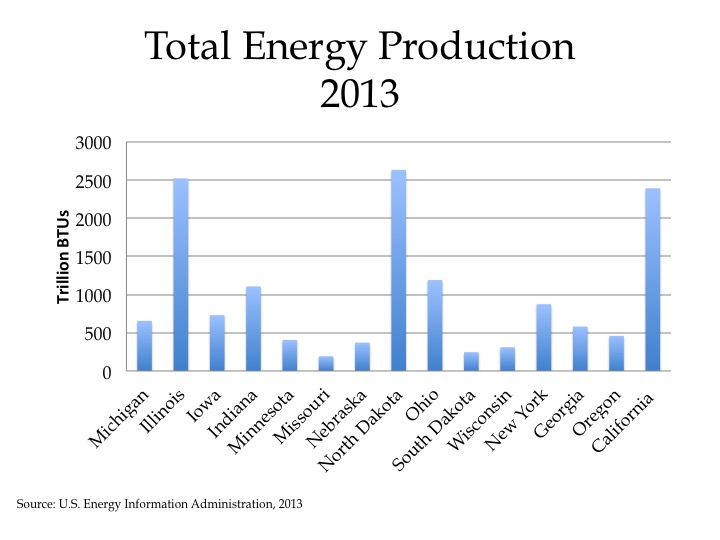
Last week we saw a large variation on the amount of energy produced between 15 carefully selected states, based on information provided by the U.S. Energy Administration. This week, we look at the major energy sources the 15 featured states consume energy from. Those featured states are:
- Michigan
- Illinois
- Iowa
- Indiana
- Minnesota
- Missouri
- Nebraska
- North Dakota
- Ohio
- South Dakota
- Wisconsin
- New York
- Georgia
- Oregon
- California
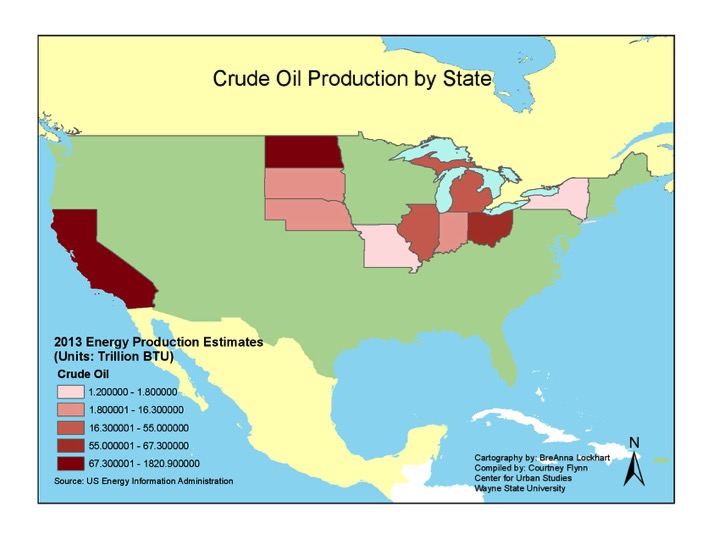
(If one of the above states is not colored in a map it means it produced zero energy for that source. The other 35 states are not highlighted though because they were not chosen for comparison; this does not mean they didn’t utilize a source of energy).
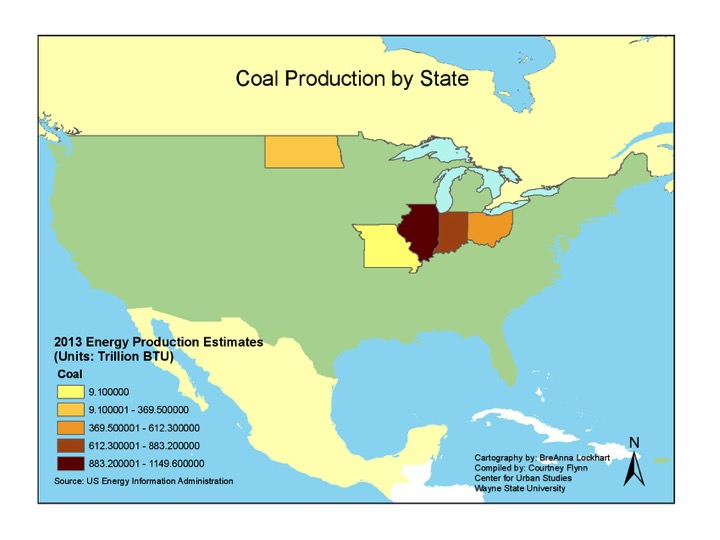
The sources of energy discussed in this post are: coal, natural gas, motor gasoline, biomass and other renewables (which include solar and wind power).
Last week we saw a large variation on the amount of energy produced between 15 carefully selected states, based on information provided by the U.S. Energy Administration. This week, we look at the major energy sources the 15 featured states consume energy from. Those featured states are:
- Michigan
- Illinois
- Iowa
- Indiana
- Minnesota
- Missouri
- Nebraska
- North Dakota
- Ohio
- South Dakota
- Wisconsin
- New York
- Georgia
- Oregon
- California
(If one of the above states is not colored in a map it means it produced zero energy for that source. The other 35 states are not highlighted though because they were not chosen for comparison; this does not mean they didn’t utilize a source of energy).
The sources of energy discussed in this post are: coal, natural gas, motor gasoline, biomass and other renewables (which include solar and wind power).
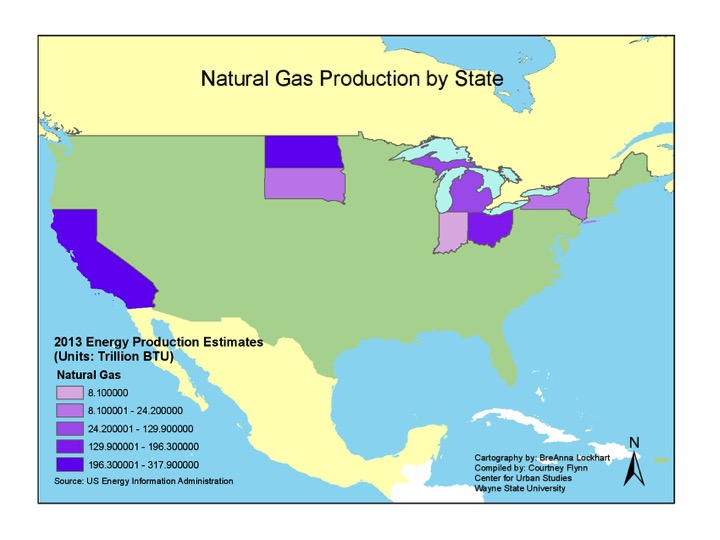
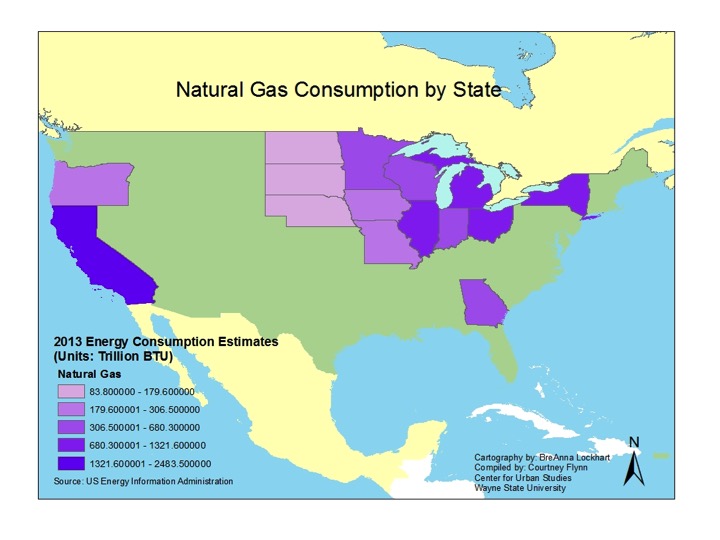
Michigan used more natural gas for energy consumption in the state in 2013 than any other source. In 2013 828.5 trillion BTUs of natural gas were consumed in Michigan; 129.9 trillion BTUs of natural gas were produced in the state in that same year. Of the featured states, the most amount of natural gas was consumed in California at 2,483.5 trillion BTUs. The featured state where the least amount of natural gas was consumed in 2013 was North Dakota at 83.8 trillion BTUs. South Dakota wasn’t far behind though, 84.5 trillion BTUs was consumed there in 2013.
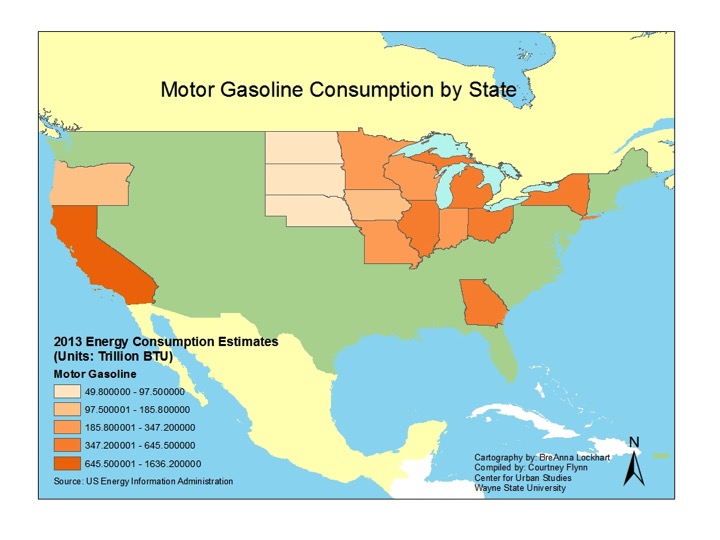
Motor gasoline is another consumption category which the U.S. Energy Administration chose to highlight in its data category breakdowns (others mentioned but not included in this post include residual fuel, liquefied petroleum gas and jet fuel). California again came out on top in terms of consumption, 1636.6 trillion BTUs of motor gasoline was consumed within the state in 2013. In Michigan, 515.5 trillion BTUs of motor gasoline were consumed in 2013; nine of the other featured states consumed less motor gasoline than Michigan in 2013. The state where the lowest amount of motor gasoline was consumed in 2013 was South Dakota at 49.8 trillion BTUs.
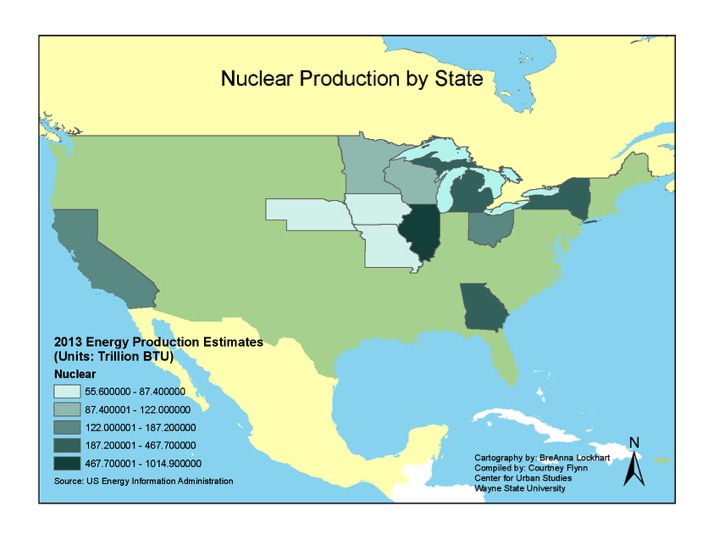
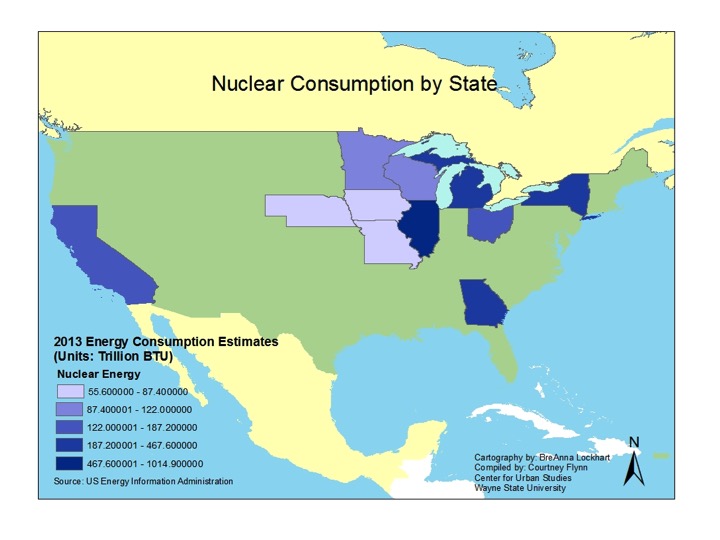
Nuclear power was another energy source that was not produced by all of the featured states, and, as can be seen in the map below it wasn’t an energy source that was consumed in every featured state either. Of the energy sources discussed in this post, nuclear energy was the only source not consumed by every featured state. The featured states where there was no nuclear energy utilized were Indiana and North Dakota; these states also didn’t produce any. Illinois utilized the highest amount of nuclear energy in 2013 of the featured states at 1014.9 trillion BTUs. All nuclear energy produced in these featured states was consumed there. This means Michigan not only produced 302.2 trillion BTUs of nuclear energy but also that that amount was consumed there.
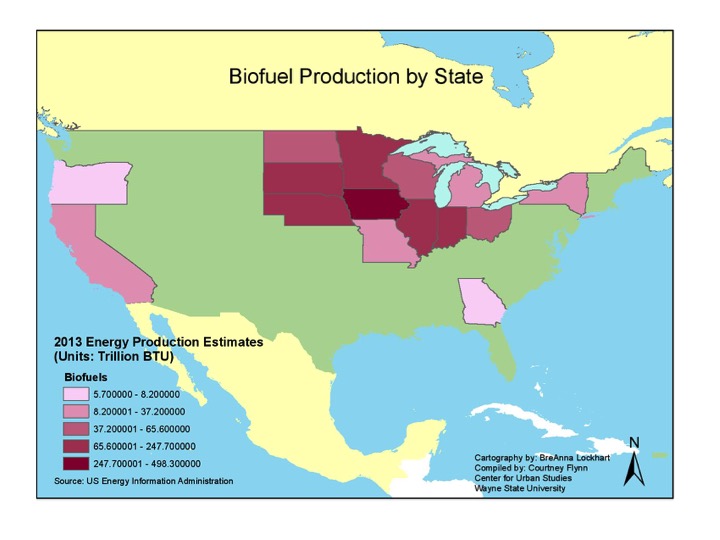
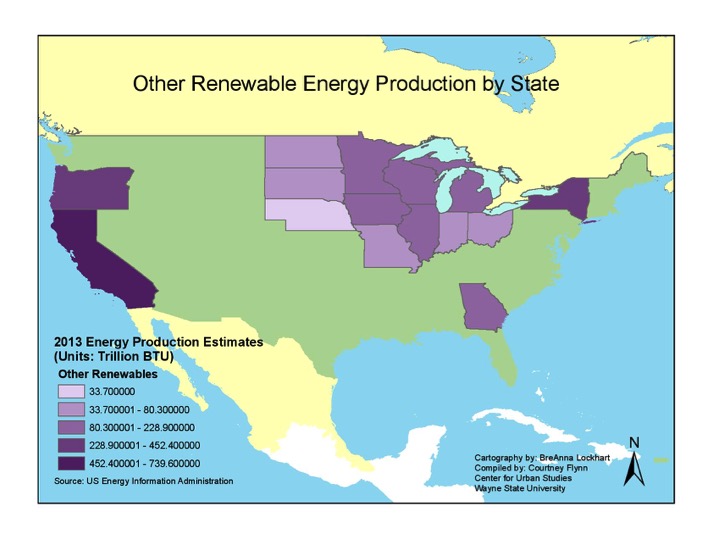
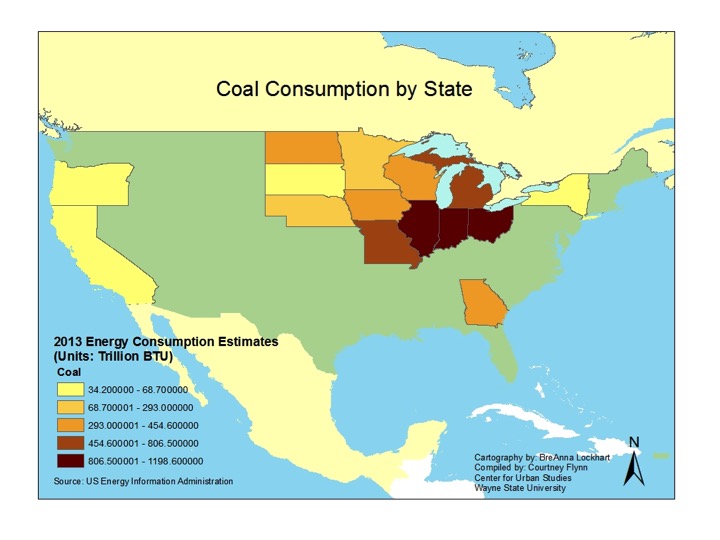
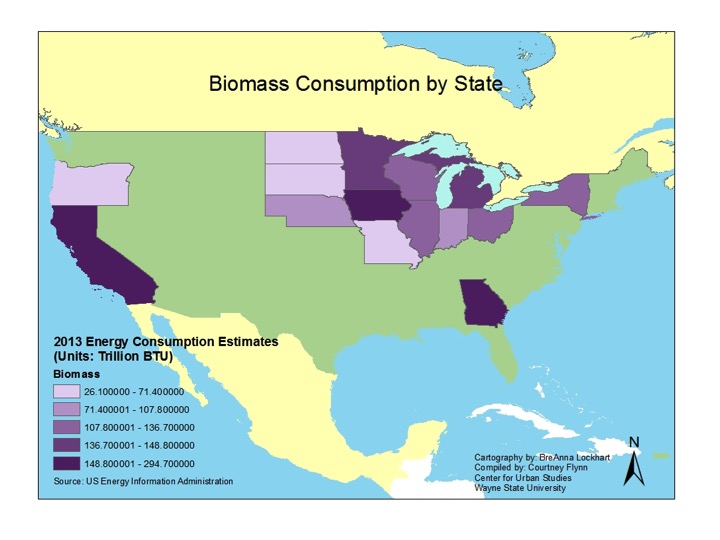
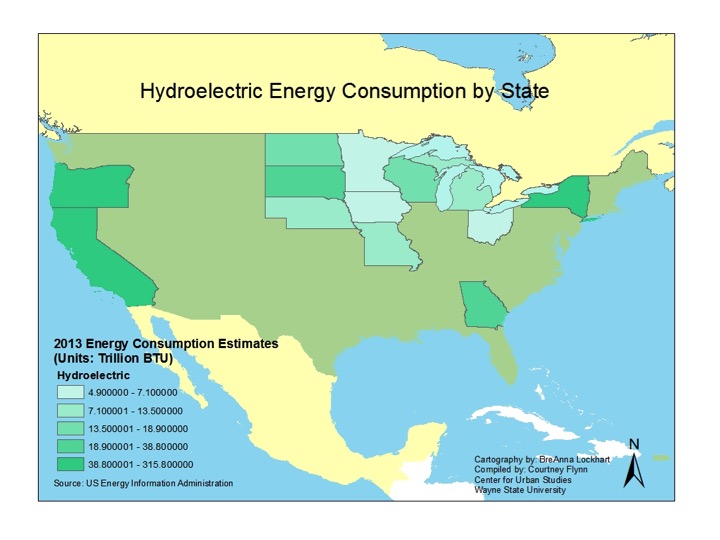
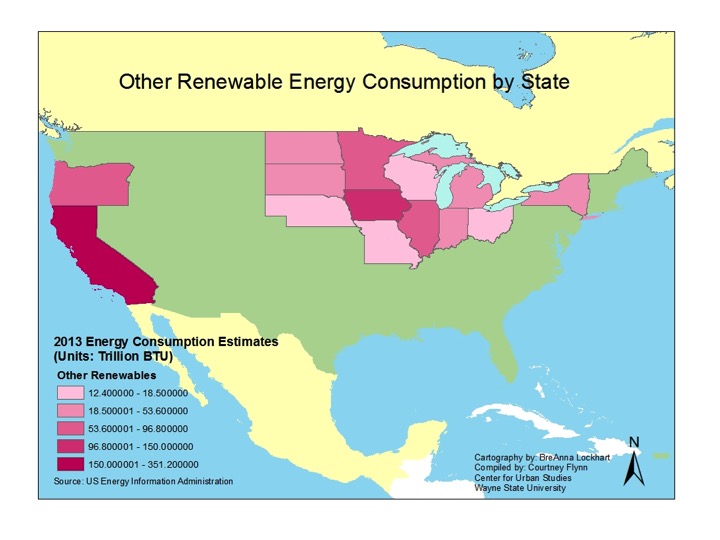
When examining which states consumed the highest amount of renewable energy sources the western states fared better when comparing consumption of these energy sources. California consumed the most amount of biomass of the featured states in 2013 at 294.7 trillion BTUs. It also consumed the highest amount of “other renewable” energy sources (which include wind and solar) at 351.2 trillion BTUs. The amount of hydroelectricity consumed in California was 226.6 trillion BTUs. Oregon and New York were the only states where more hydroelectricity was consumed, 315.8 and 238.3, respectively. Oregon was also the only other featured state (aside from California) that consumed more biomass, “other renewable” and hydroelectricity than coal in 2013. In Oregon in 2013, 71.4 trillion BTUs of biomass, 77.3 trillion BTUs of “other renewables” and, as noted, 315.8 trillion BTUs of hydroelectricity was consumed. About 40 trillion BTUs of coal-powered energy was consumed in Oregon in 2013.
In Michigan 13.5 trillion BTUs of hydroelectricity, 148.8 trillion BTUs of biomass and 33.1 trillion BTUs of “other renewables” was consumed in 2013. Overall, Michigan consumed slightly more renewable energy than it produced, that net gain was due to biomass consumption.
Over the past two weeks we have presented the basics for energy consumption and production by source in a select number of states. Next week, we will begin our deeper dive into the energy production surpluses and deficits on a state-to-state basis, showing reliance on certain energy sources despite the state’s lack of or limited production of it.