According to recent data compiled by Bloomberg, Michigan’s economy has out-performed every other state’s in the last year based on equally weighted measures of employment, personal income, home prices, mortgage delinquency, state tax revenue and the stock market performance of its publicly-traded companies. One example of this is how the number of workers employed in Michigan has risen faster than the average number US of workers employed in the last year. Since April of 2020 the number of non-farm payrolls increased by 25 percent, according to the Bureau of Labor Statistics; the US average increased by 14.3 percent and Michigan lead every state in the nation with that 25 percent increase. Another example is how the bond ratings in the state have stood out compared to other state’s. Michigan’s AA-rated bonds returned 5.6 percent (income plus appreciation) since April 2020, outperforming neighboring Wisconsin (4.3%), Indiana (4.7%) and Ohio (4.7%) as well as the entire municipal market (5.3%), according to data compiled by Bloomberg. Additionally, bonds issued by the Michigan Strategic Fund returned a 15 percent interest rate and bonds issued by Detroit Downtown Development project returned a 14 percent interest rate, according to data compiled by Bloomberg. Closer inspection of this would probably also indicate that these bonds are carrying higher than market rates because of Detroit’s past financial challenges.
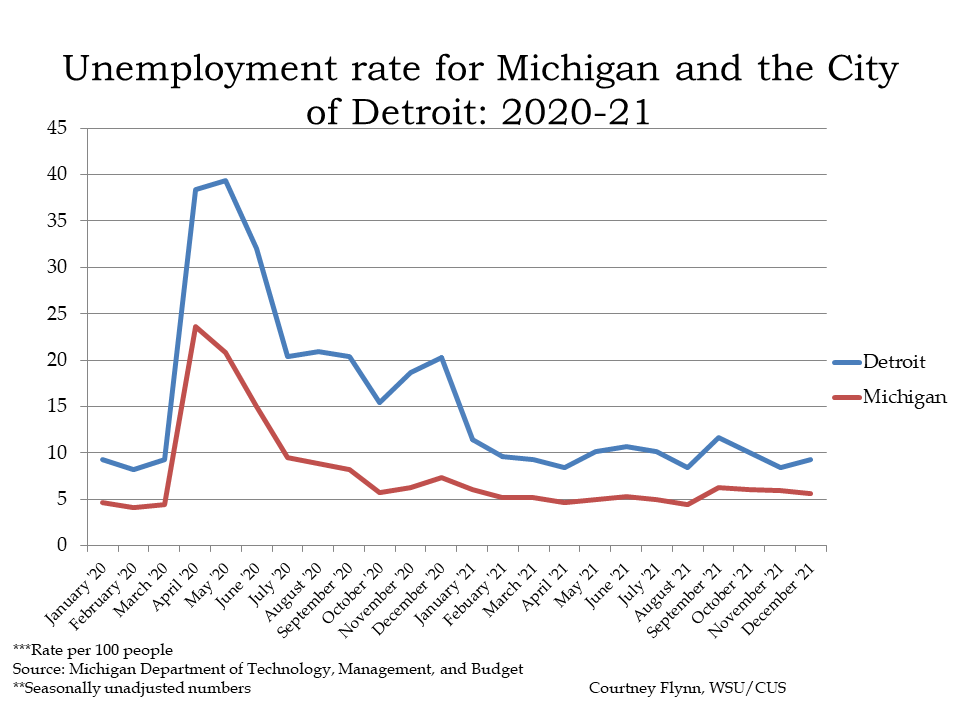
Another example highlighted by Bloomberg is how Michigan’s unemployment rate has recovered since the pandemic. The chart below shows the unemployment rates for Michigan and Detroit since January of 2020.
In December of 2021 the unemployment rate for the State of Michigan declined to 5.6 percent from the 5.9 percent it was reported at for November of 2021. In April of 2020, when Michigan first began experiencing the effects of the pandemic, the unemployment rate was reported at 23.6 percent.
For the City of Detroit, the unemployment rate for December of 2021 was 9.3 percent, an increase from the 8.4 percent it was reported at the month prior. When the pandemic first began Detroit’s unemployment rate was 38.4 percent and in December of 2020 the Detroit unemployment rate was 20.3 percent, meaning there has been a significant decrease in the local unemployment rate in the last nearly two years.
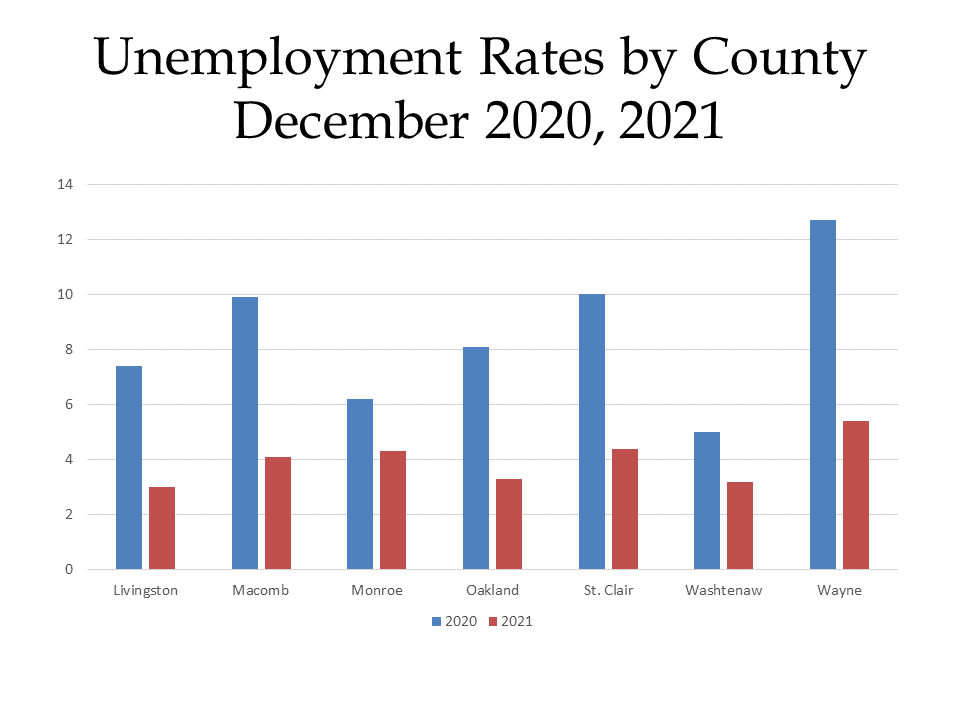
Digging deeper into the regional unemployment data, we see that each county in Southeastern Michigan had a lower unemployment rate in December of 2021 than December of 2020. Wayne County had the largest decrease over that year with a 7.3 unemployment rate decline. In December of 2020 Wayne County had a 12.7 percent unemployment rate and in December of 2021 it was reported at 5.4 percent. However, despite having the largest decline in its unemployment rate, Wayne County still reported the highest unemployment rate of the region in December of 2021 at 5.4 percent; Livingston County had the lowest at 3 percent.
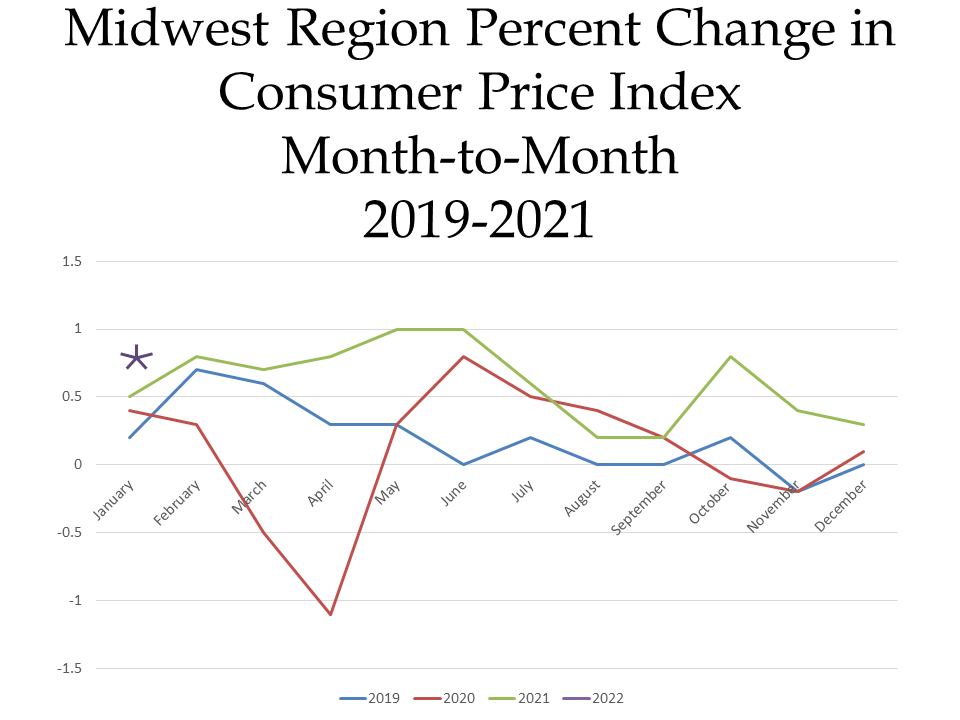
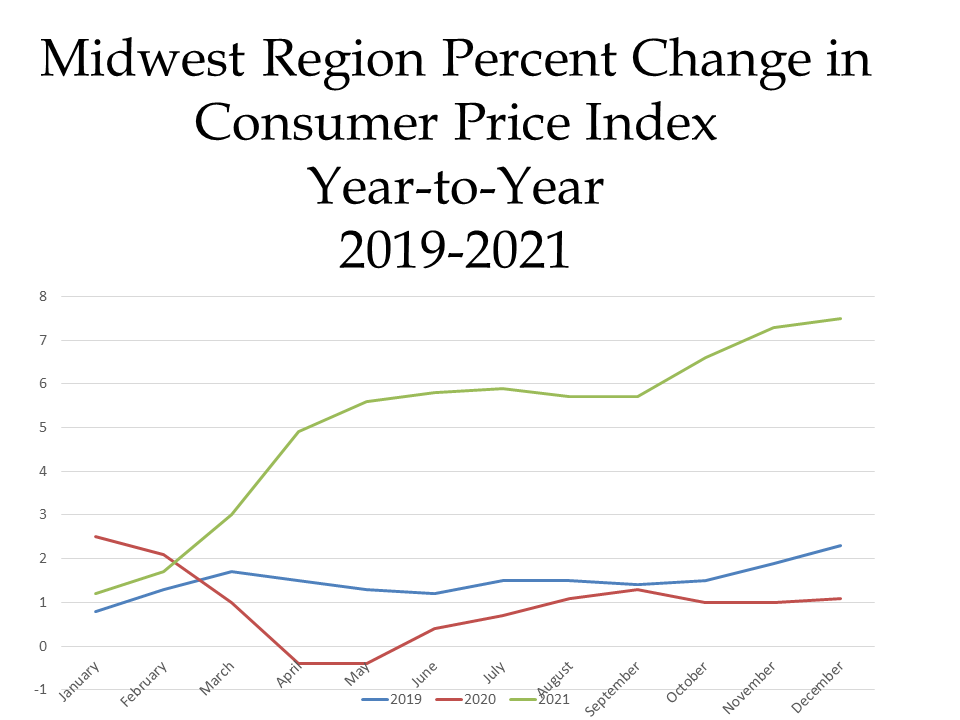
The charts below show the percent changes in the Consumer Price Index (CPI) on a month-to-month basis and a year-to-year basis for each month in years 2019, 2020 and 2021 in the Midwest Region. The CPI is a measure that examines the weighted average of prices of consumer goods and services, such as transportation, food, energy, housing and medical care. It is calculated by taking price changes for each item in the predetermined group of goods and averaging them.
The first chart below highlights how the CPI changed on a month-to-month basis between 2019 and 2021. Currently in 2021, the region’s prices were up 0.8 percent in January, with higher prices for new and use motor vehicles (up 1.3 percent), household furnishings and operations (up 1.7 percent) and apparel (up 3.3 percent) being large contributors to the increase, without considering food and energy prices. Additionally, food prices increased 1.9 percent. The month-to-month changes reflect how pricing has changed one month to the next while the year-to-year CPI index reflects such changes on an annual basis, while considering each month.
When examining the second chart, which shows how prices changed on a year-to-year basis, we see how prices continued to increase in 2021, with the December year-to-year CPI being the highest increase shown below. When examining both the month-to-month and year-to-year comparisons, the year-to-year data gives a clearer picture on just how much pries have increased in the last year. In December of 2021 the CPI was reported to be 7.5 percent above what it was the year prior. Contributing factors to the continued increase in the CPI include food prices increasing 8 percent over the last year and energy prices increasing 25 percent over the last year. Additionally, new and used motor vehicles increased 24.8 percent, shelter increased 4.6 percent and household furnishings and operations increased 11.6 percent.
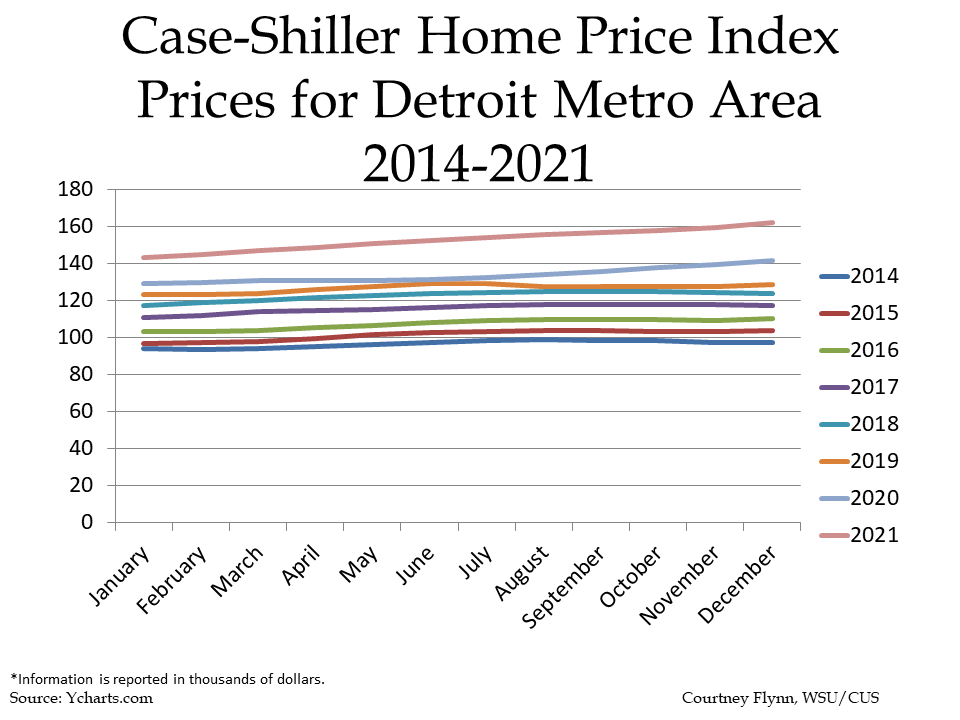
While Michigan’s economy may be recovering since COVID first hit, the State’s housing market is not exempt for the increasing prices being witness across the country. Home prices continue to increase, as has already been indicated by the increasing CPI. In Metro Detroit, according to the Case-Shiller Home Price Index, the average price of single-family dwellings sold was $161,880 in December of 2021; this was $2,290 higher than the average family dwelling price in November. The December 2021 price was an increase of $20,220 from December of 2020 and $64,900 from December of 2014.