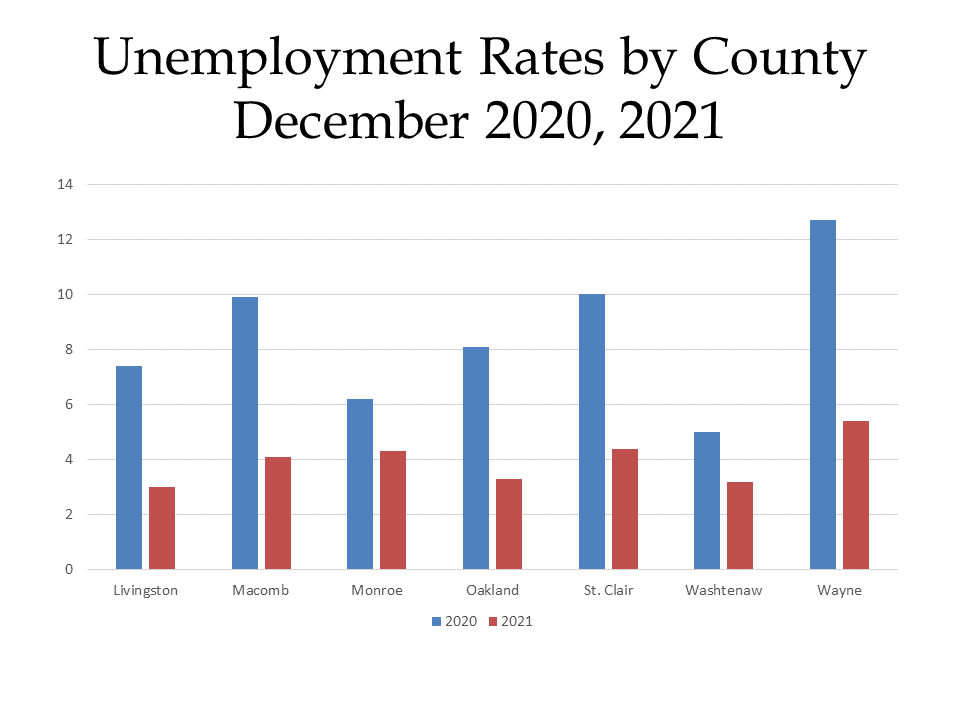
Michigan’s unemployment continues to decrease, for the tenth straight month, and the labor force in the state continues to grow. This year is looking much rosier than in 2020 when great uncertainty riddled the state, and the country. With job recovery following the peak of the pandemic, and an increase in revenues from the sales and use tax and federal funding the state is predicting about a $5 million surplus. While such a surplus can viewed as a sign of improved economic times, we must also recognize inflation is on the rise, and uncertainty still looms with COVID and the war in Ukraine. Recognizing that inflation is hitting the homes of most, if not all, Gov. Gretchen Whitmer was proposed sending $500 to working Michigan families in attempt to help ease the strain on our pockets. The Republic led majority legislature is discussing a $2.5 billion plan that would cut taxes. What will happen remains unknown, especially as the project surplus is just an estimate.
But the data below does tell that story that Michigan’s economy is on the rise while the costs of goods and services is also on the rise.
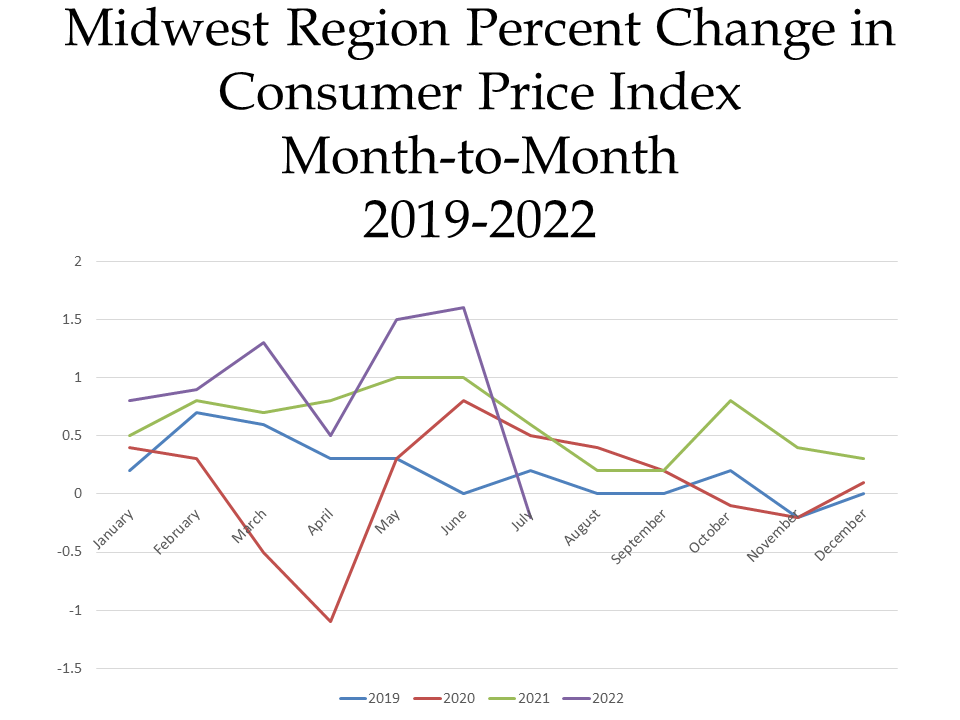
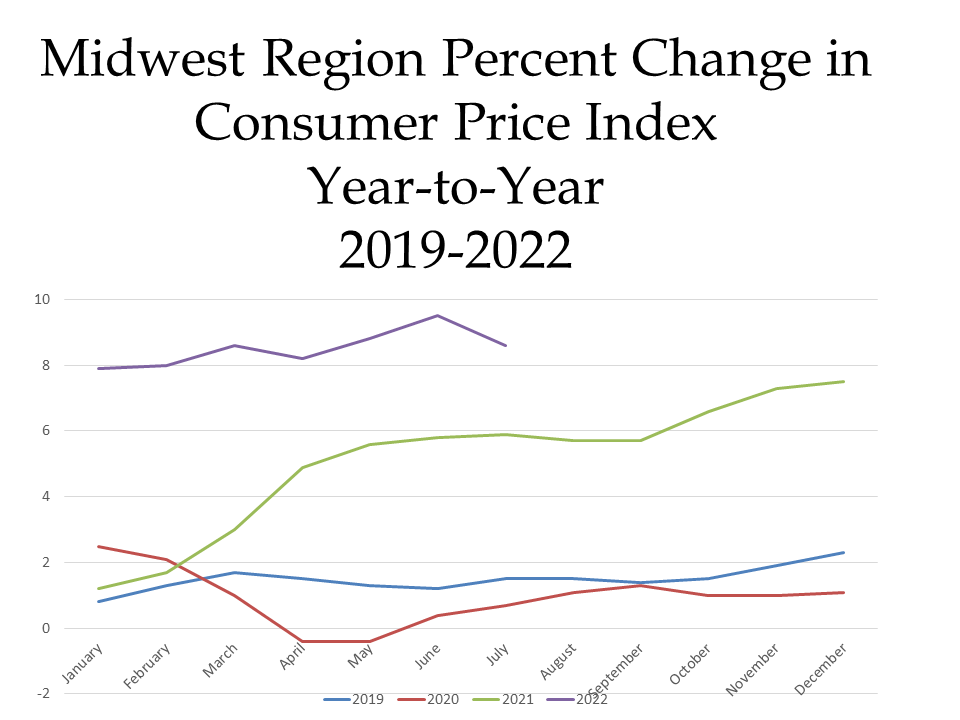
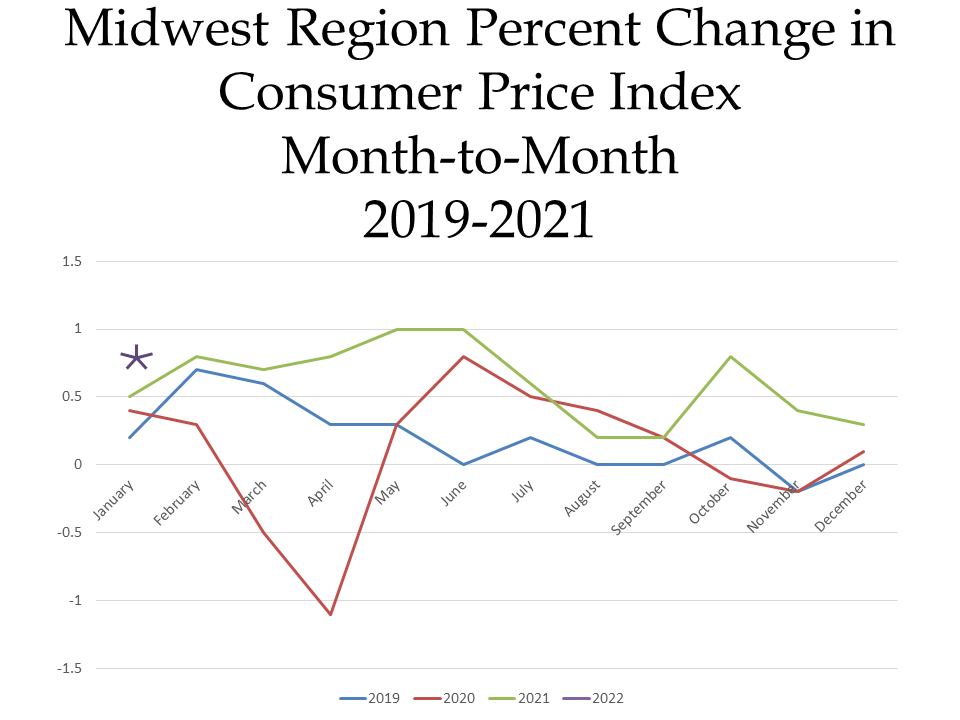
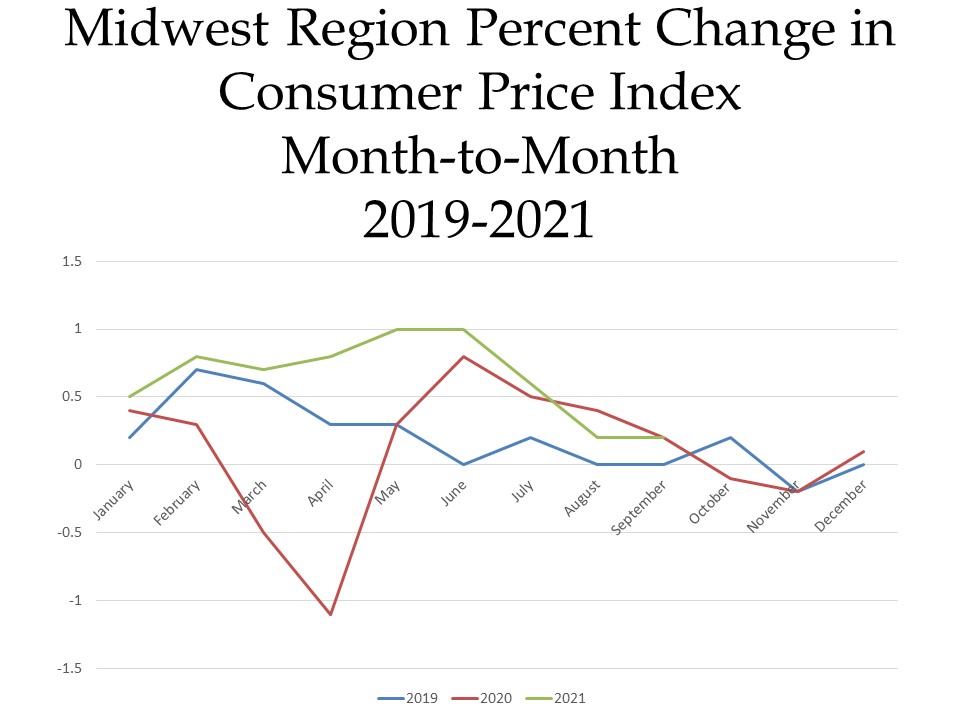
The charts below show the percent changes in the Consumer Price Index (CPI) on a month-to-month basis and a year-to-year basis for each month in years 2019, 2020, 2021 and 2022 in the Midwest Region. The CPI is a measure that examines the weighted average of prices of consumer goods and services, such as transportation, food, energy, housing and medical care. It is calculated by taking price changes for each item in the predetermined group of goods and averaging them.
The first chart below highlights how the CPI changed on a month-to-month basis between 2019 and 2022. Currently in 2022, the region’s prices were down 0.2 percent. The highlights for the change include:
•Food prices increasing 1.2 percent for the month of July (prices for food at home increased 1.5 percent while prices for food outside of the home increased by 0.8 percent)
•Gas prices declining 8.8 percent, which contributed to the energy index decline of 5.7 percent
•Overall, prices without considering food and energy prices, rose by 0.3 percent from the month prior.
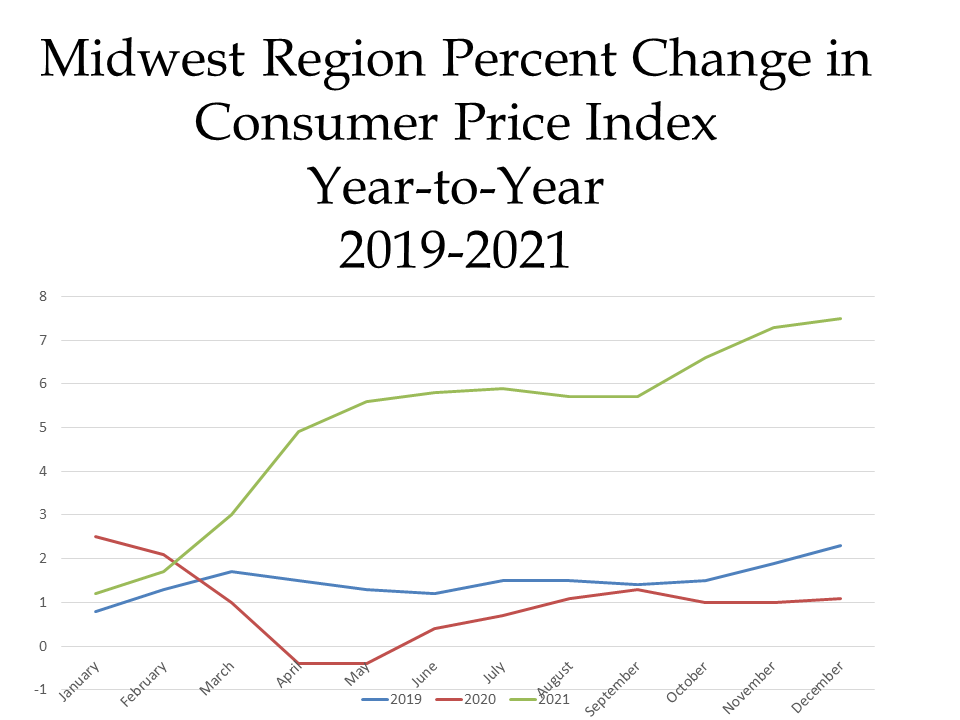
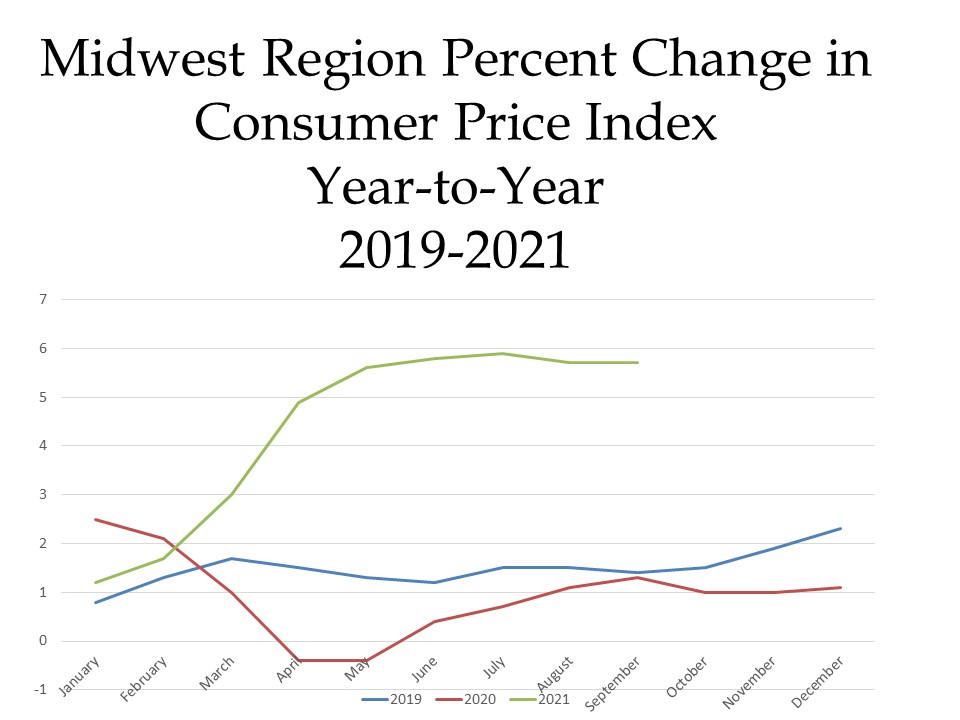
When examining the second chart, which shows how prices changed on a year-to-year basis, we see how prices remain higher than previous years but that there was a decline in the CPI for the month of July between 2021 and 2022.
In July of 2022 the CPI was reported to be 8.6 percent above what it was the year prior (this is lower than the 9.5 percent increased experienced between June of 2021 and 2022). Contributing factors to the continued increase in the CPI include:
•Food prices increasing 12.4 percent over the last year
•Energy prices increasing 34.1 percent over the last year.
•New and used motor vehicles increasing 8.4 percent
•And household furnishings and operations increasing 10.8 percent.