Detroit’s Population Falls in 2020 Census, Oakland and Macomb Counties Continue to Grow

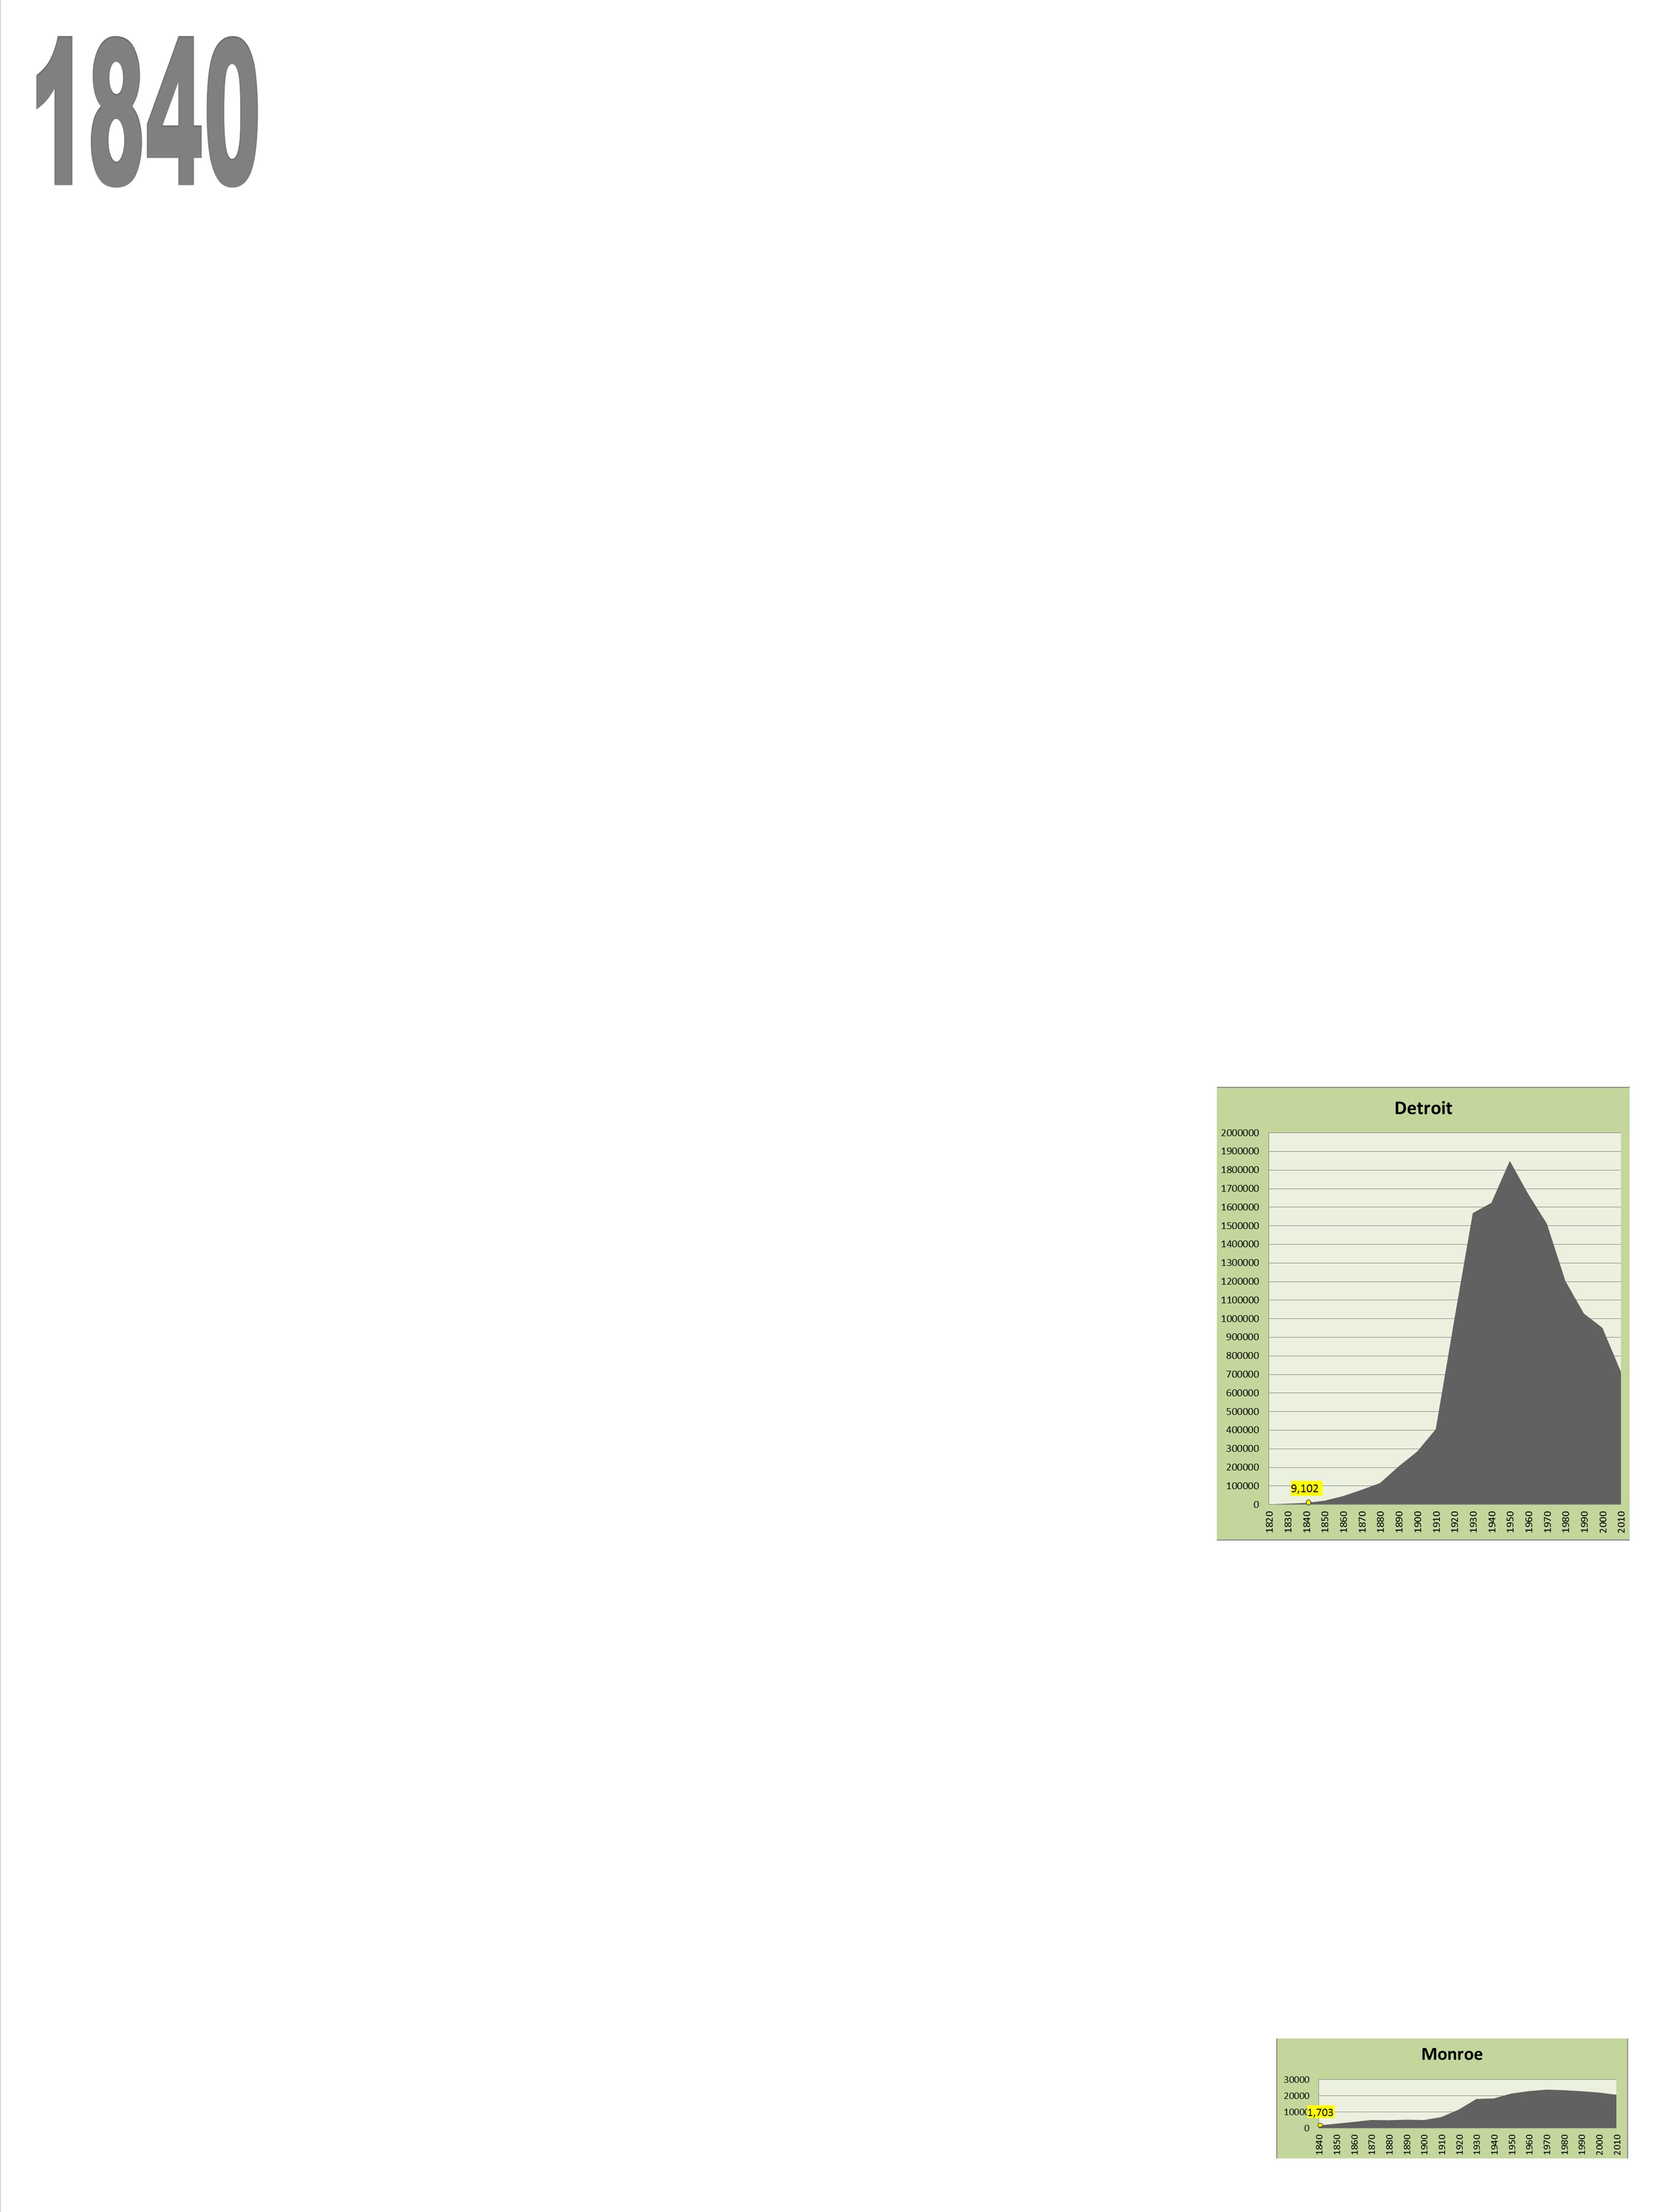
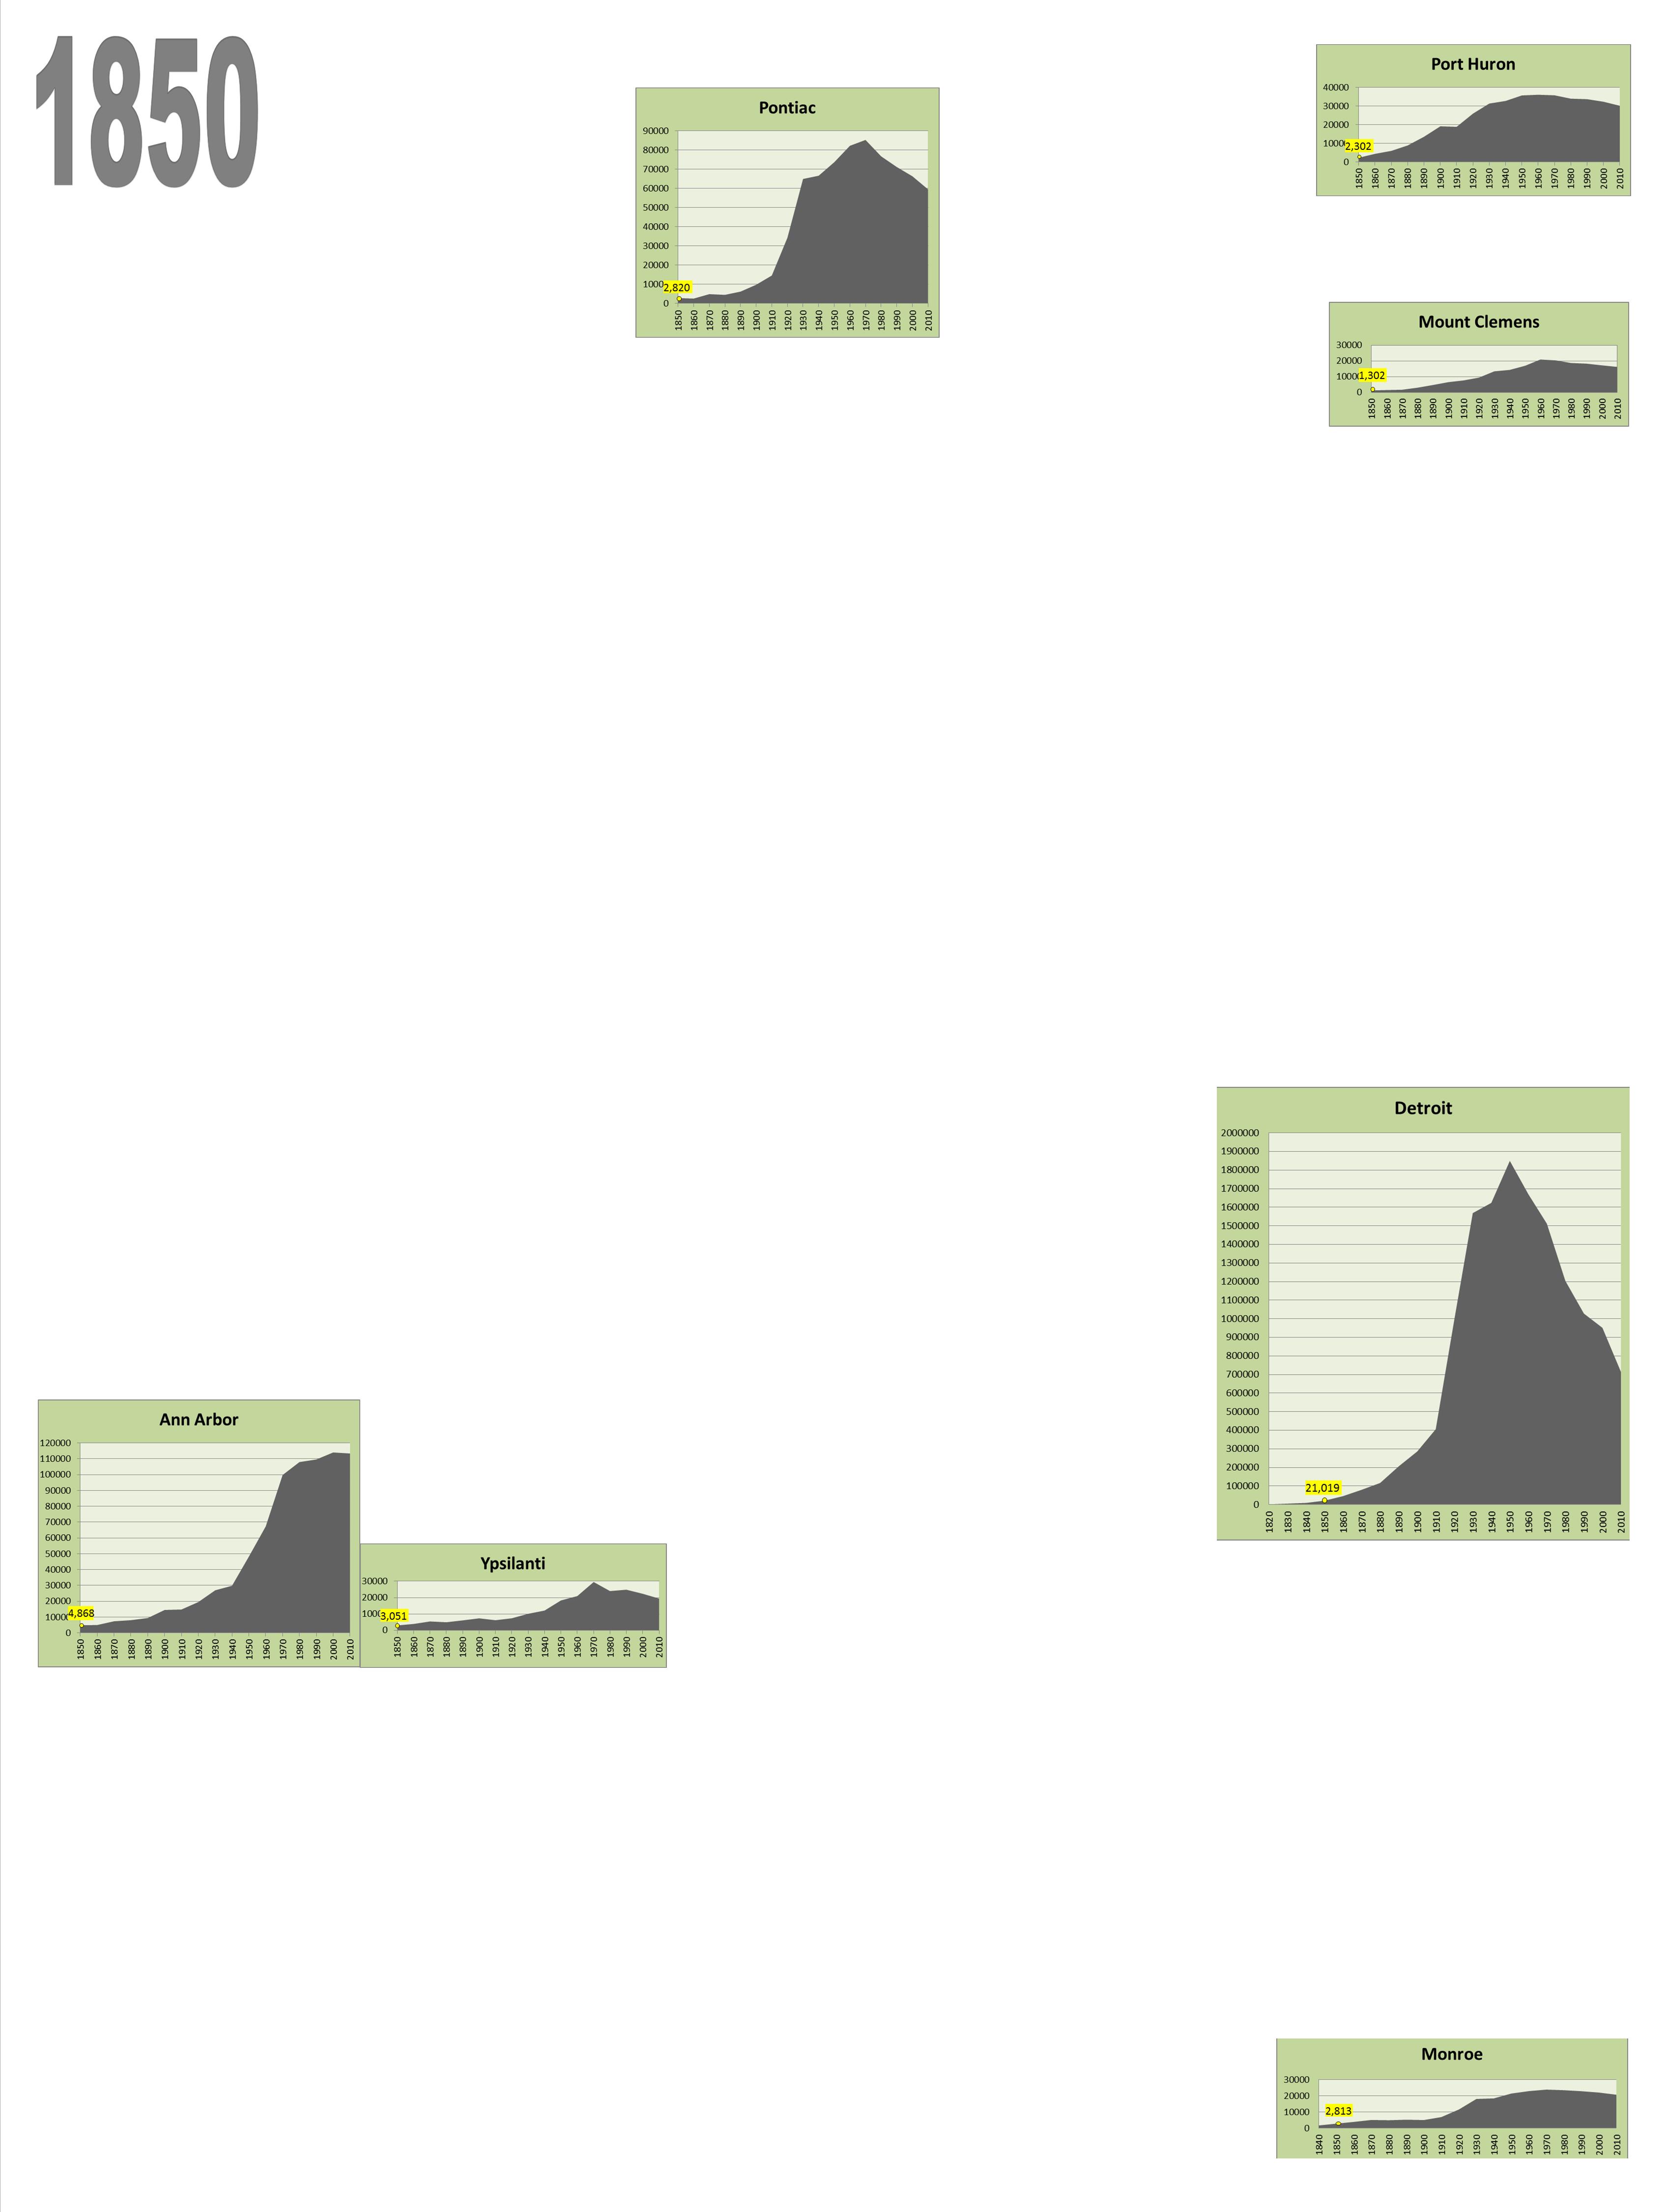
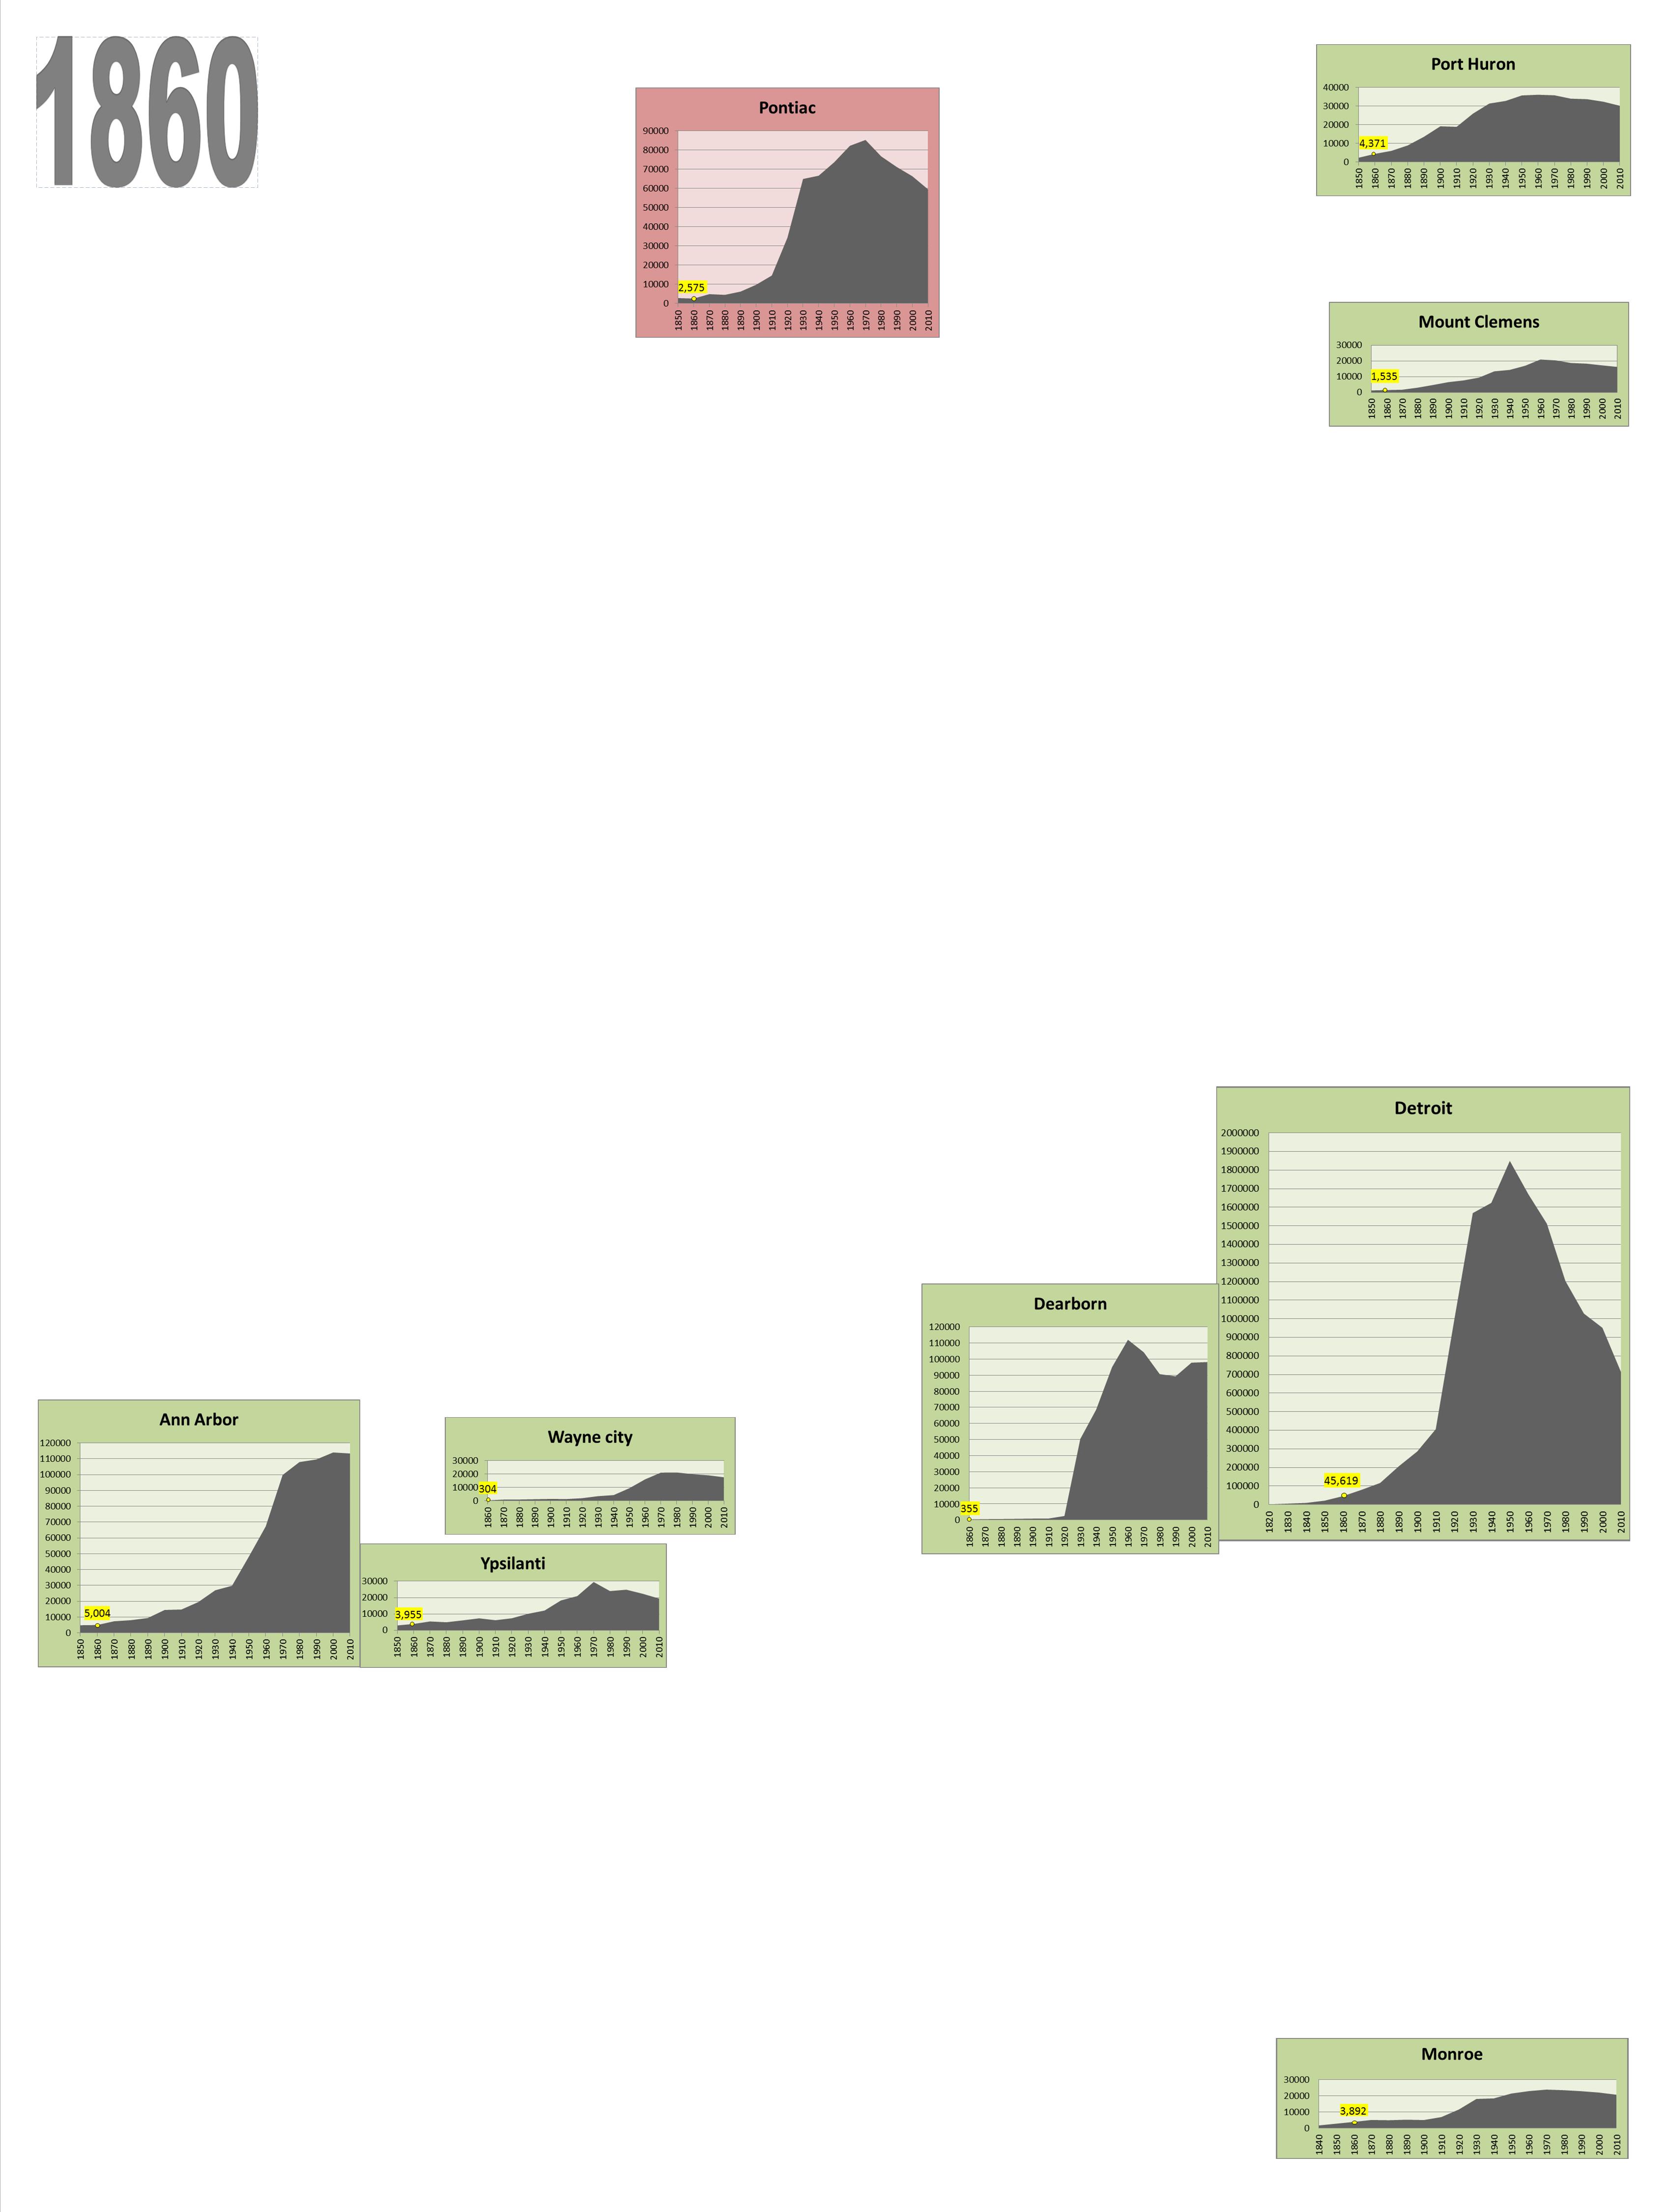
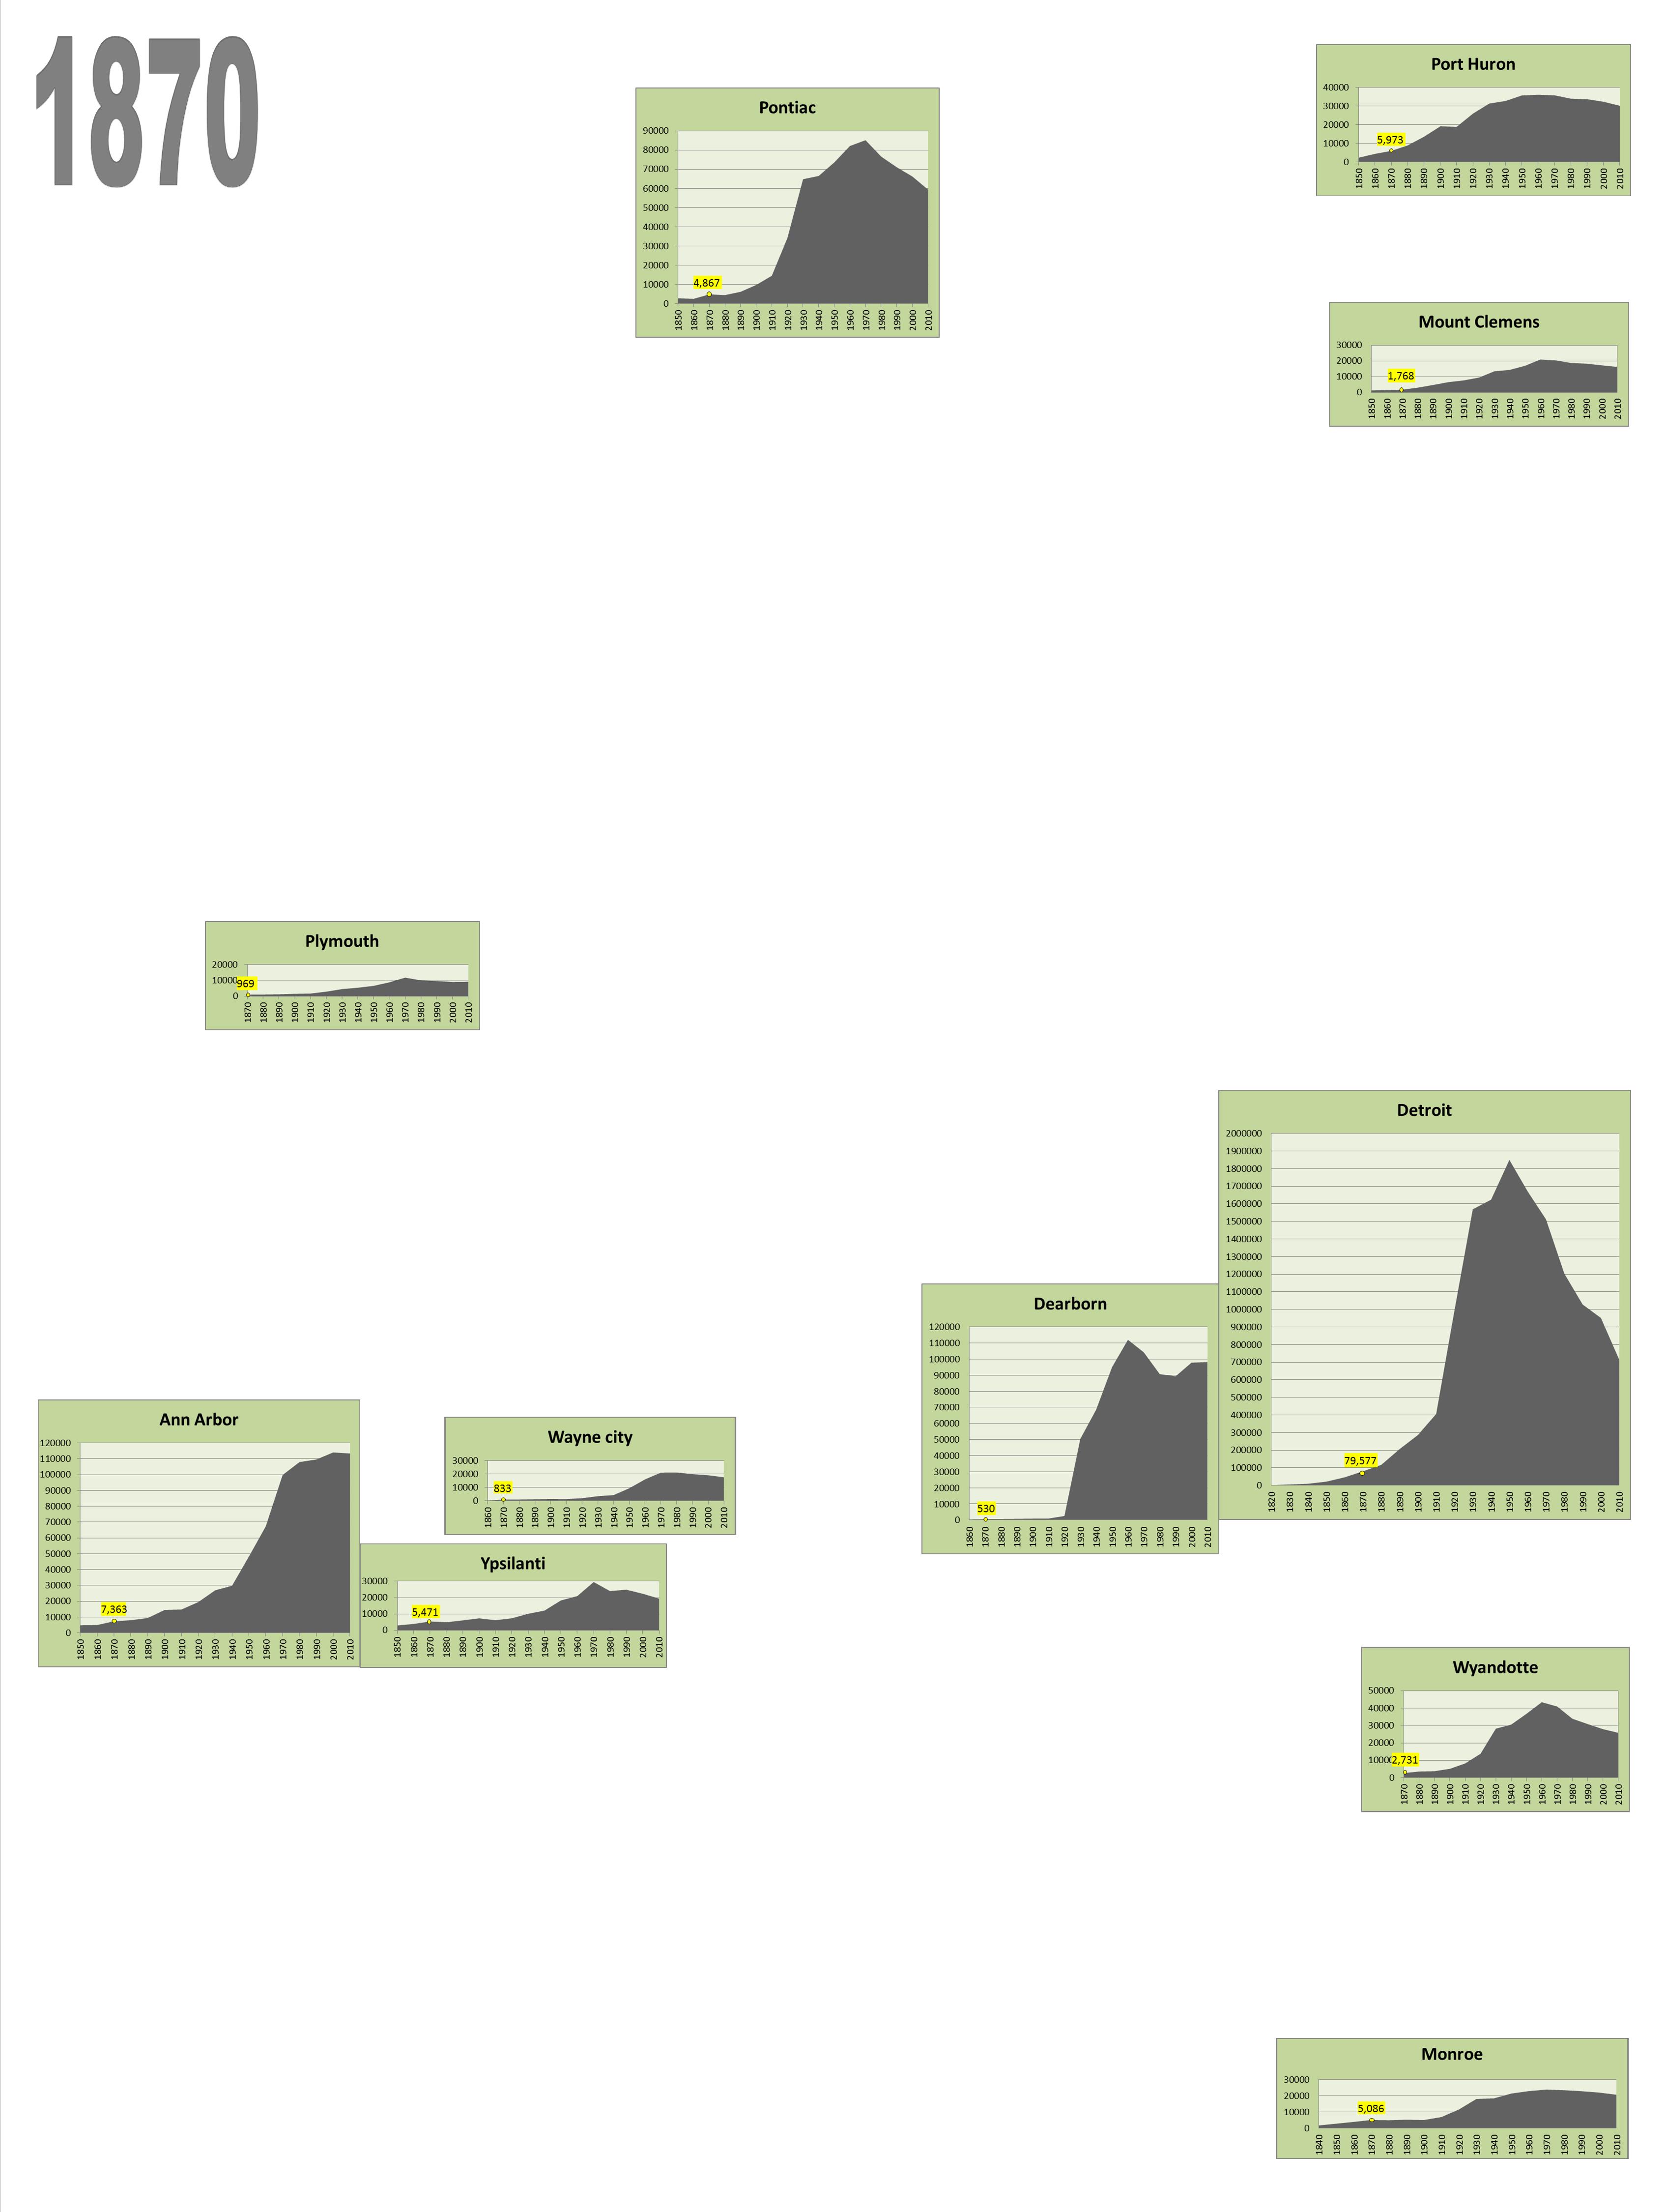
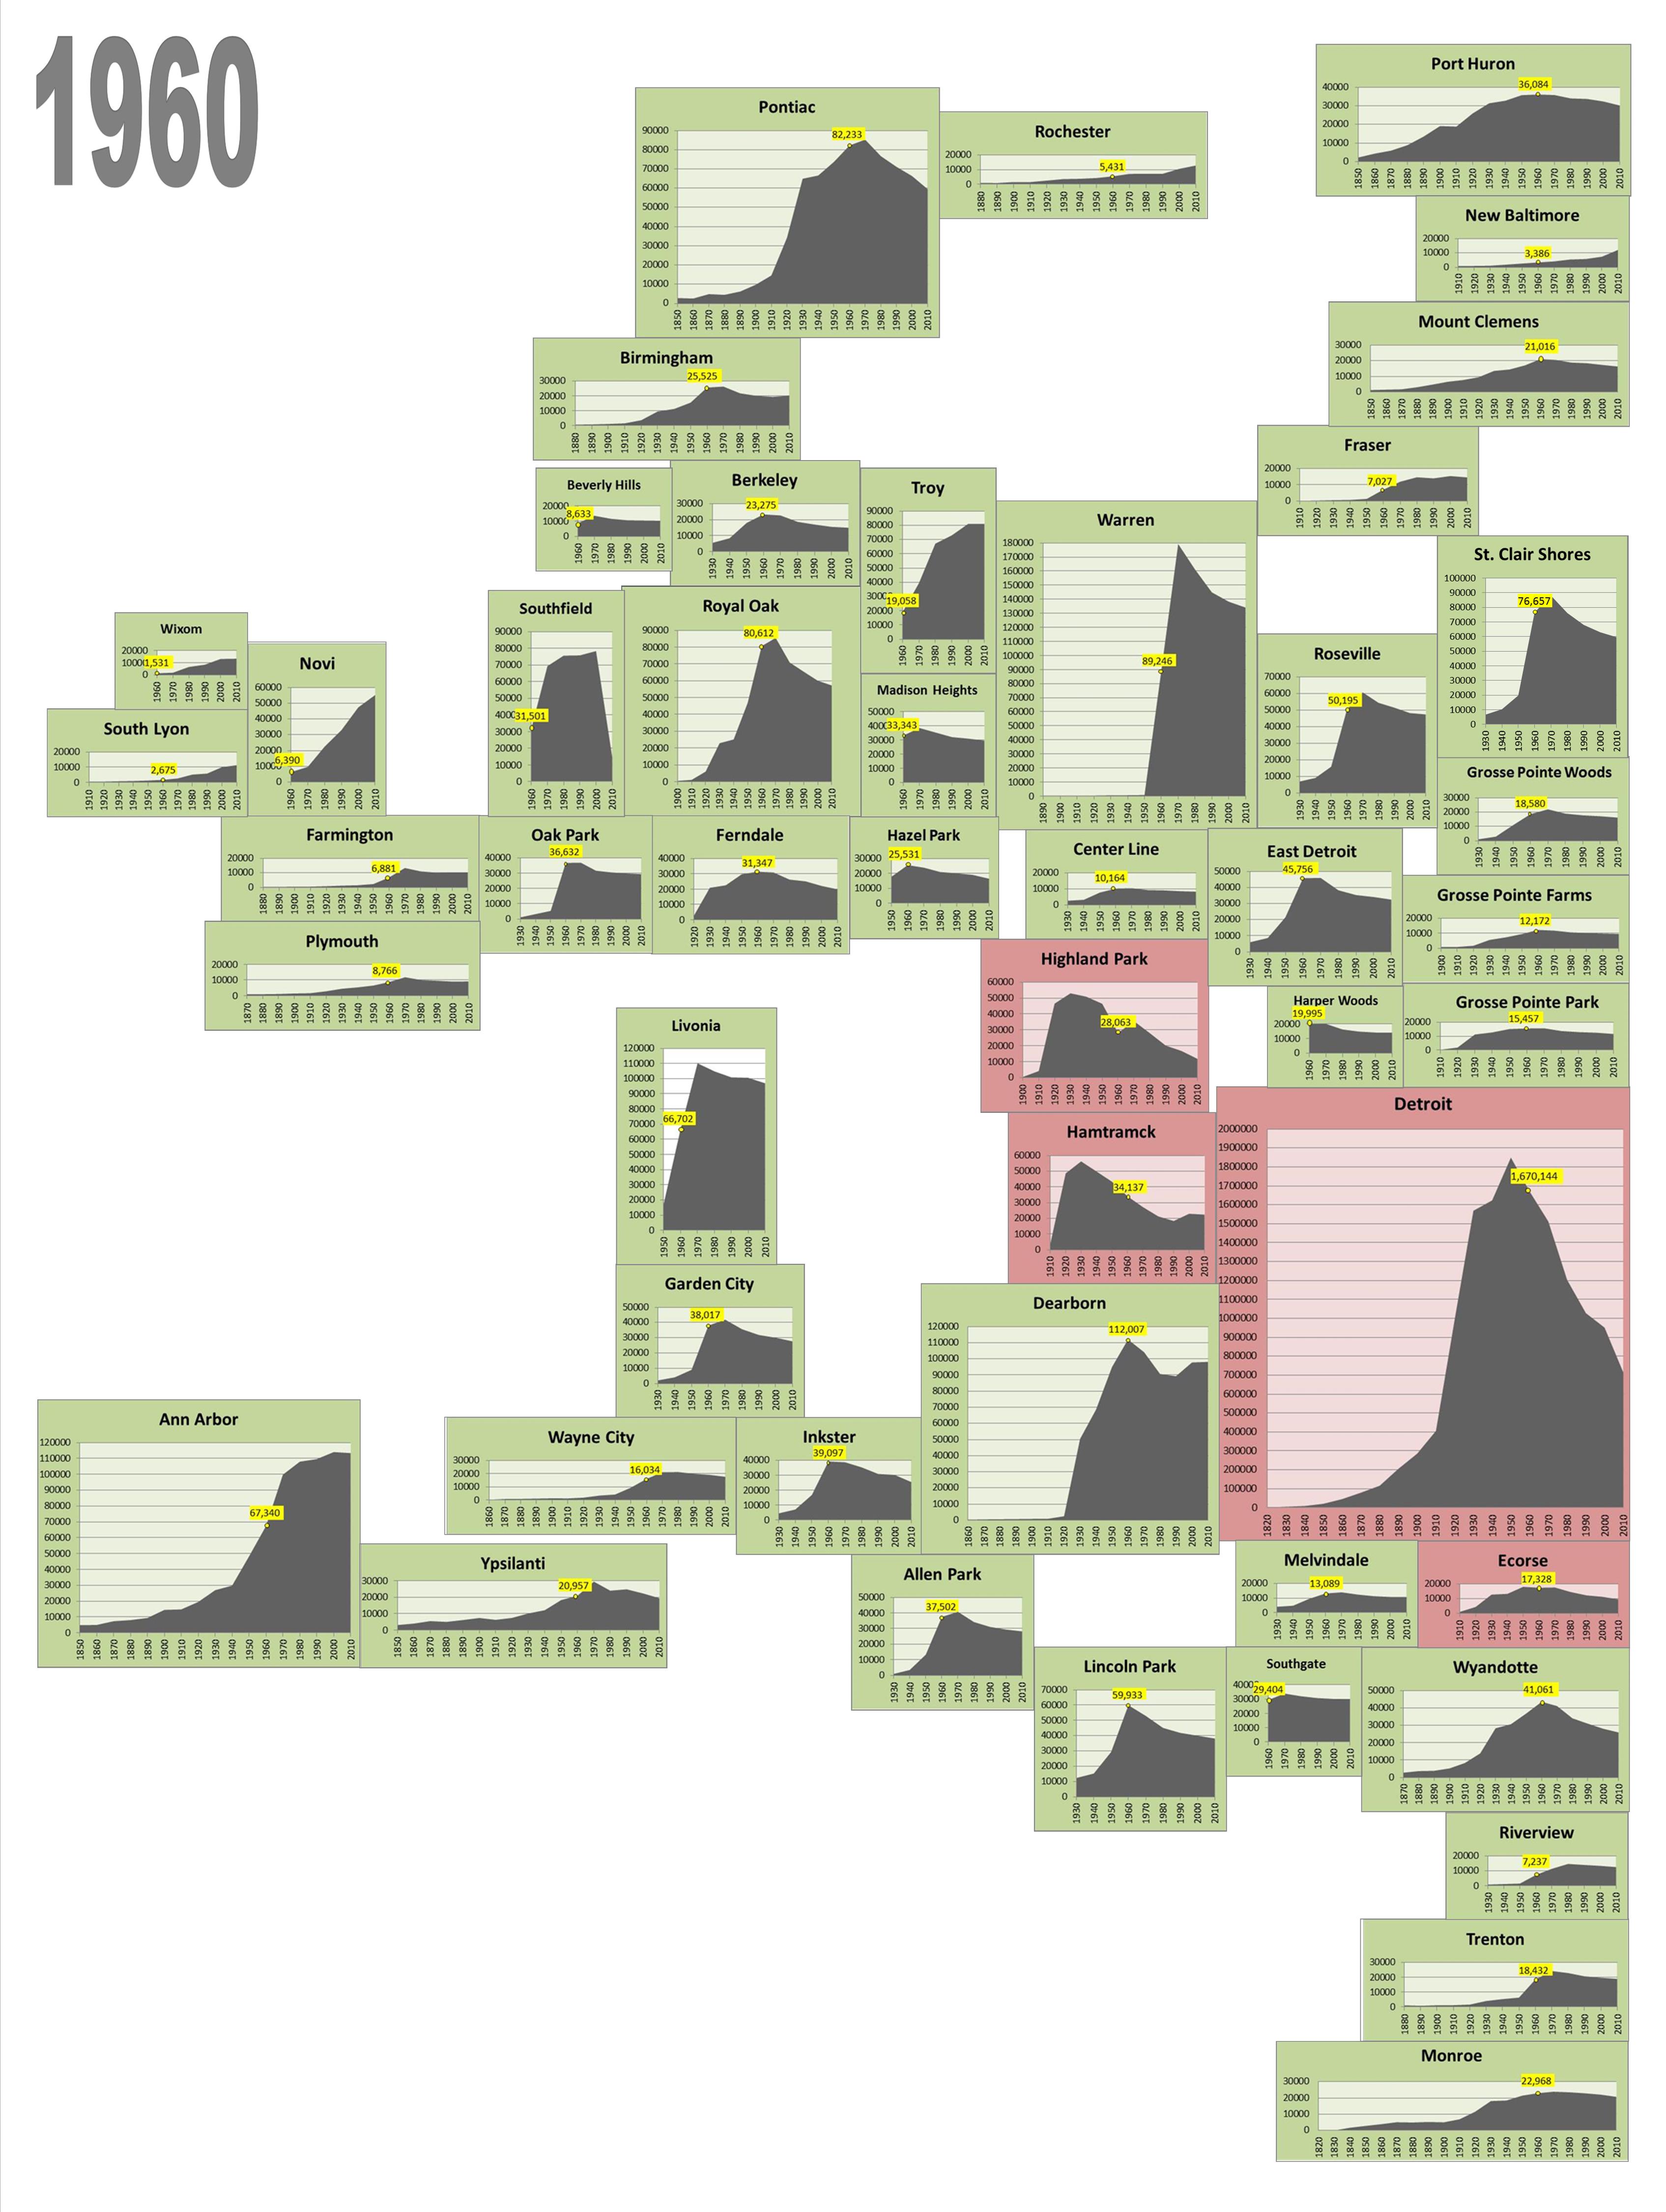
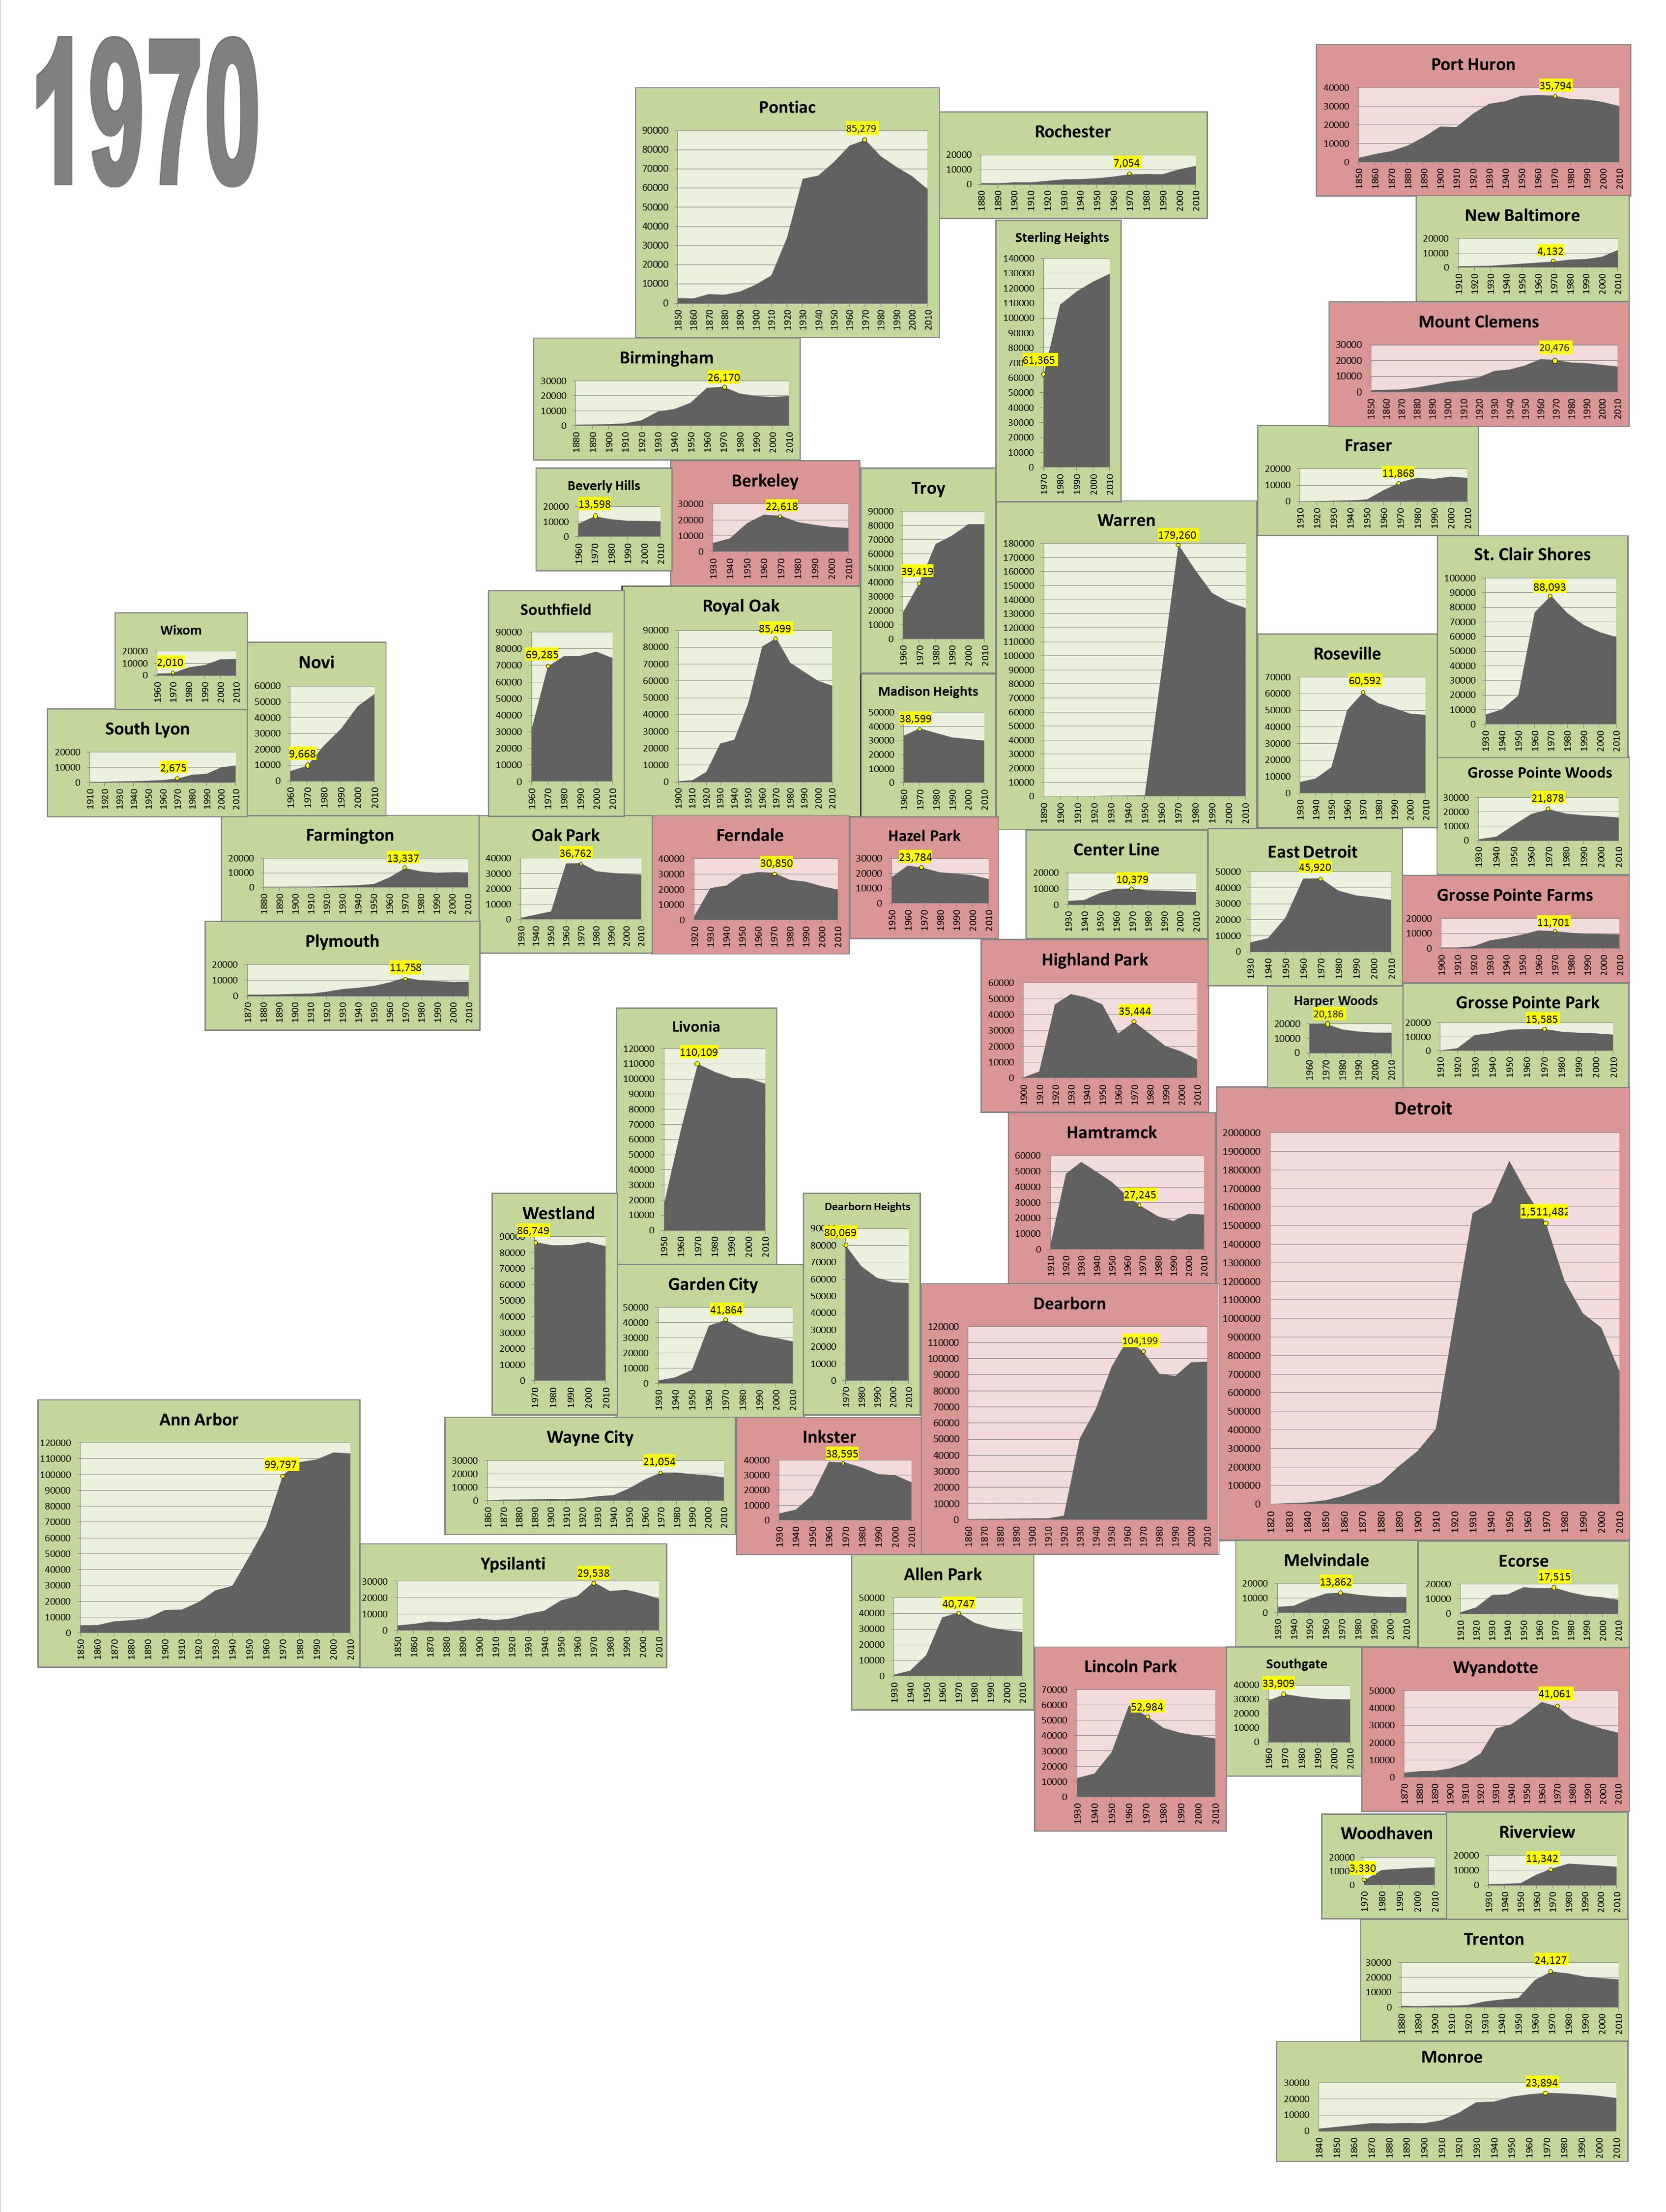
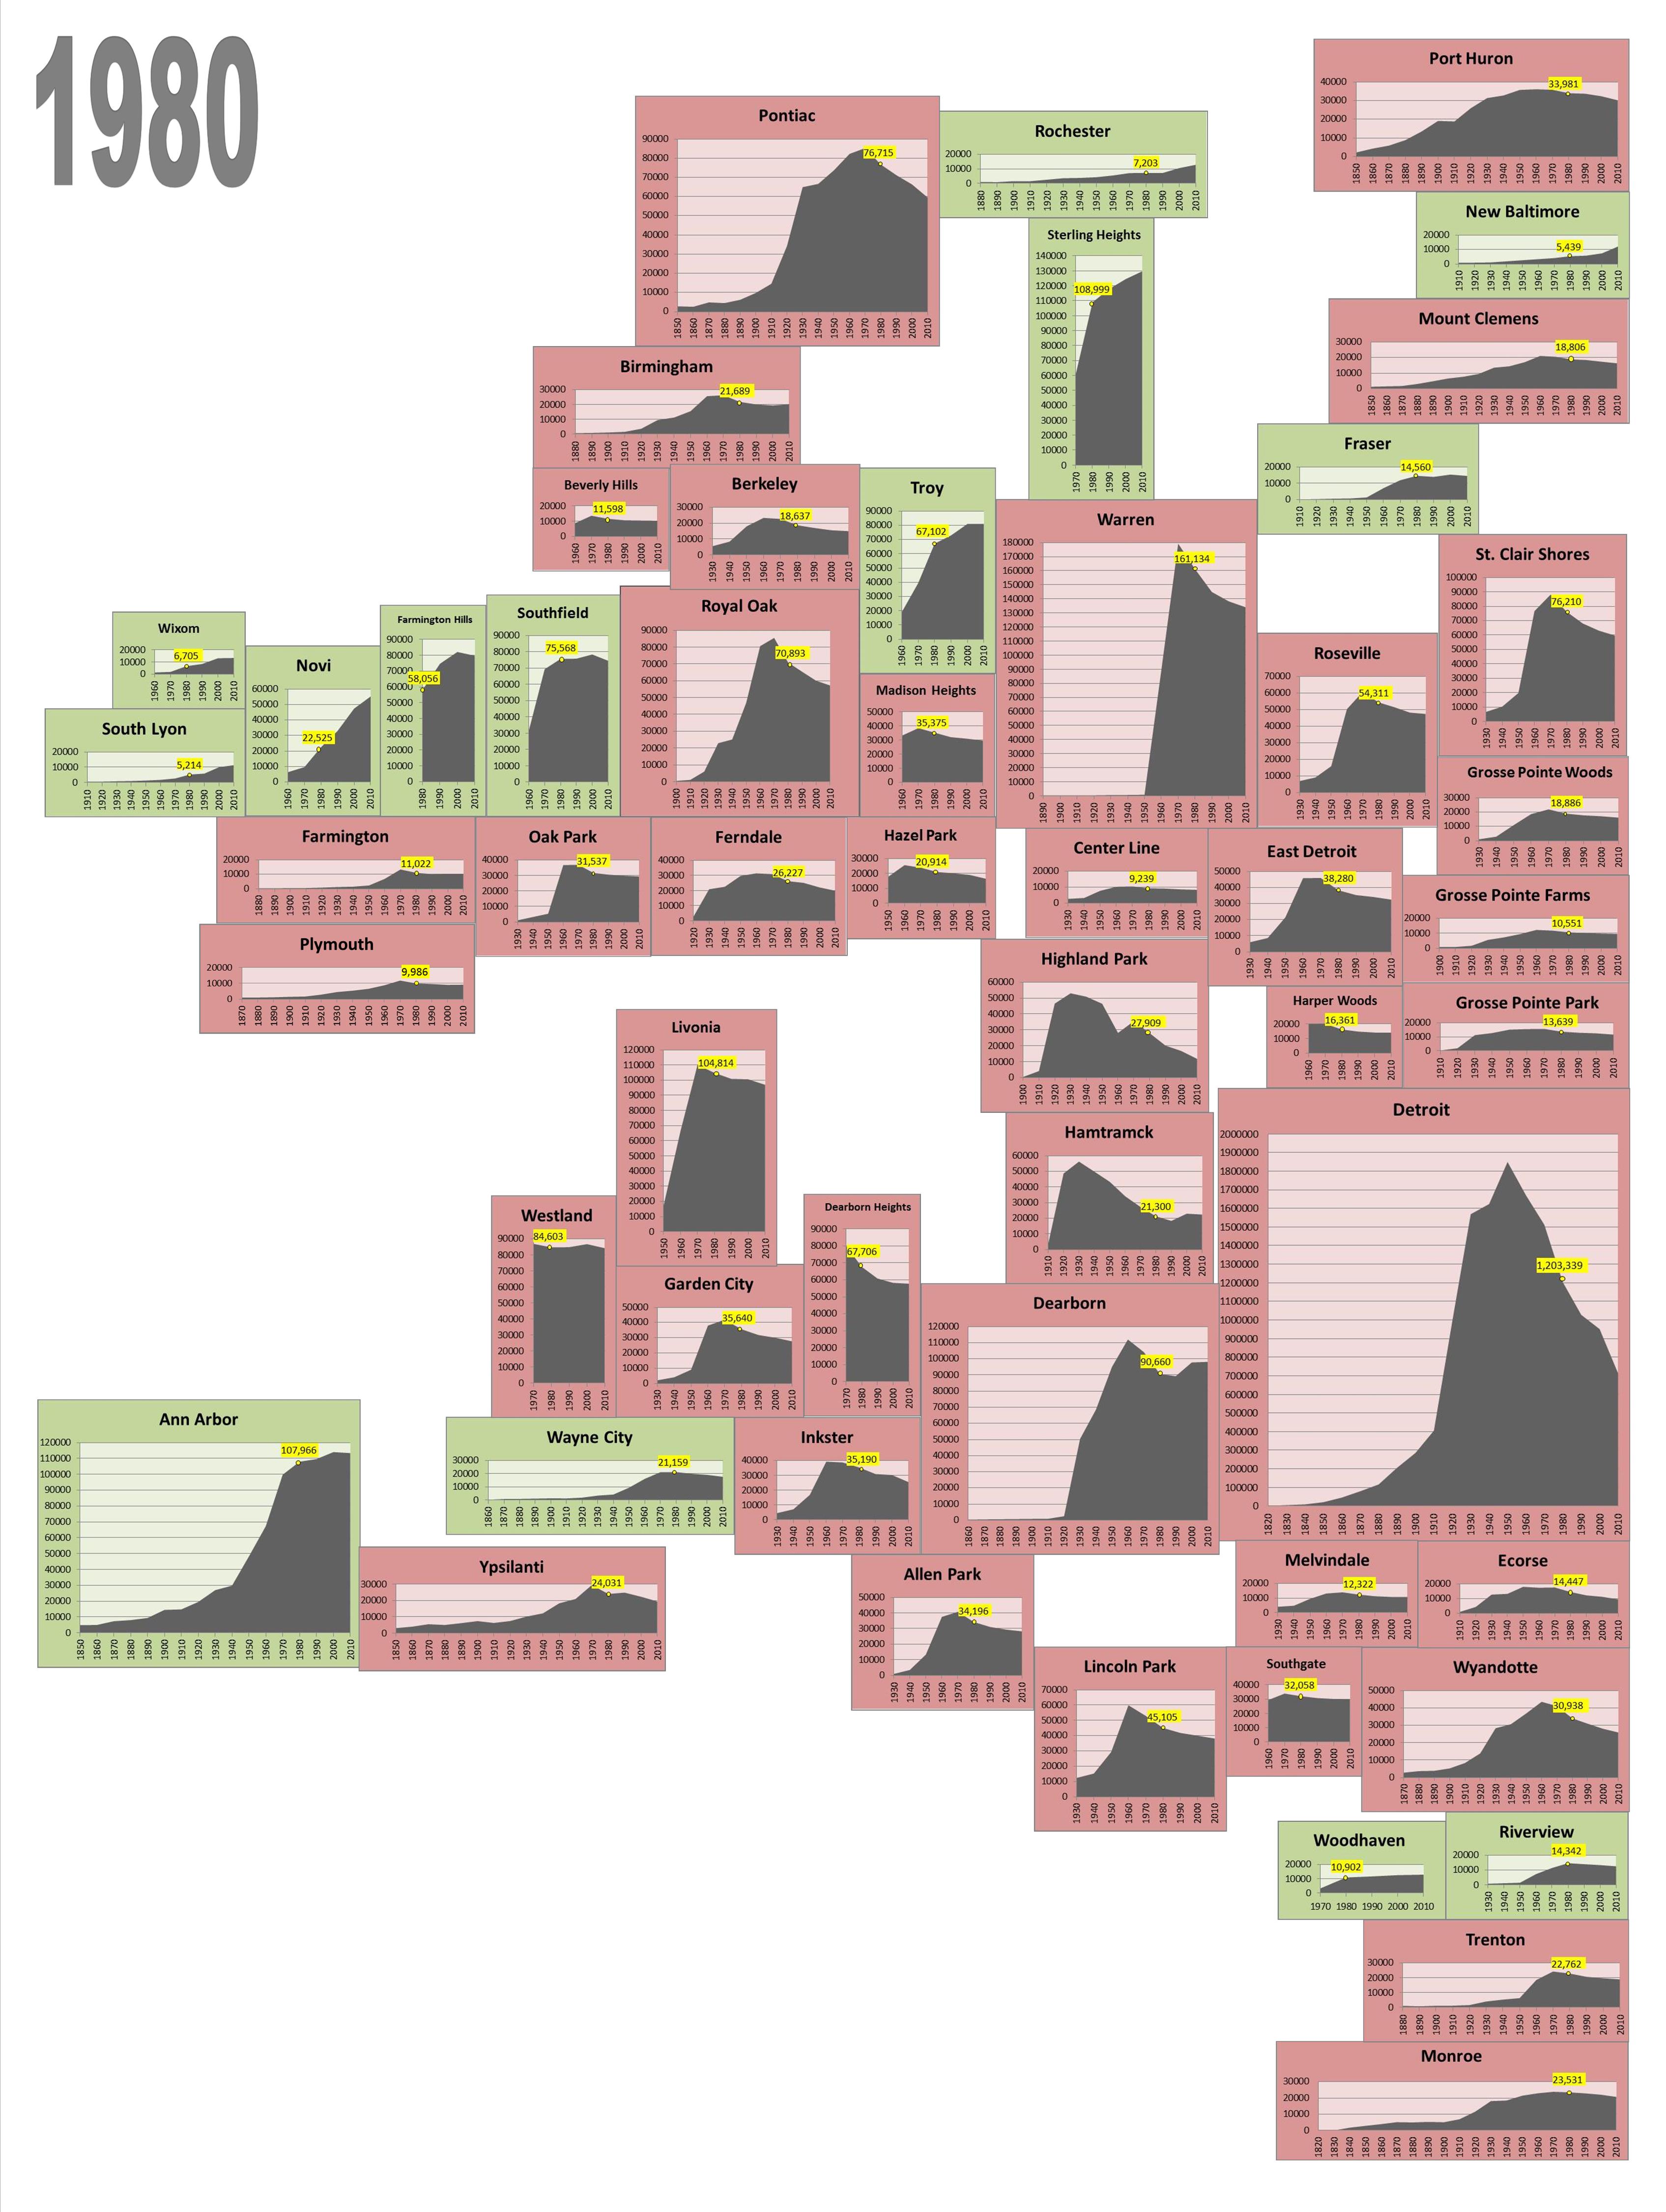
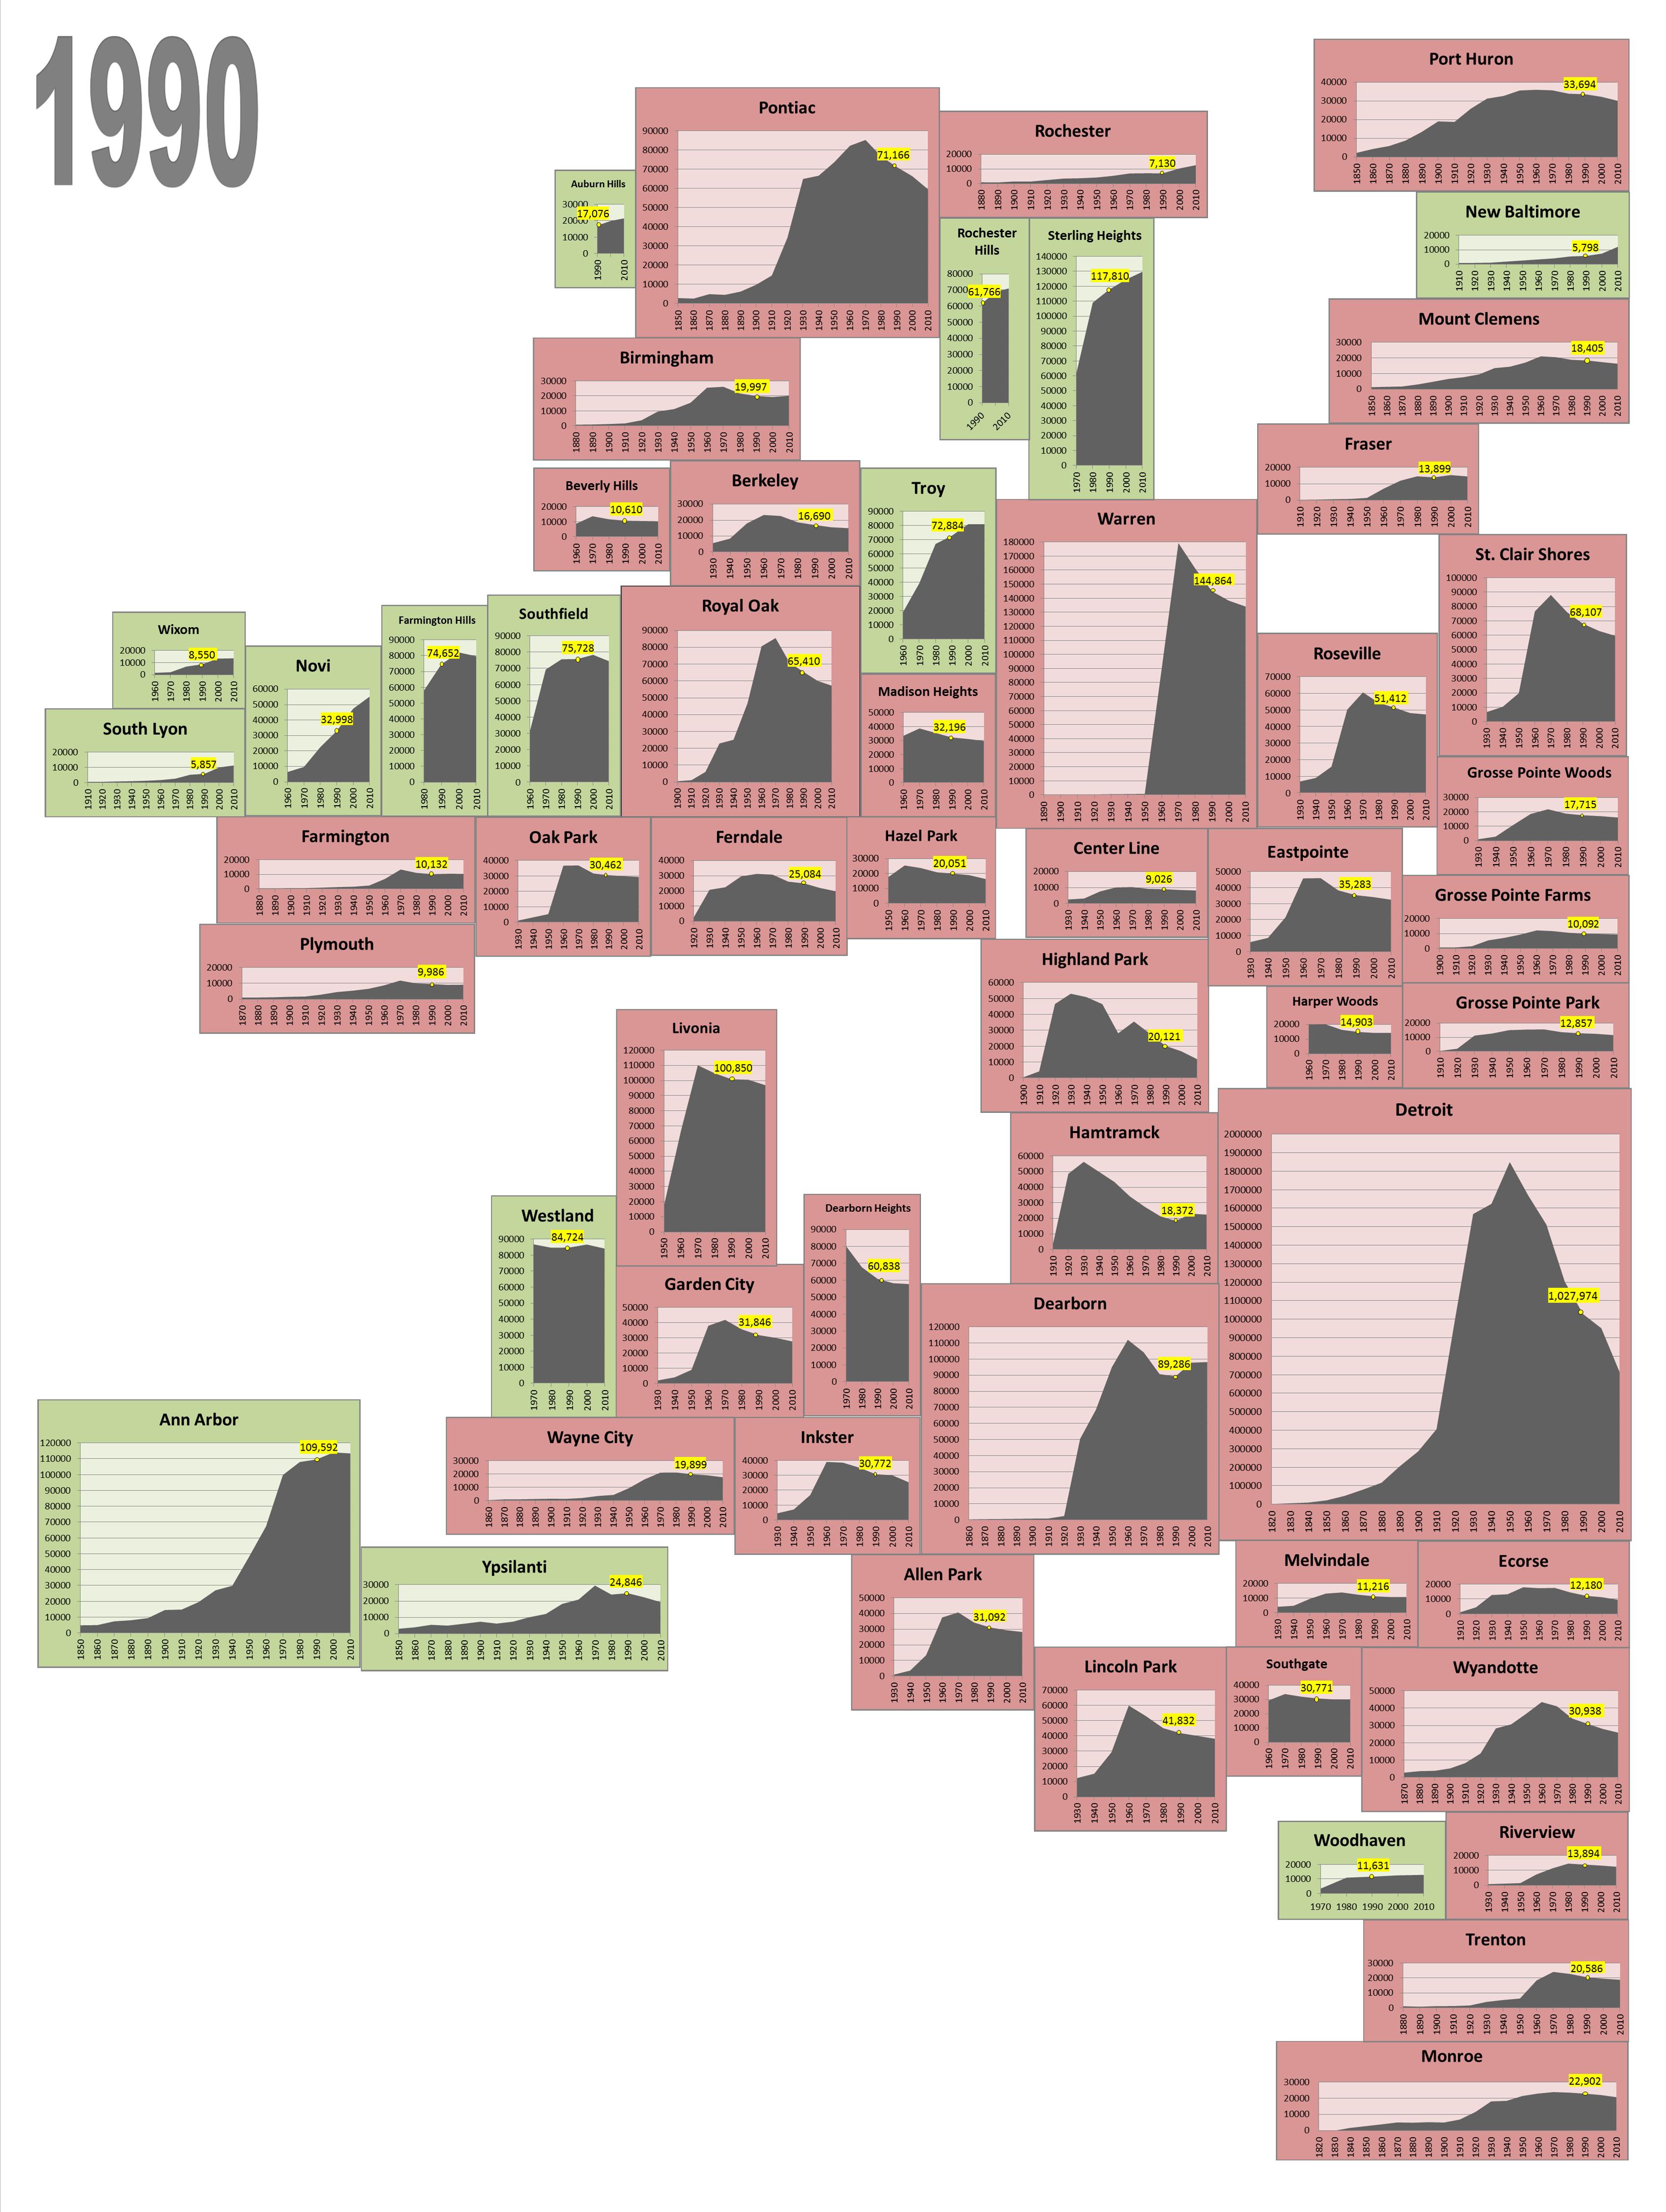
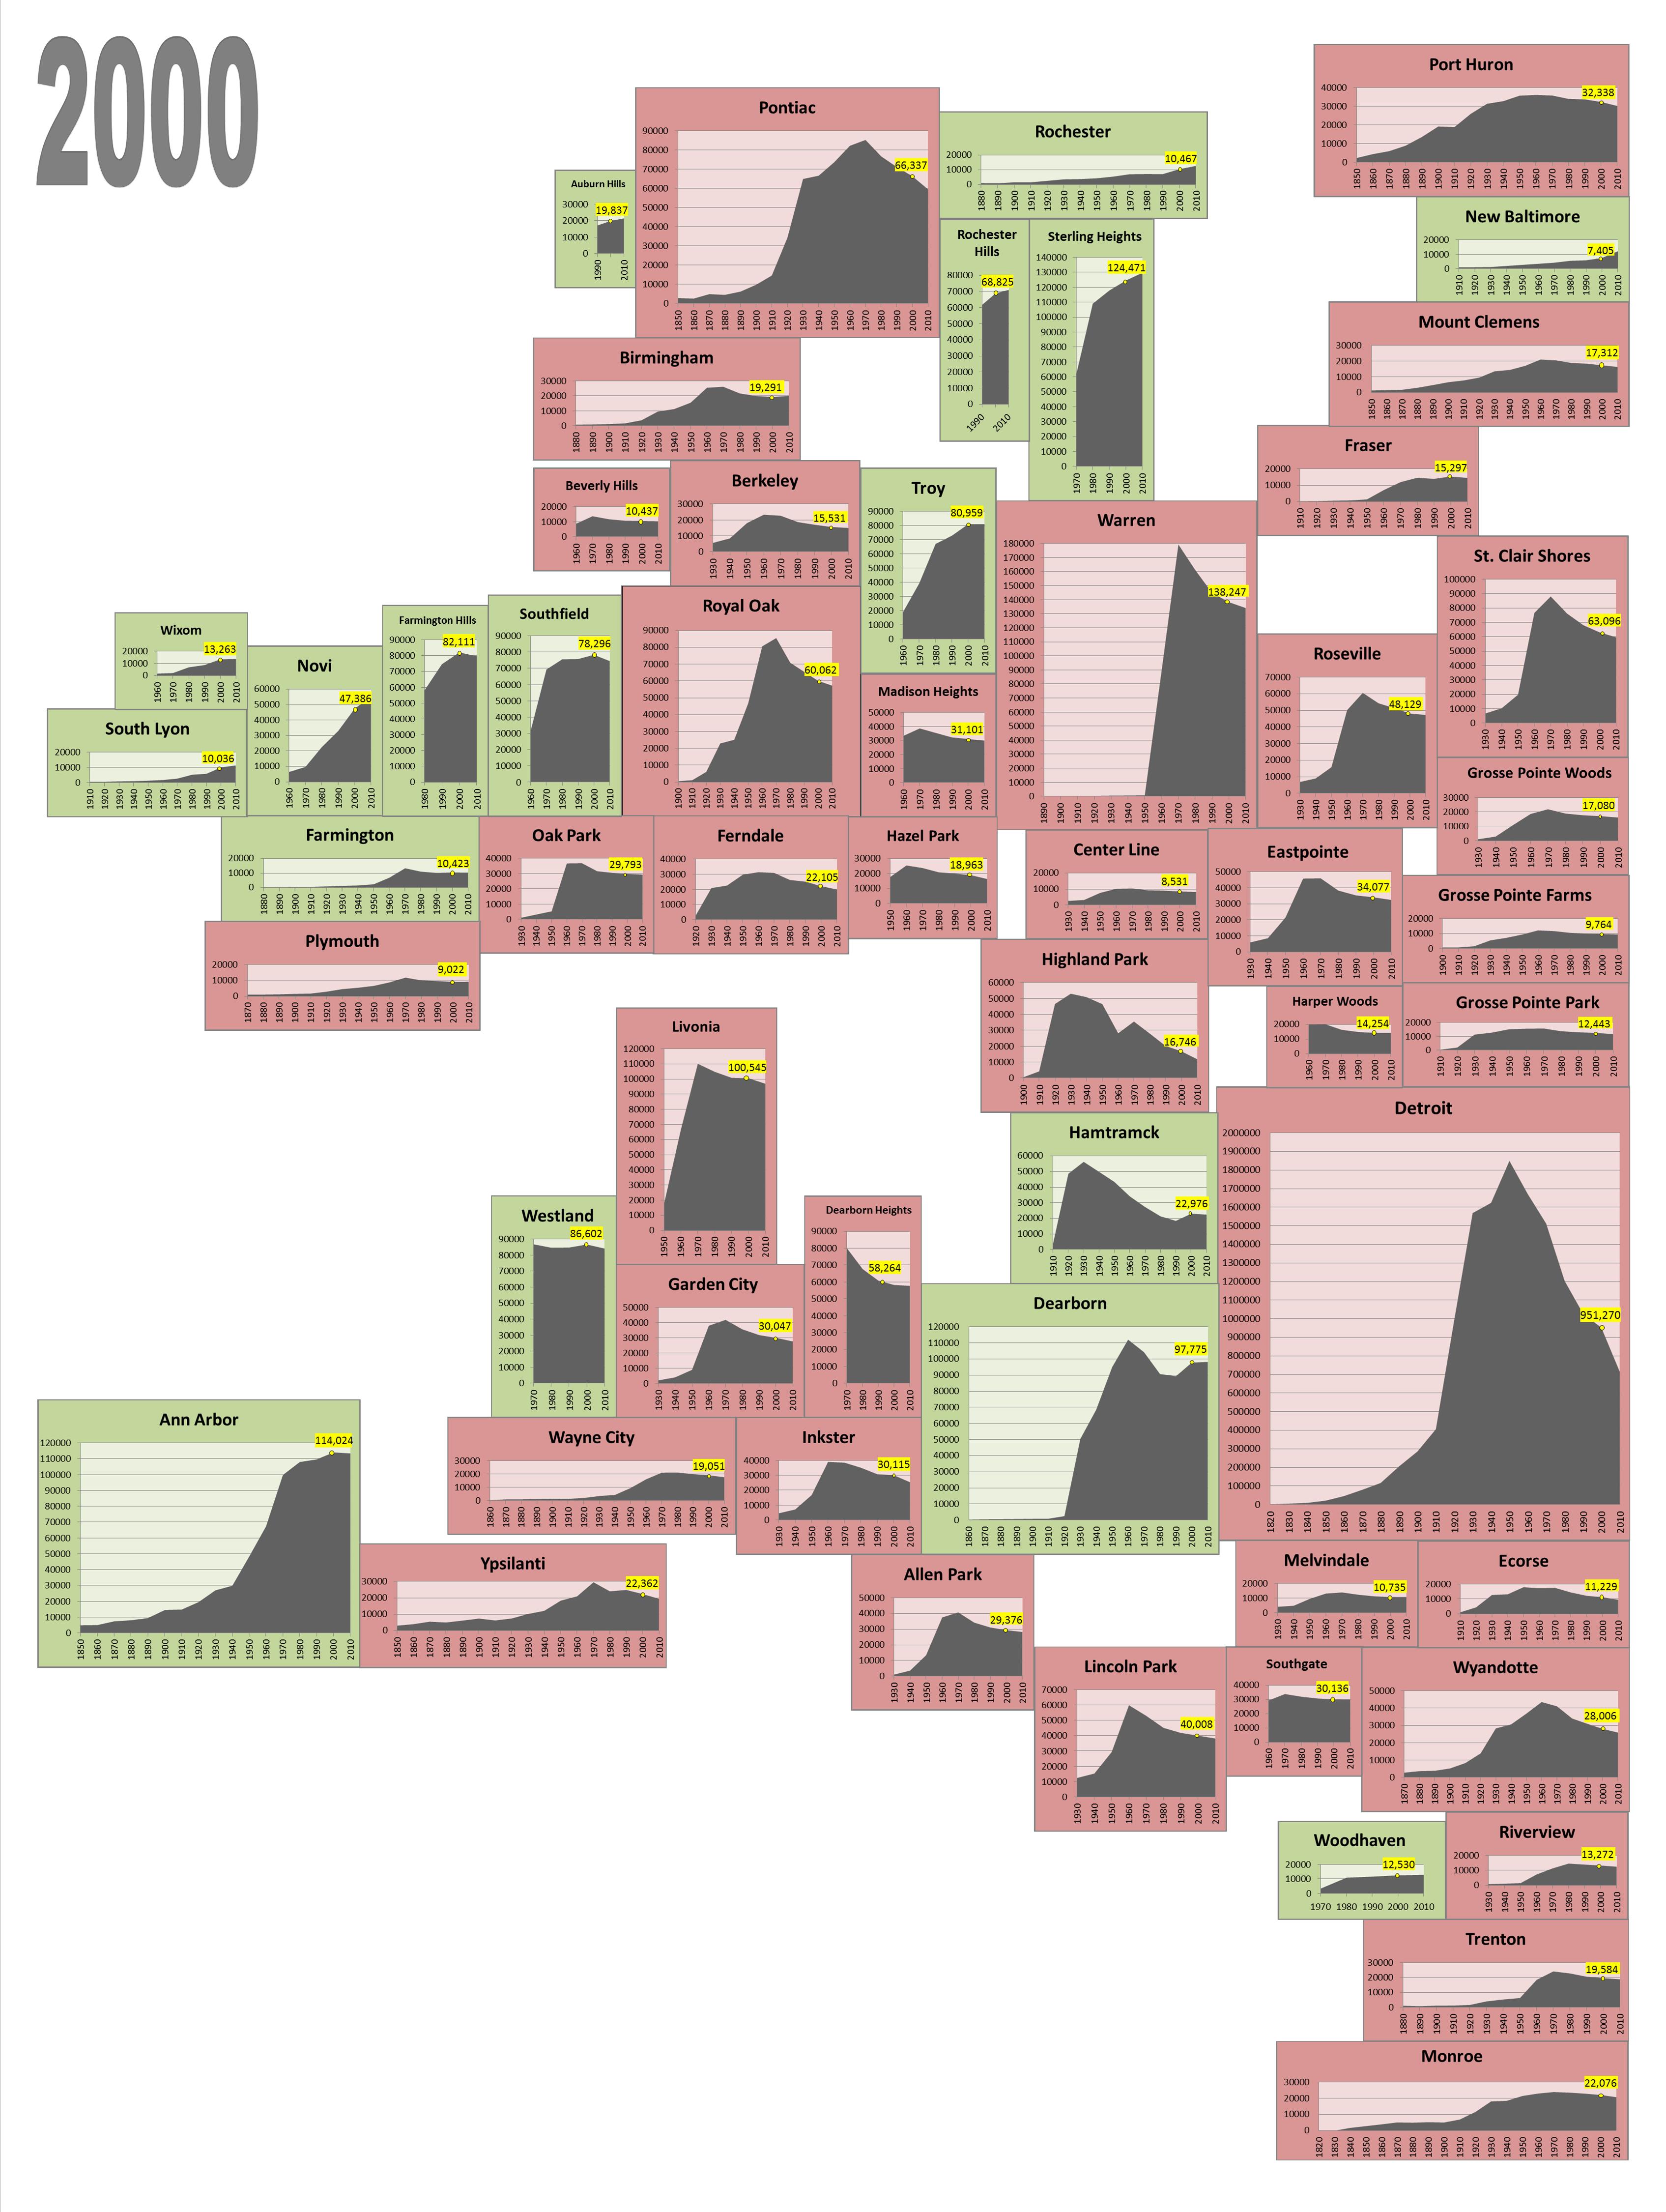
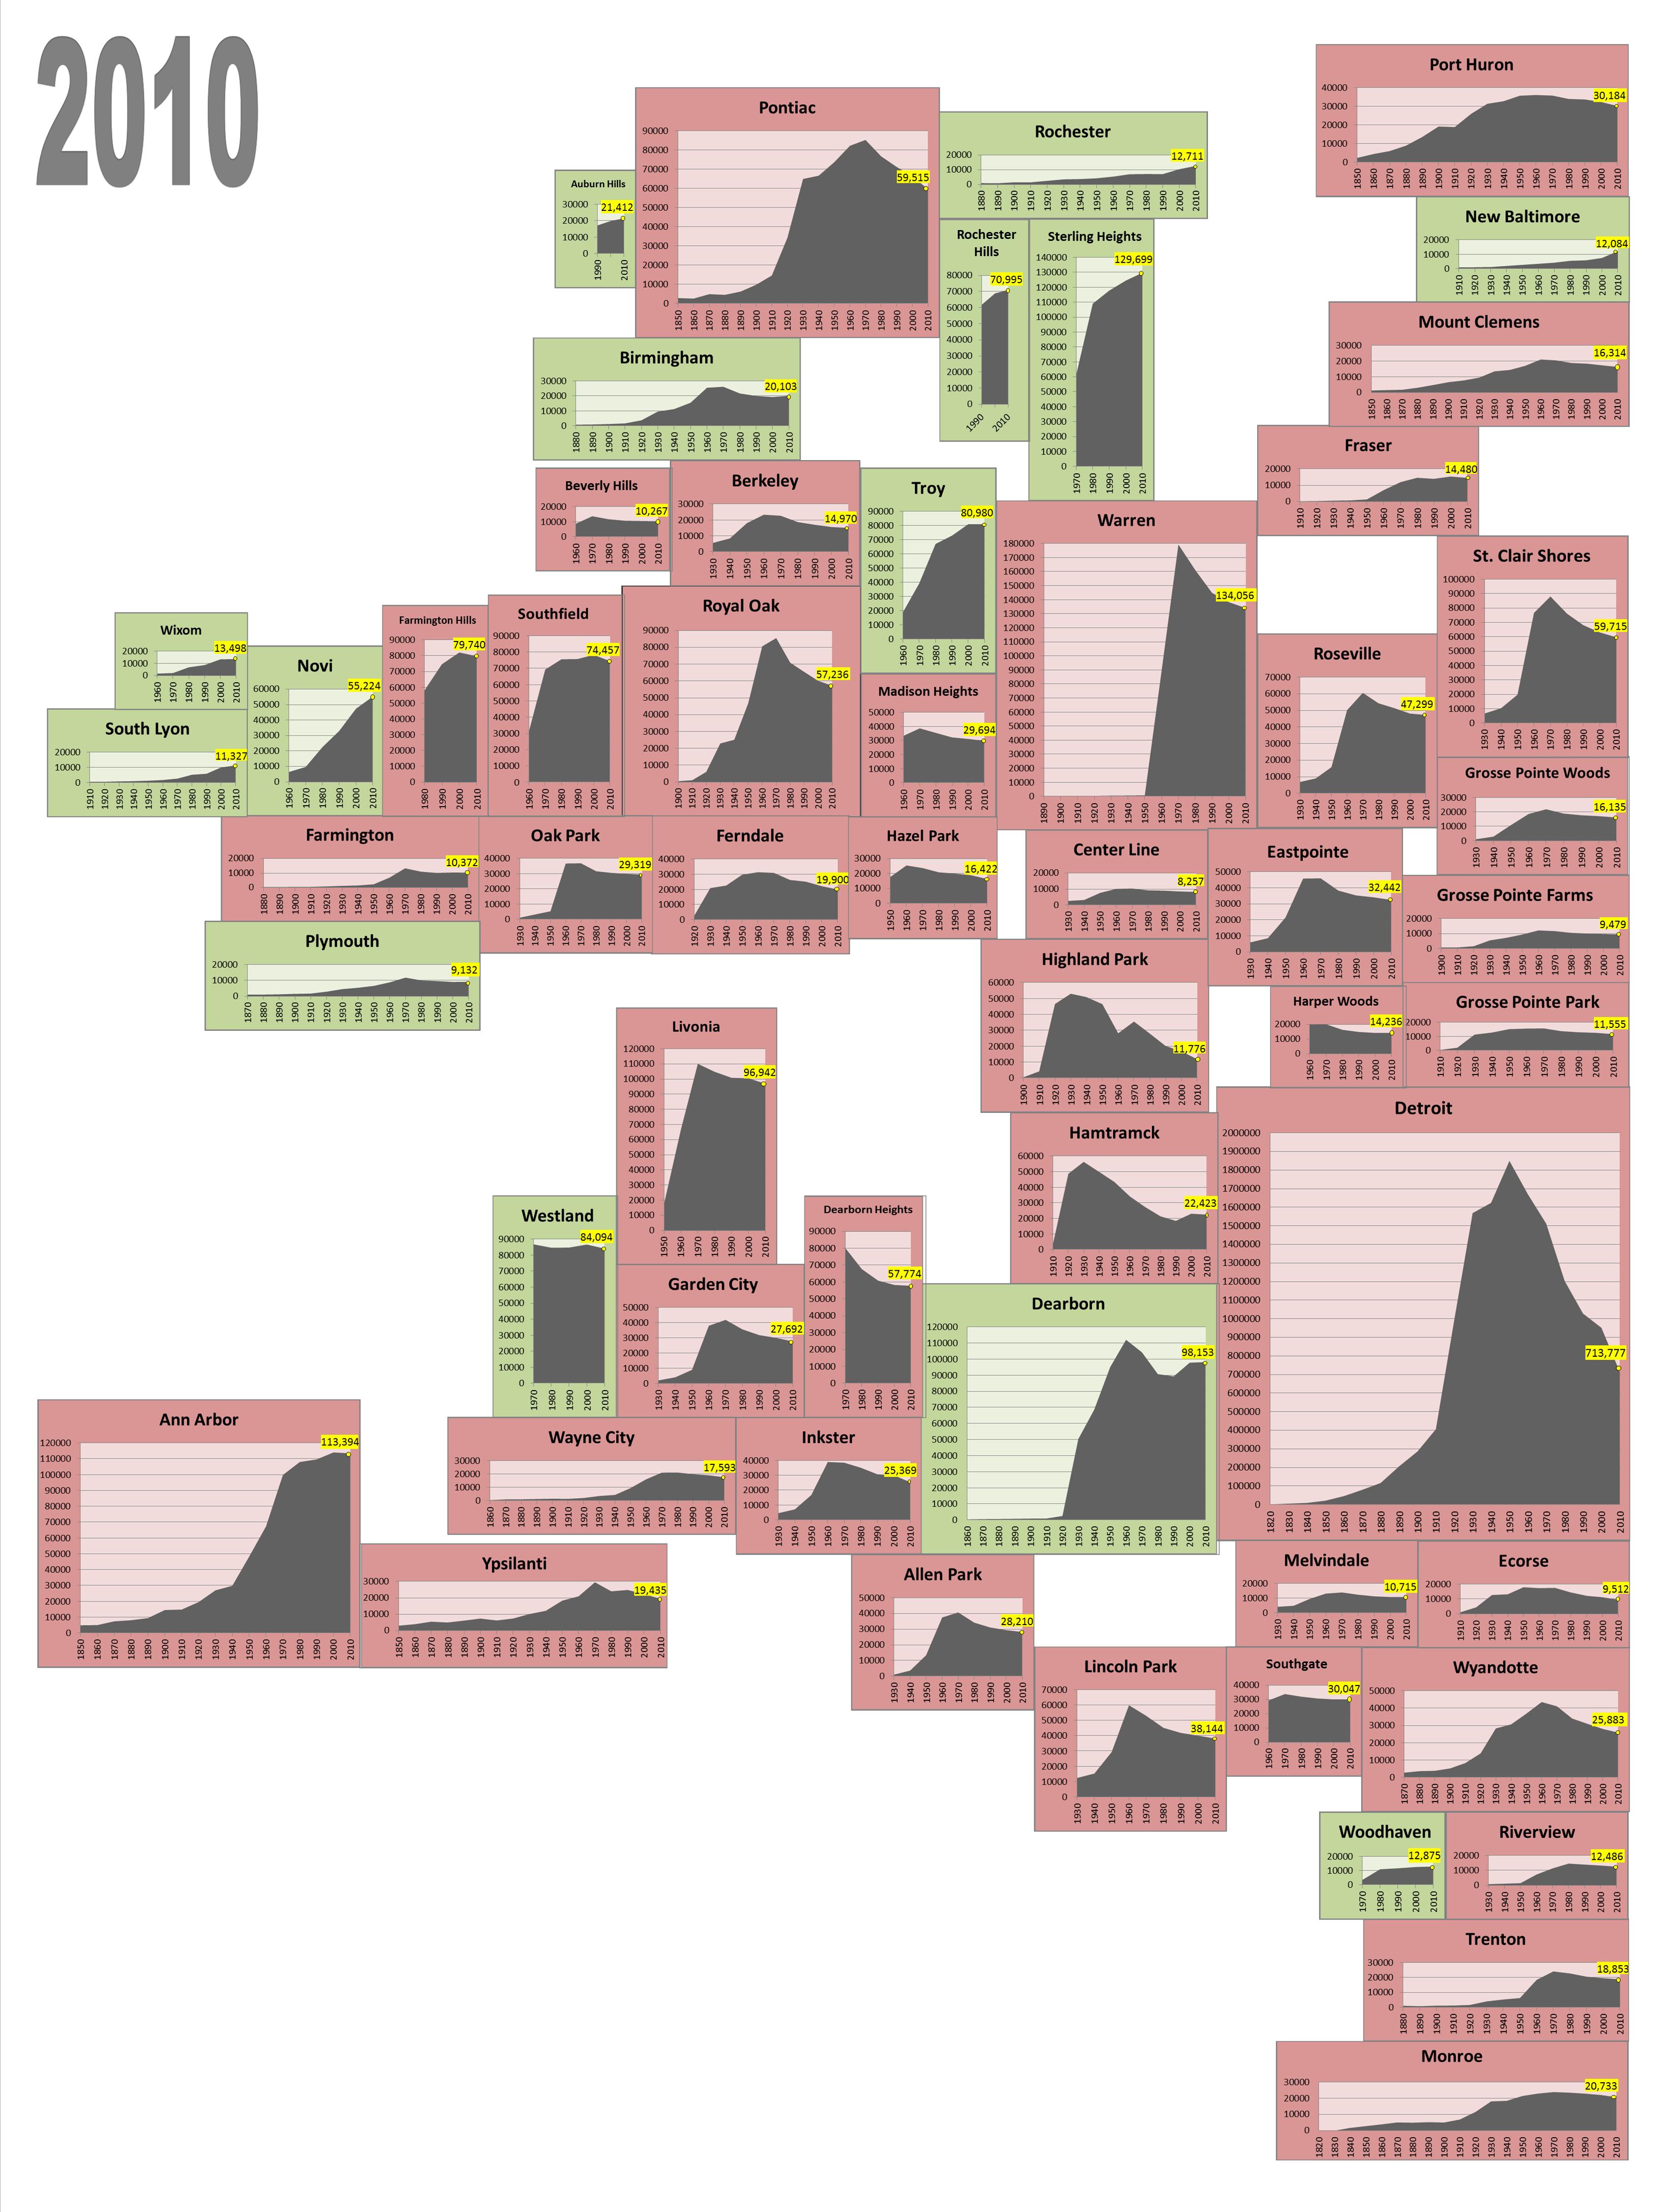
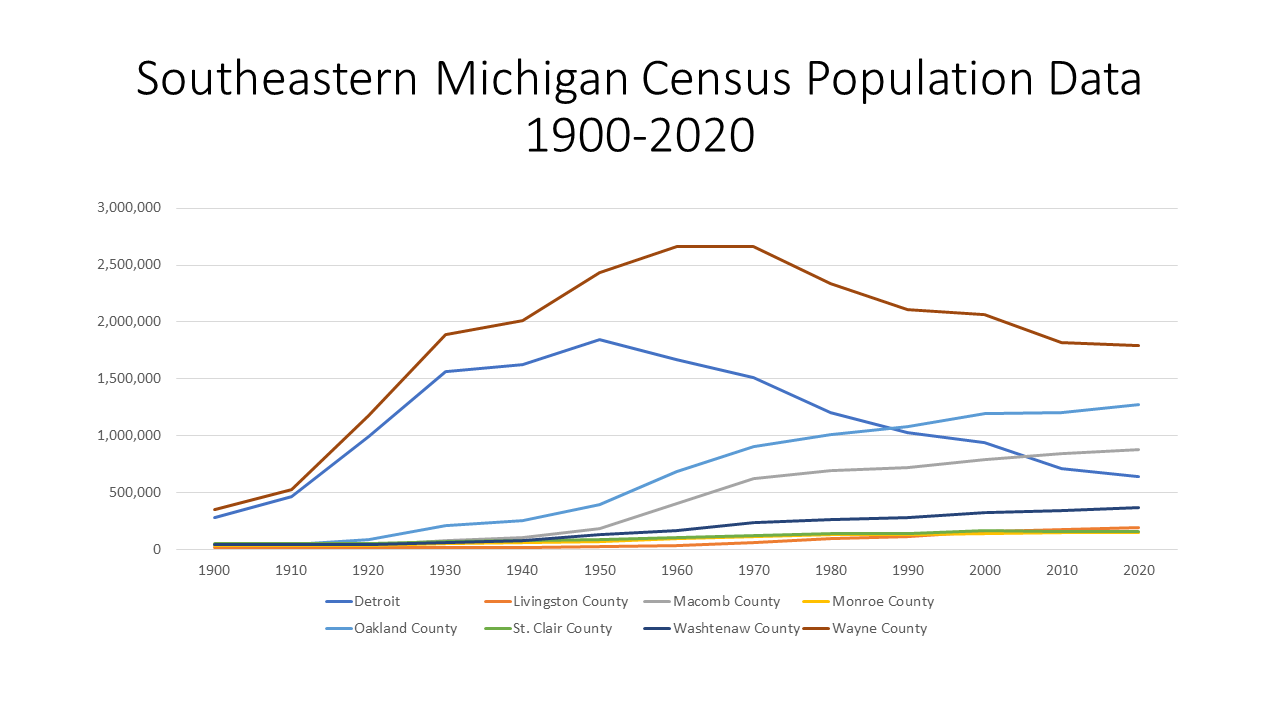
The numbers are in, and according to 2020 Decennial Census data Michigan’s overall population grew to 10,077,331, but Detroit suffered a population loss for yet another decade. According to the recently released data, Detroit’s 2020 population was recorded at 639,111, a decrease from  the 713,777 2010 Census population. The City of Detroit’s population was at one point larger than every other county’s population in the State of Michigan (1.8 million people in 1950), except for Wayne County (it is located in Wayne County. However, as the first chart below shows, that began to change in 1990 when Oakland County’s population exceeded Detroit’s. Then, in 2010, Macomb County’s population also exceeded Detroit’s population. According to the most recent Census data, Oakland County’s population was  1,274,396 and Macomb County’s population was 881,217 in 2020. Wayne County, including the City of Detroit, still has the largest population in Michigan at 1,793,561. However, Wayne County also continues to lose population, in part because of Detroit’s population loss.

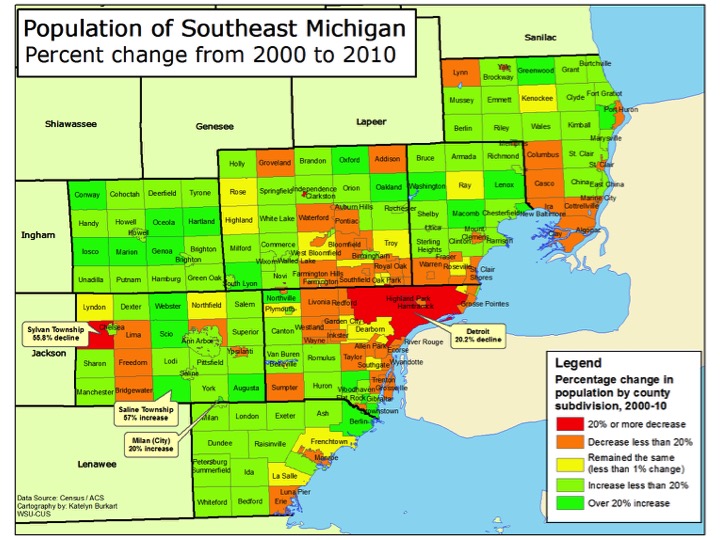
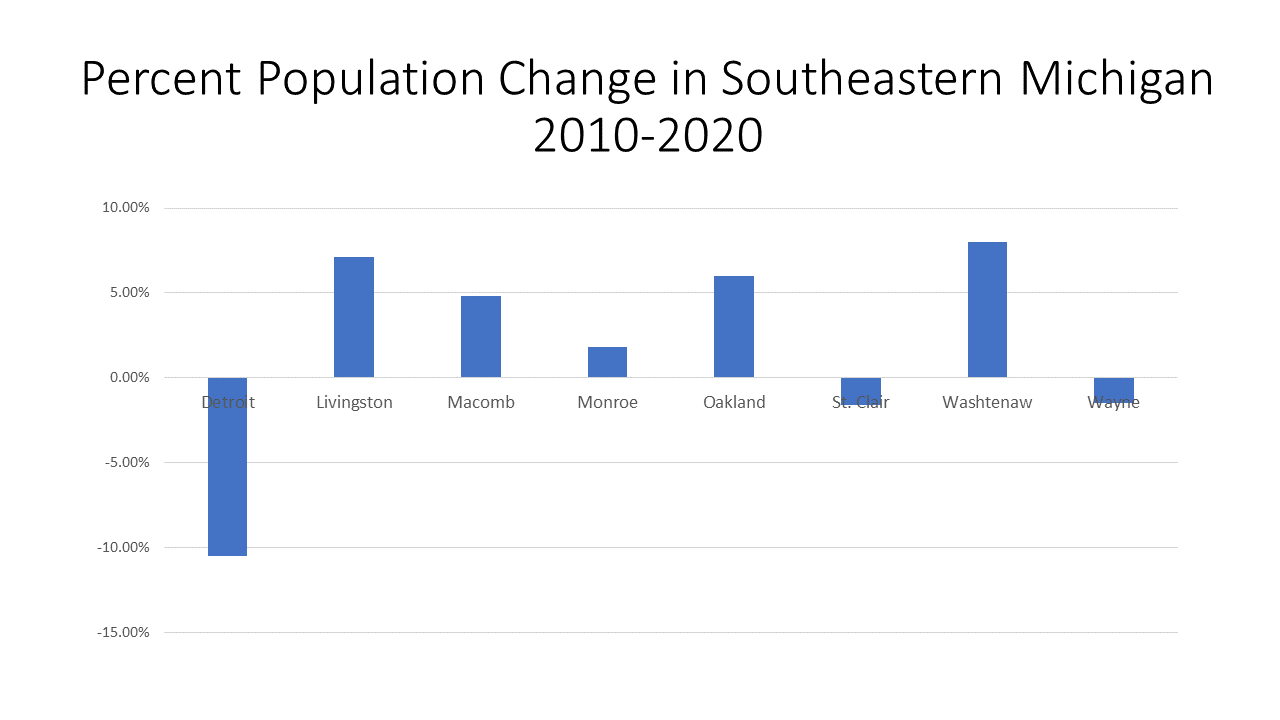
Between 2010 and 2020, the City of Detroit and St. Clair and Wayne counties were the only large units of government to lose members of their population. The City of Detroit had the largest percent loss at 10.5 percent, or 74,666 people. Wayne County experienced a 1.5 percent loss (27,023) and St. Clair County experienced a 1.6 percent loss (2,657). Tax foreclosures have been cited as a reason for the Detroit’s continued population loss.  Note, however, that Detroit lost fewer people in the last decade than the previous decade–74,666 from 2010 to 2020, compared to the 201,530 population loss between 2000 and 2010.  Detroit Mayor Mike Duggan said he plans to appeal the recently released Census numbers for the City, as he firmly believes they are inaccurate. Part of his reasoning? The 2020 Census accounted for 254,000 occupied households but according to DTE there are about 280,000 residential households paying electric bills. In comparing these two data points, there is a discrepancy of 25,000 occupied houses with running electricity—housing units he thinks the Census missed. 

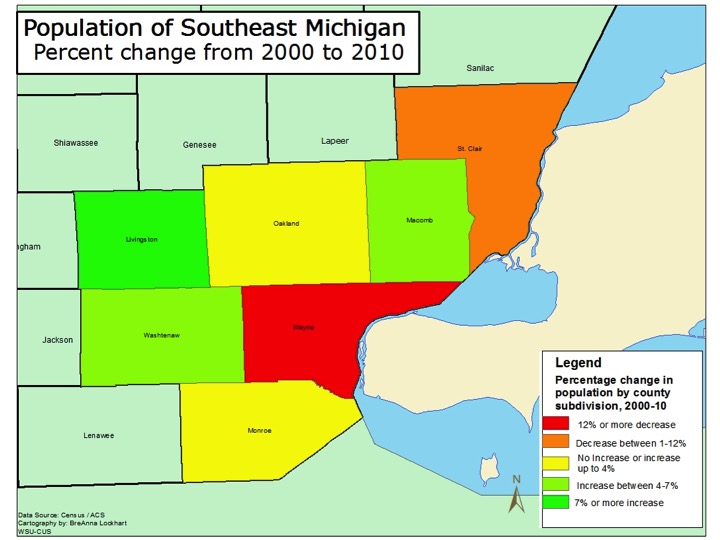
Wayne County officials on the other hand recognize that population loss continued, but chose to see progress since the total loss between 2010 and 2020 was about 27,000 people whereas, between 2000 and 2010, the population loss was about 240,000 residents, so there has been a substantial decline in the loss. According to a recent Free Press article, part of population loss Wayne County experienced was due to the loss Detroit experienced, but that was offset by population gains in other municipalities in Wayne County. Furthermore, a large portion of the State’s population remains concentrated in Wayne County (about 1/5 of the population). 

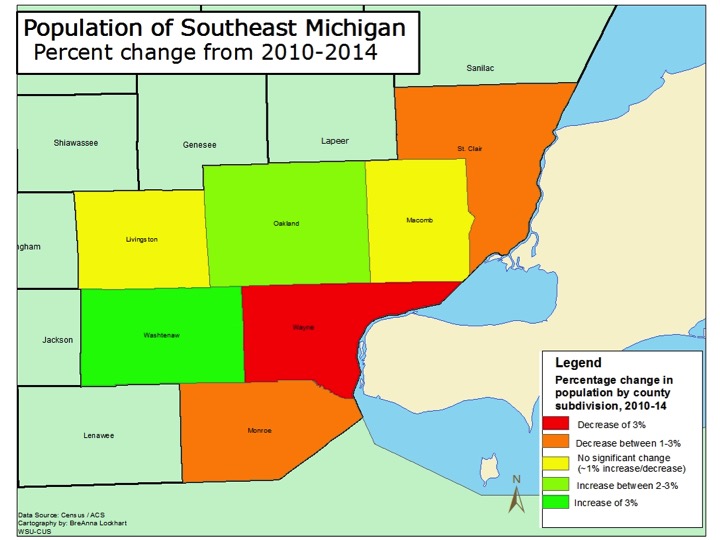
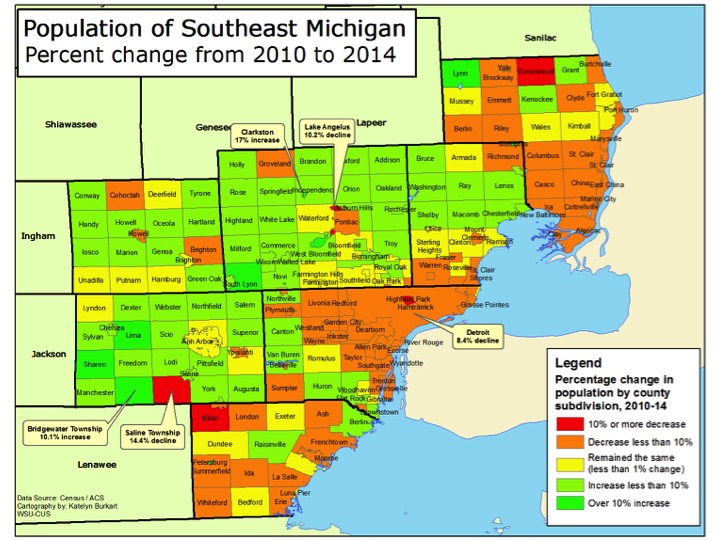
The population loss experienced by Detroit and Wayne and St. Clair counties was likely the gain for other area counties. According to the data, Washtenaw County experienced an 8 percent population increase between 2010 and 2020 (27,467), Livingston County experienced a 7.1 percent increase (12,899), Oakland County experienced a 6 percent population increase (72,034) and Macomb County experienced a 4.8 percent increase (38,865).

In a future post we will also be looking at the population gains and losses at the municipal level in Southeastern Michigan. A few notable regional gains and losses to mention now though are:

Population Gains Above 20 Percent

•Hamtramck, where the population increased 27 percent between 2010 and 2020 (from 22,423 to 28,433)

•Salem Township, where the population increased 25 percent ( from 5,627 to 7,018);

•Oceala Township, where the population increased 23 percent (from 11,936 to 14,623);

•Lima Township, where the population increased 22 percent (from 3,307 to 4,024)

•Dundee Township, where the population increased 21 percent (from 6,759 to 8,145);

•Saline Township, where the population increased 20 percent (from 1,896 to 2,277);

•Novi Township, where the population increased 20 percent (from 55,224 to 66,243);

Population Losses Above 10 Percent

•Scio Township, where the population decreased by 13 percent between 2010 and 2020 (from 20,0081 to 17,552); •Detroit, where the population decreased by 10.5 percent (from 713,777 to 639,111).

With population changes comes changes in demographics as well. For example, in Detroit, the Hispanic white population grew to make up 9.5 percent of the City’s demographic and the Hispanic or Latino population to grew to makeup 8 percent of the population.

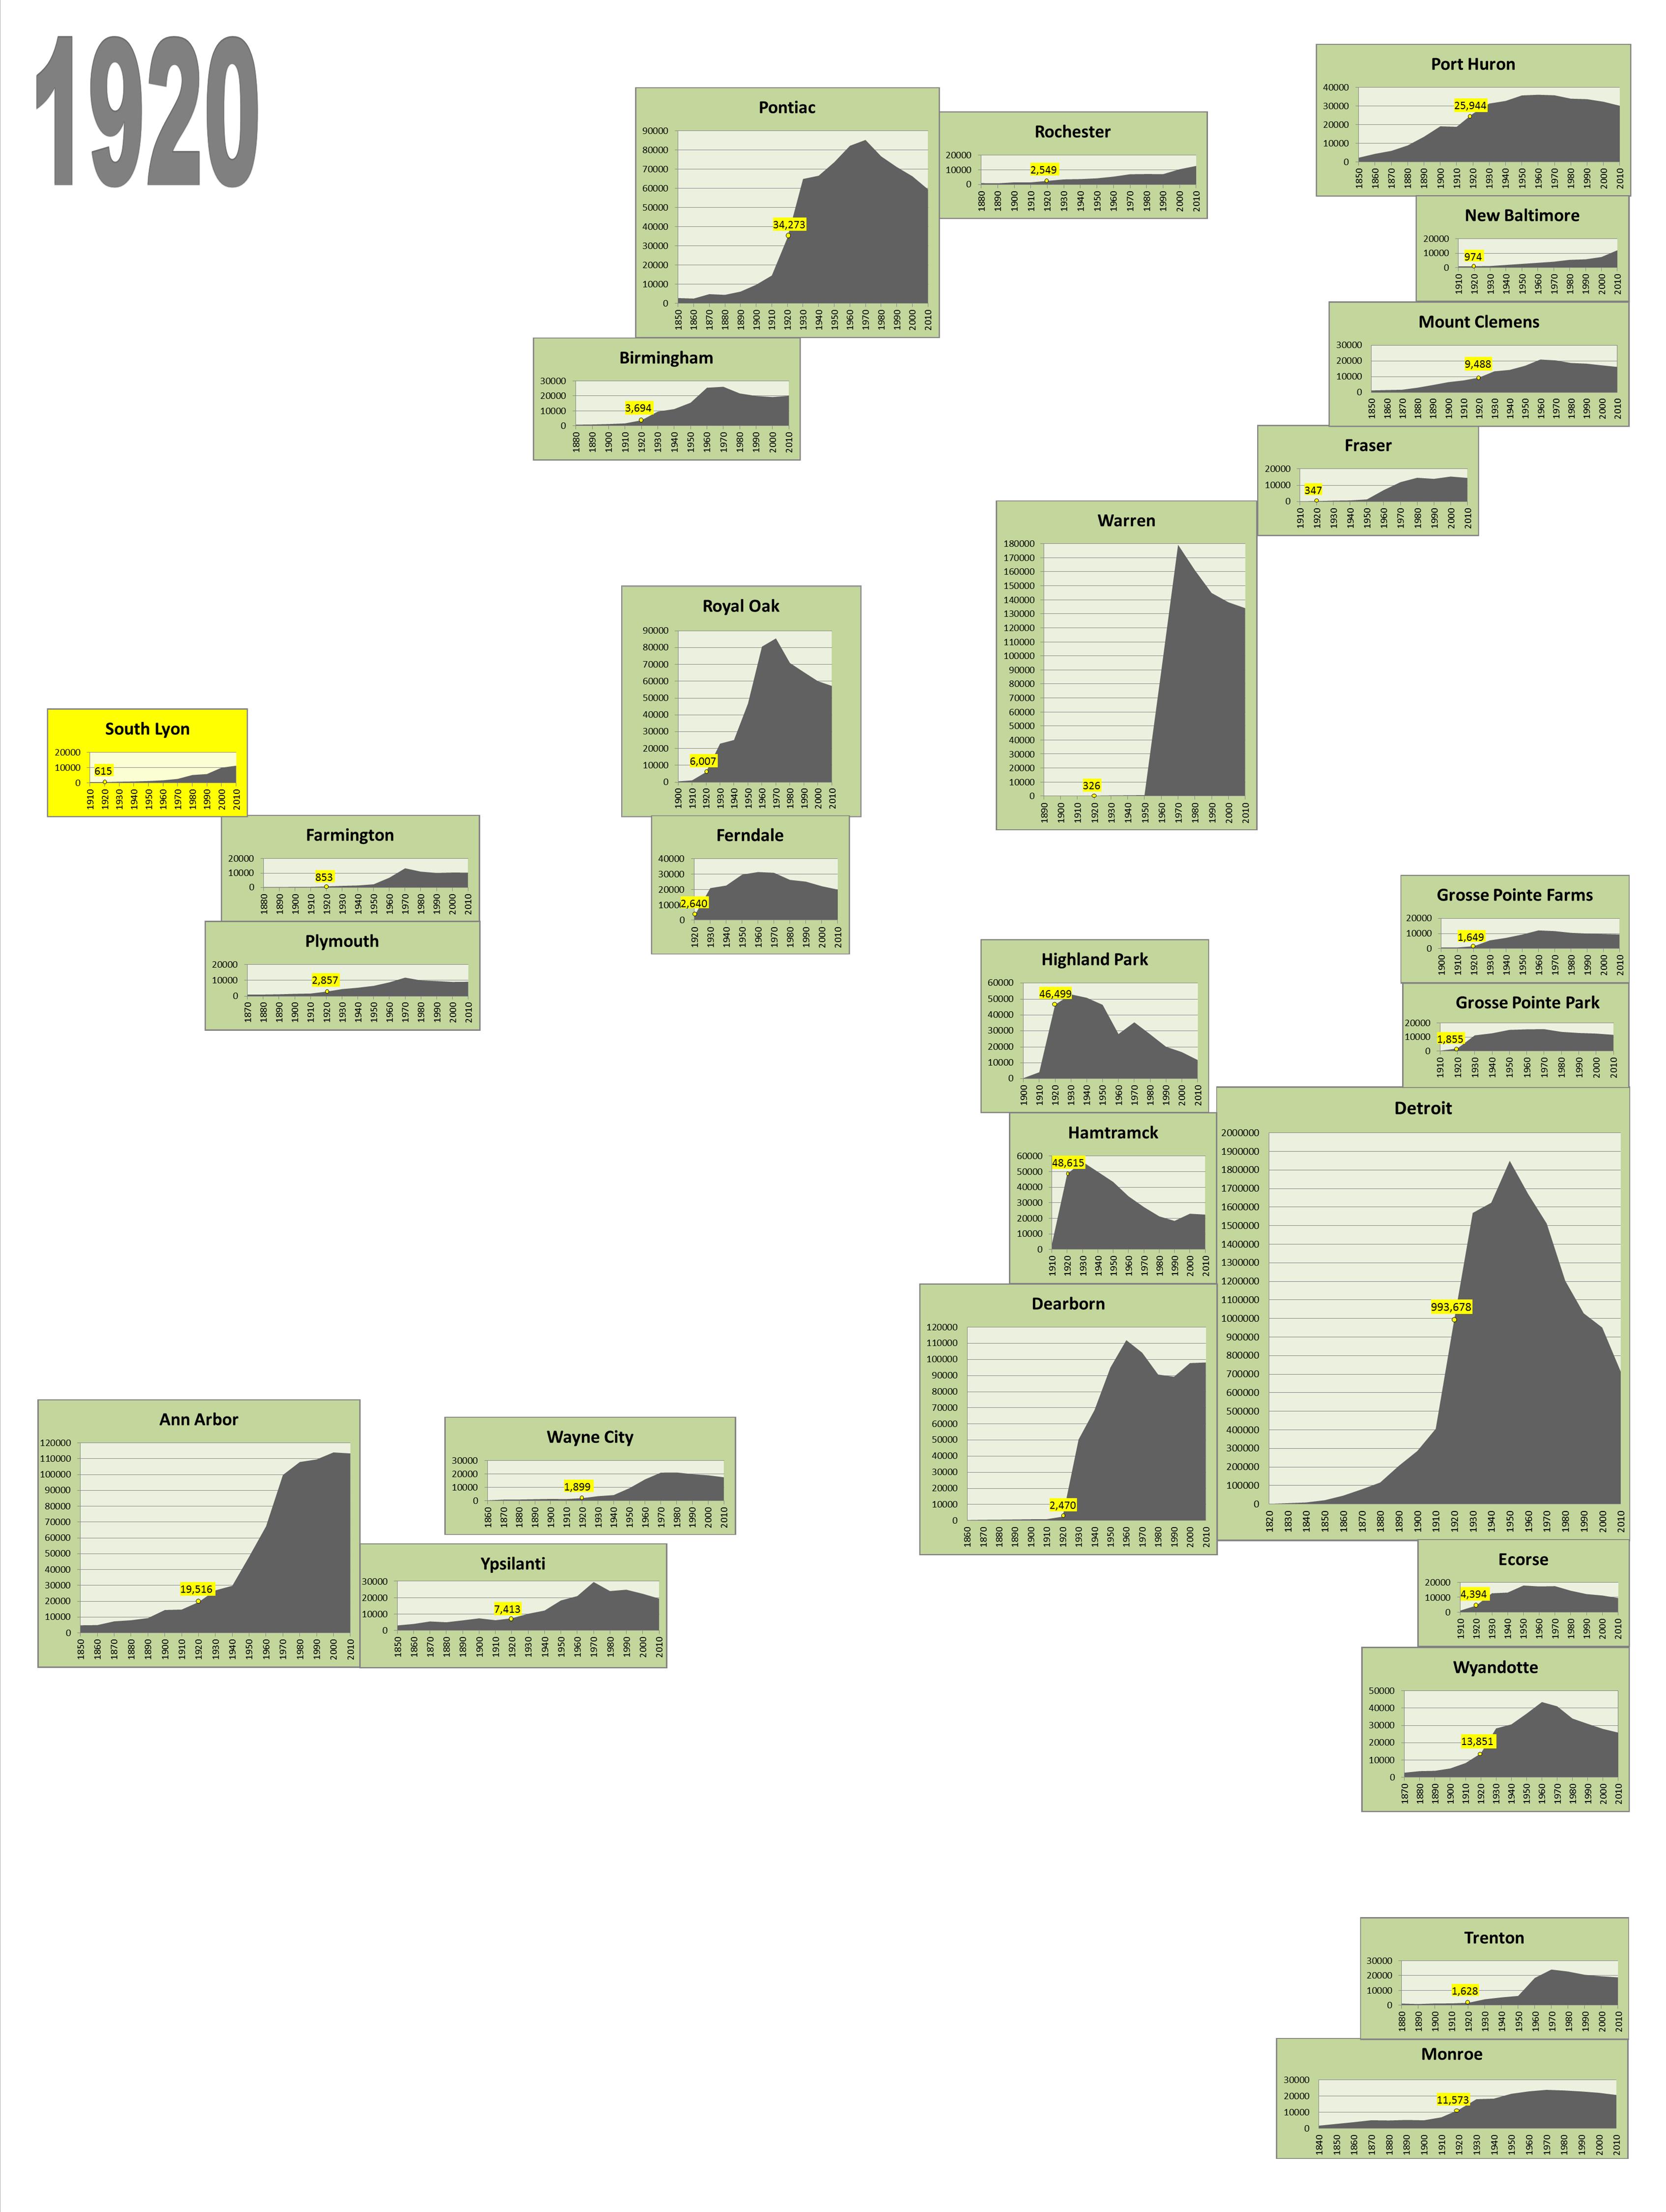
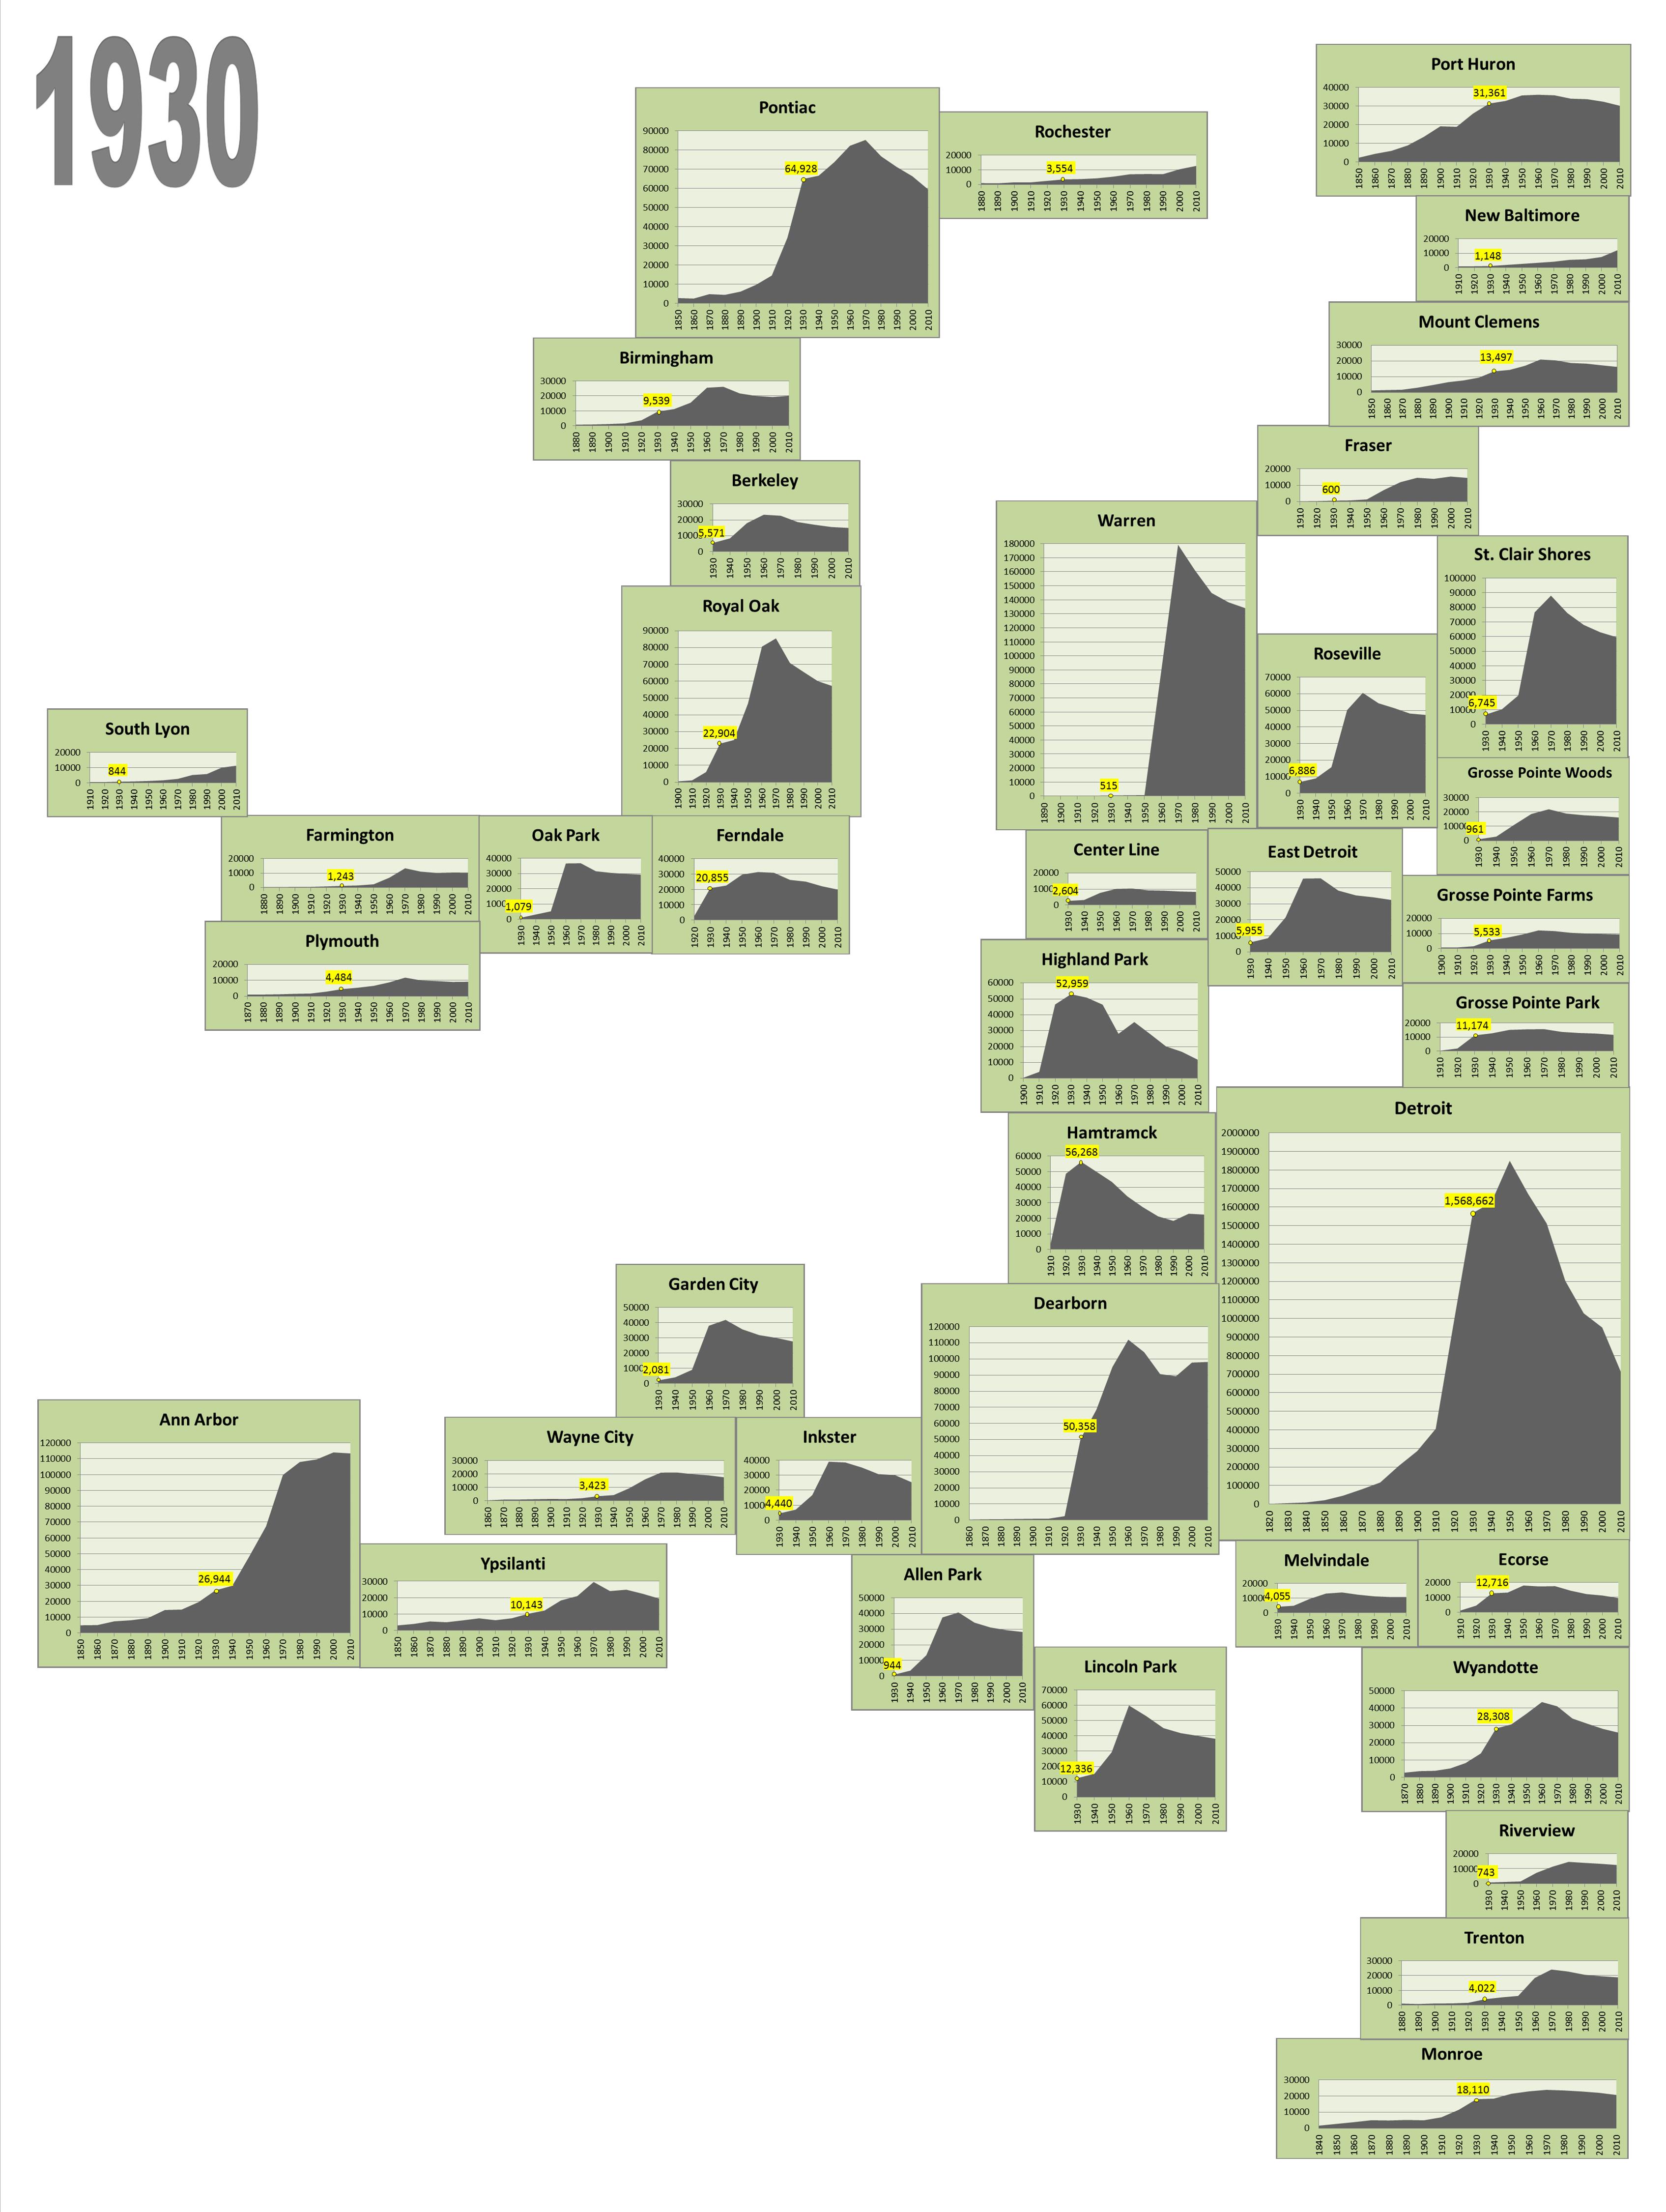
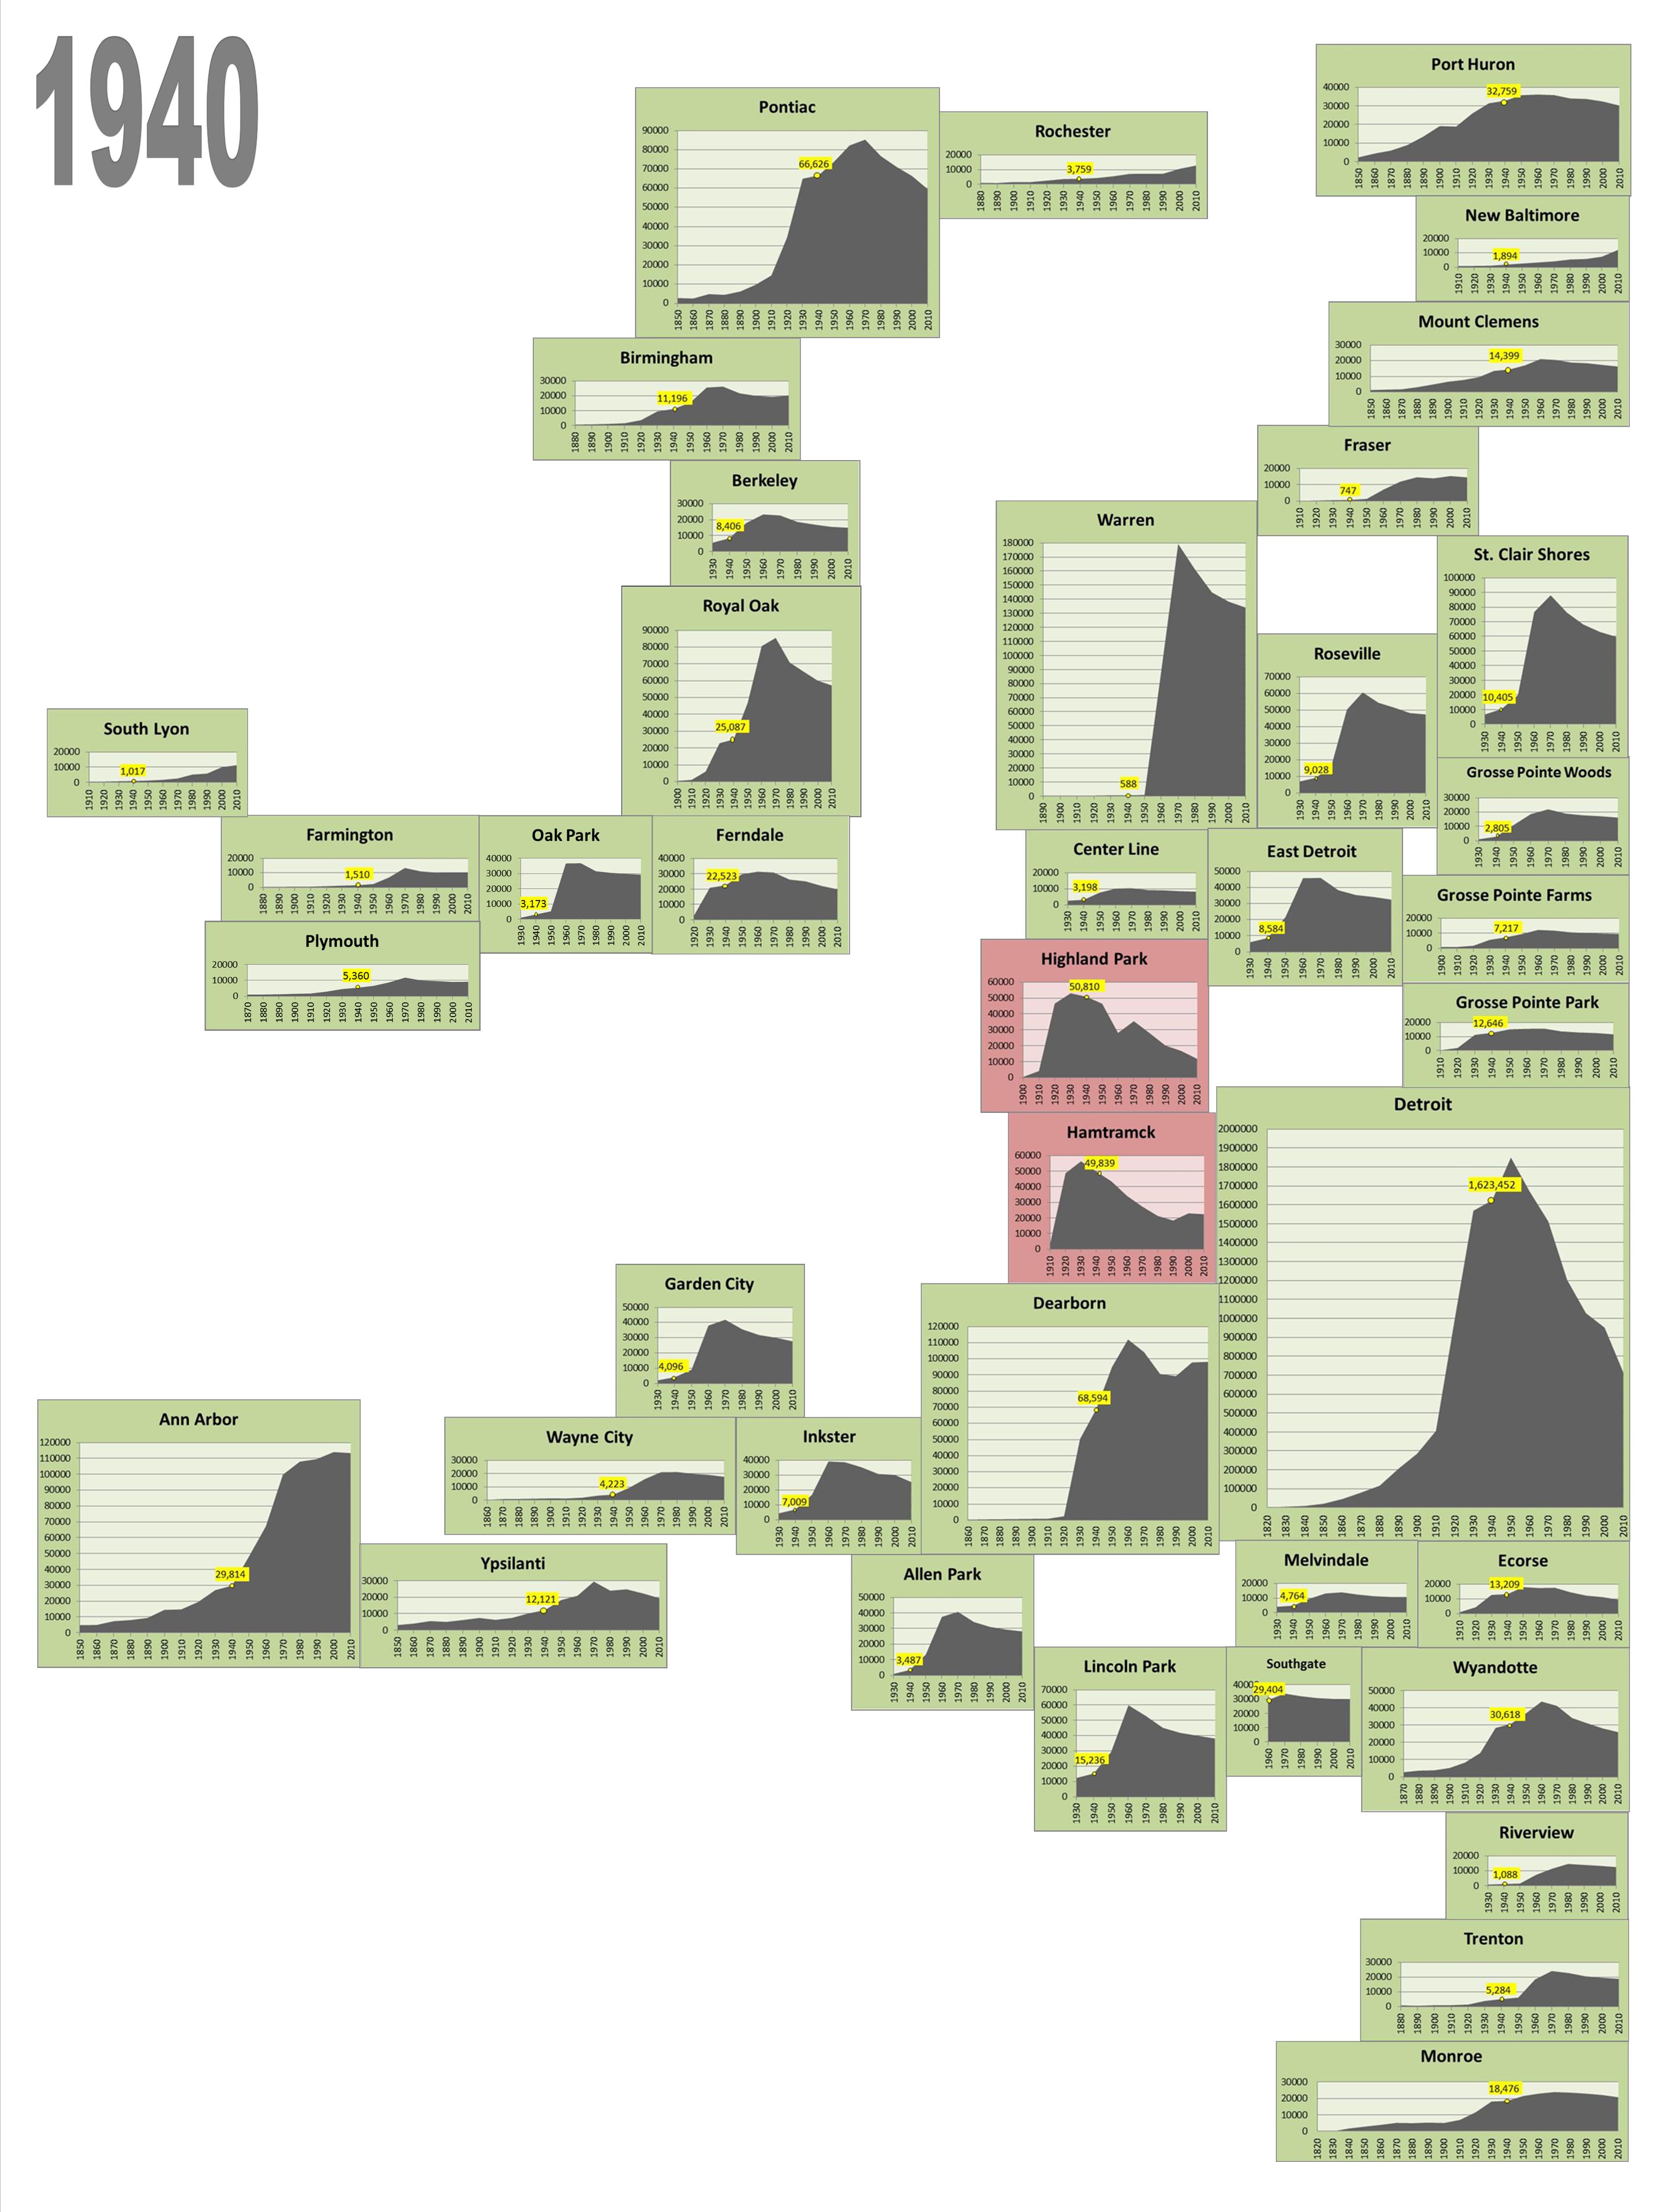
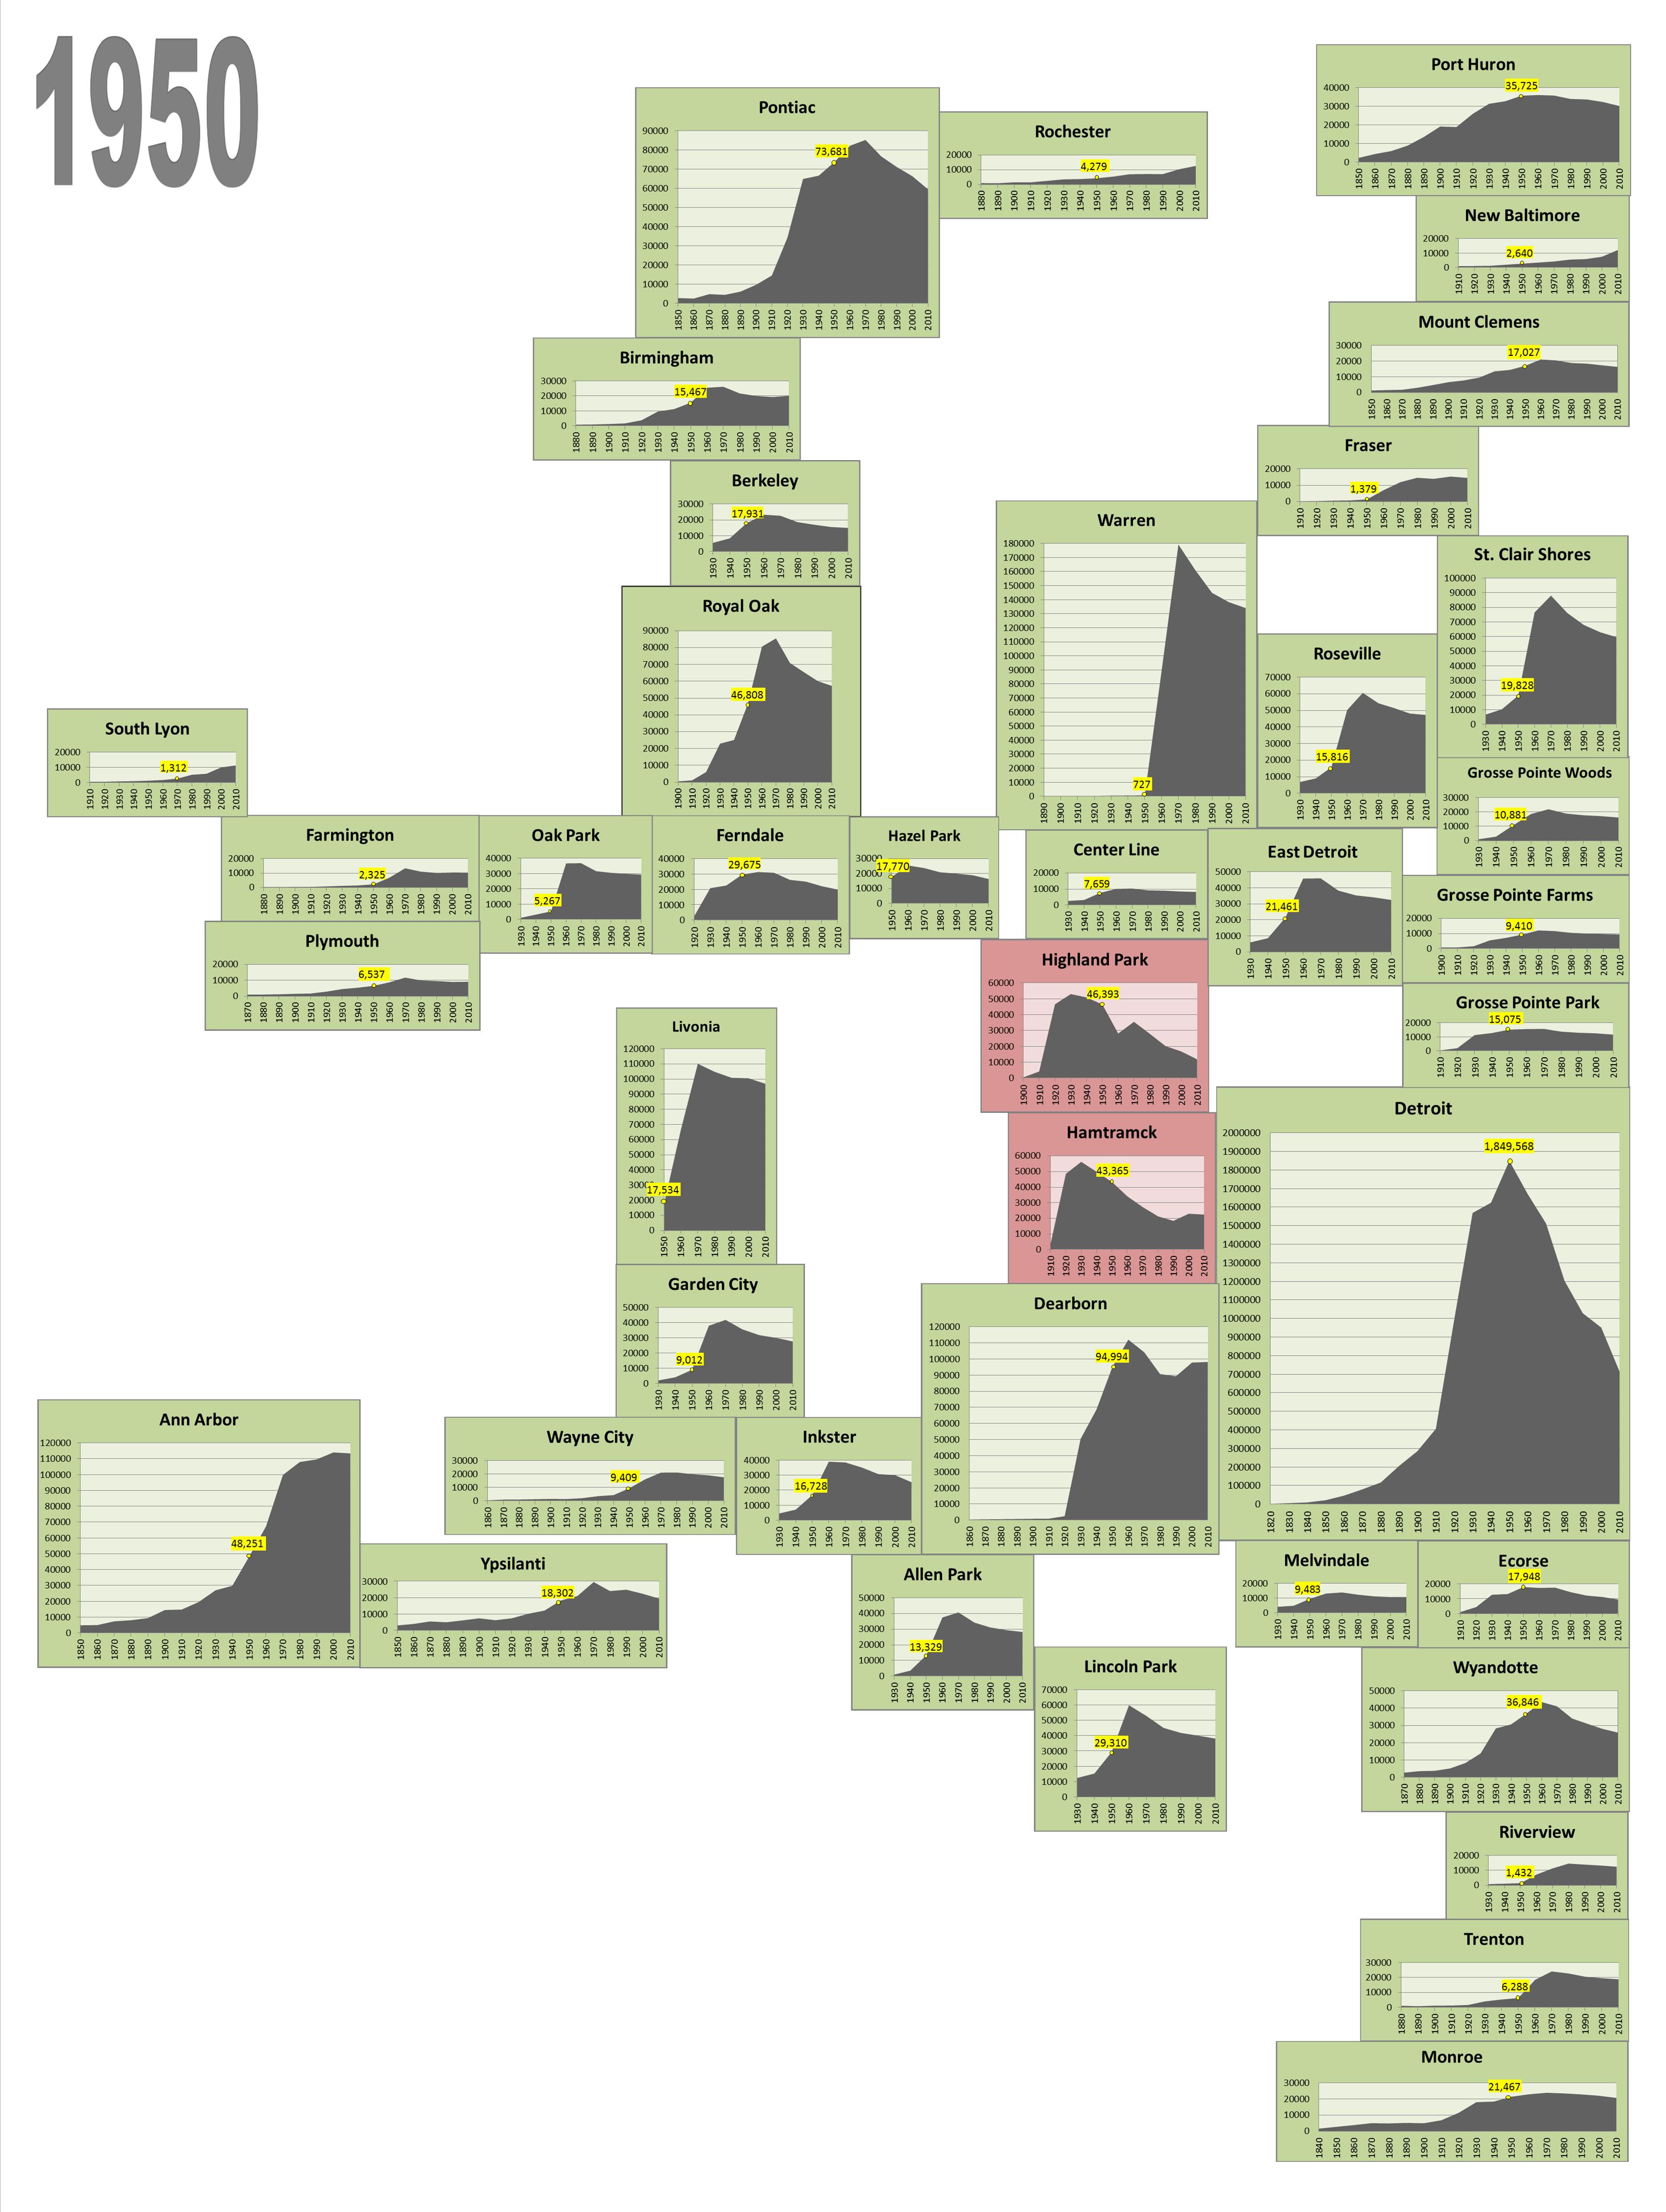
To fully grasp the regional and statewide population gains and losses we needed to understand just who left one area and moved to another. Migration to the suburbs, particularly to Macomb and Oakland counties by the City’s white population, is what initially triggered Detroit’s population loss in the 1950s. This population loss has continued through 2020. Demographic changes have continued through today and with the release of new Census data, Drawing Detroit will show just how Southeastern Michigan, and Michigan overall, has changed in the last decade and beyond.

Wayne County’s population loss remains the largest in the region—2010 to 2014

Between 2010 and 2014 Oakland and Washtenaw counties were the only two counties in the seven-county region that experienced a population change increase. According to U.S. Census Data, Oakland County’s population increased from 1.2 million in 2010 to 1.24 million in 2014 and Washtenaw County’s population increased from about 345,000 to 357,000. In Oakland County, three communities-Clarkston, Orchard Lake and South Lyon-experienced more than a 10 percent population increase. In Washtenaw County, there were also three communities-Bridgewater, Sharon and Lima townships-that experienced a population increase above 10 percent between 2010 and 2014.

In the same time frame, Wayne County experienced a 3 percent population decrease. In 2010 Wayne County’s population was about 1.82 million and in 2014 it was about 1.79 million. Of the communities that make up Wayne County, Highland Park had the largest population decrease at 13.5 percent; in 2010 the city’s population was 11,776 and in 2014 it was 10,375. Detroit’s population change was a decrease of 8.4 percent between 2010 and 2014. In 2010 Detroit’s population was 713,777, and in 2014 it was 680,250 . At the Census Tract level we see that most of the population loss above 10 percent occurred in neighborhoods along the eastside of the City of Detroit. Compared to the 43 Census Tracts in Detroit that lost more than 10 percent of its populations between 2010 and 2014 there were 24 Census Tracts that experienced a 50 percent or more population increase. Overall, at the Census Tract level, more areas in the City of Detroit experienced population increases than decreases, however, the number of people lost in certain Census Tracts is what caused the overall population decrease.

Slide3

Slide4

Between 2000 and 2010 there were larger decreases (as might be expected given the longer time period) and smaller increases in population across the seven county region. Again, Wayne County had the largest population decrease of the seven counties. In 2010 Wayne County’s population was recorded at about 2 million and in 2010 it was about 1.82 million. The more rural counties-Livingston, Washtenaw and Macomb-experienced population increases above 4 percent between 2000 and 2010. At the more local level, only four communities-Independence Township, Sylvan Township, Detroit and Highland Park-experienced population decreases above 20 percent. Most of the population loss throughout the region was concentrated around Detroit and its inner-ring suburbs. When discussing the communities that experienced population increases above 20 percent, Livingston County, which had the highest population increase between 2000 and 2010 of the seven counties, had the largest number of communities with such high population increases. In Wayne County, which experienced an overall population decrease, only three communities-Northville, Woodhaven and Brownstown-experienced population increases above 20 percent. Two of those communities-Woodhaven and Brownstown-are located in the southern portion of Wayne County, and Northville is located in the northwestern portion of the county.

Slide7

Slide8


Few Southeast Michigan cities continue to grow

LEGEND:

Green charts indicate increasing population in that decade

Red charts indicate declining population in that decade

Yellow charts indicate the population remained stagnant in that decade

In this post we show through a slideshow how the populations of cities within the Southeastern Michigan region have grown, and in many cases fallen. According to the Michigan Legislature, some cities within the state were formed through the Northwest Ordinance and the authority of territorial government before Michigan was admitted into the union. For example, the city of Detroit was founded in 1701 but it was until 1837 that Michigan became officially recognized as a state. Only after Michigan became a state did the Census start recording data.

In 1840 the city of Detroit and the city of Monroe were recognized as official cities by the Census Bureau. Detroit’s population at that time was 9,102 and Monroe’s was 1,703. Pontiac, Port Huron, Ann Arbor, Ypsilanti and Mount Clemens all appear on the chart a decade later, in 1850.

By the early part of the 20th Century we see growth both within the city of Detroit and the areas surrounding the city. The Home Rule City Act was enacted in 1908, giving the opportunity for new cities to arise, so long as a city charter was created. Fraser, New Baltimore, Grosse Pointe Park, Ecorse, Hamtramck and South Lyon all appear on the 1910 map; they were not incorporated cities to be represented on the 1900 map.

Additionally, in 1910 the Highland Park Plant, located just outside Detroit on Woodward Avenue, opened, as did the Dodge Main Plant, also just outside of Detroit, in Hamtramck; both were automotive facilities. It was the opening of such automotive plants within Detroit and its outskirts that helped propel the city to a population of 1.5 million people in 1930. Just like Detroit’s population, Pontiac’s population had significantly grown up until this point, in part because of the Pontiac Assembly Plant.

It was in about 1930 that the region outside of the county seats and the inner-ring Detroit suburbs began to expand. This started to occur, according to Thomas Sugrue in “From Motor City to Metropolis: How the Automobile Industry Reshaped Urban America,” because the growing middle and wealthy classes (much of which was supported by the auto industry), were beginning to choose to build in cities like the Grosse Pointes and Birmingham.

Although many of the suburbs were experiencing rapid growth, when we move forward a decade to 1940, evidence of population loss in the inner-ring suburbs begins to appear. As can be seen in the red colored maps-which indicate population loss in that specific decade-both Highland Park and Hamtramck began to lose residents in 1940 and have yet to regain their 1930 numbers, which are nearly double current population estimates.

Moving forward to 1950 is when Detroit’s population peaked at about 1.8 million. Then, by 1960, the population decline began, and has continued ever since. As much of region was, and still is dependent, on the auto industry, we saw the building of about 25 new auto plants throughout Metro Detroit suburbs during the 1940s and 1950s, according to Sugrue (2004). This, along with the expansion of the federal highway system throughout the 1950s and 1960s, were all contributing factors to the start of suburbanization in the area (Sugrue, 2004).

While Detroit residents began to disperse from the city prior to its population peak, “white flight” also began to increase following the race riots that broke out in 1967. However, policies show that the footing for this type of out-migration began before those race riots. According to Sugrue in his book “The Origins of the Urban Crisis: Race and Inequality in Postwar Detroit”, around the 1940s, as Detroit’s population continued to grow, federal policies around homeownership started to surface that kept African Americans in Detroit and within certain neighborhoods in the city (1996). For example, a majority of the predominantly “black enclaves” in Detroit were redlined on the Home Owners Loan Corporation maps, meaning these areas were not suitable for federal loans or similar aide (Sugrue, 1996). This, along with the combination of access to suburban auto plants because of vehicles and roadways, meant that by 1960 there were more African Americans in Detroit than Caucasians, who had flooded to suburbs (Sugrue, 1996).

As Detroit’s population began to decline, we see that the suburbs began to boom. Warren, Royal Oak, Pontiac and Livonia reached their population peaks in the 1970s. By the 1980s though there were more than two dozen cities in the Metro-Detroit region experiencing population loss, as denoted by the red maps. Everywhere from Farmington to Pontiac to Port Huron to the Grosse Pointes to Detroit to Monroe were all battling with population loss. Additionally, in 1983, the city of Auburn Hills was incorporated (it was formerly Pontiac Township) which is why it first appears on the 1990 chart with a population of 17,000.

Although the city of Ann Arbor was founded long before the last half of the 20th Century, it was one of the few that continued to grow, as did other communities such as Woodhaven, Riverview, Sterling Heights, New Baltimore and the area around Novi. In 2010, Sterling Heights, New Baltimore and Woodhaven were some of only a few cities in the region with increasing populations.

One noteworthy population increase in recent years is Dearborn, which recovered from its decades of population loss in 2000. Despite experiencing growth, the Census data shows that Dearborn has yet to bounce back to its population peak, like many of the red colored charts in 2010.

Dropping from a population of about 1.8 million in 1950 to 714,000 in 2010, we see people left the city of Detroit long before the recession of 2008. In fact, as the charts show, the population loss started about 50 years prior, as the suburbs grew more attractive, the highway system continued to expand and access to vehicles became more accessible to a wider range of residents, enabling many to increase their options for choosing where to live.


Sources:

Census Bureau

Michigan Legislature

Sugrue, Thomas. (1996). The Origins of the Urban Crisis: Race and Inequality in Postwar Detroit. Princeton University Press.

Sugrue, Thomas. (2004). From Motor City to Metropolis: How the Automobile Industry Reshaped Urban America. Automobile in American Life and Society. http://www.autolife.umd.umich.edu/Race/R_Overview/R_Overview1.htm