Southeastern Michigan COVID Update: August 2021

The era of COVID continues, especially as we again are witnessing a case surge due to the Delta-variant. In Michigan, the level of transmission is now considered substantial, according to the Centers for Disease Control (CDC). The CDC states there are now 71 counties that are places of “substantial” or “high” transmission: Livingston, Monroe, Macomb, Oakland, Washtenaw and Wayne are included in this list. A county is considered to have a substantial transmission rate if there are 50-99 cases per week per 100,000 people and/or a test positivity between 8  and 9.9 percent; all counties in Southeastern Michigan are considered substantial by the CDC, except St. Clair County. A county is considered to have a high transmission rate if there are 100 new cases per week per 100,000 residents, and/or there is a positive test rate of 10 percent or higher. Those Michigan counties that have a high transmission rate are Alpena, Branch, Charlevoix, Huron, Iosco, Kalkaska and Montmorency counties, according to the CDC.

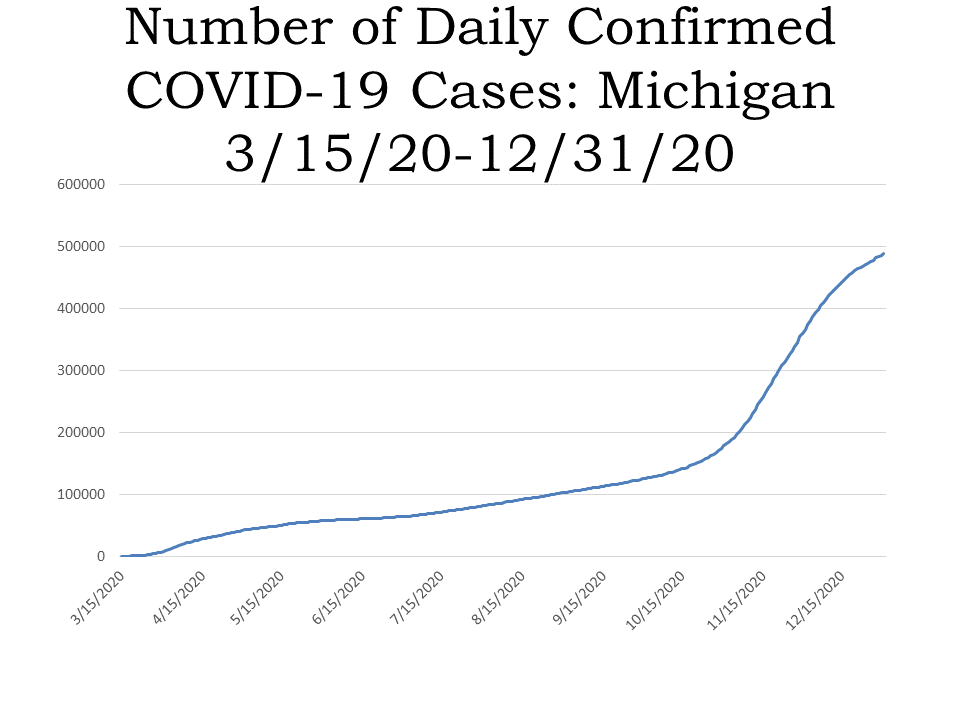
Michigan reported 910,500 total confirmed COVID cases as of Aug. 6, 2021. Of that total 3,962 are confirmed new COVID cases from August 3,4 and 5, 2021 (the State no longer reports case numbers daily).

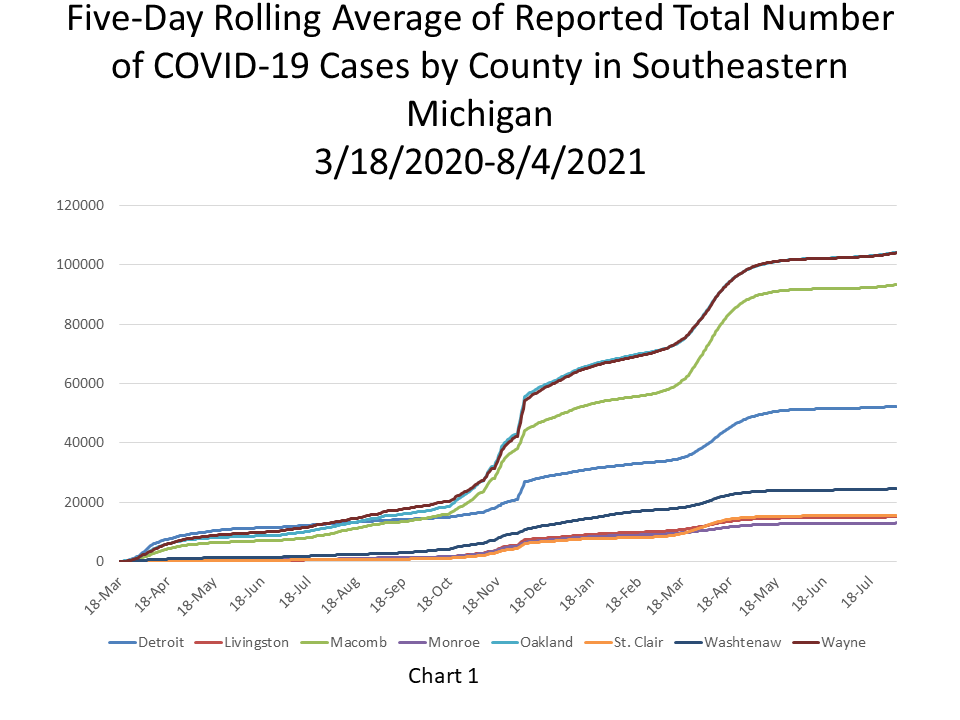
In Chart 1 we drill down into the number of confirmed COVID cases for Southeastern Michigan, by county and for the City of Detroit; all numbers are represented of a five-day rolling average. The five-day rolling average for the total number of COVID cases (Chart 1) reflects a smoother curve and adjusts for fluctuations in testing and/or the quality of reporting or failure to report. This chart also shows that, while the total number of COVID cases has grown overall since March 2020, there have certainly been surges. We also see that Oakland and Wayne counties continue to have the highest total number of COVID cases. Oakland County had the highest number of confirmed COVID cases at 104,354, followed by Wayne County with 104,090 new cases as of August 4, 2021. The City of Detroit had 52,394 confirmed cases.

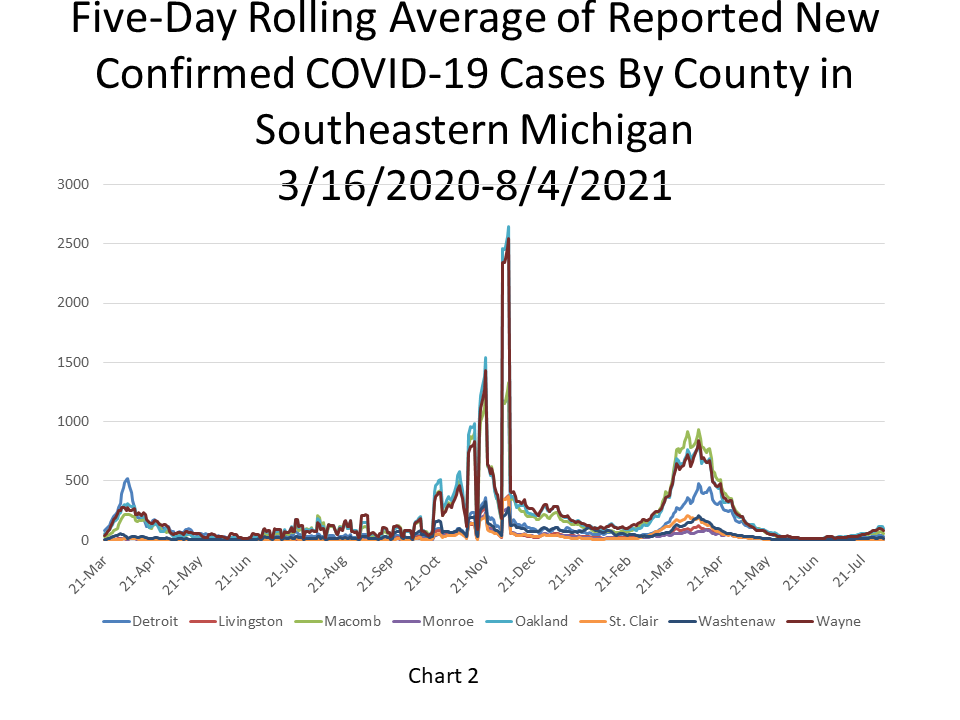
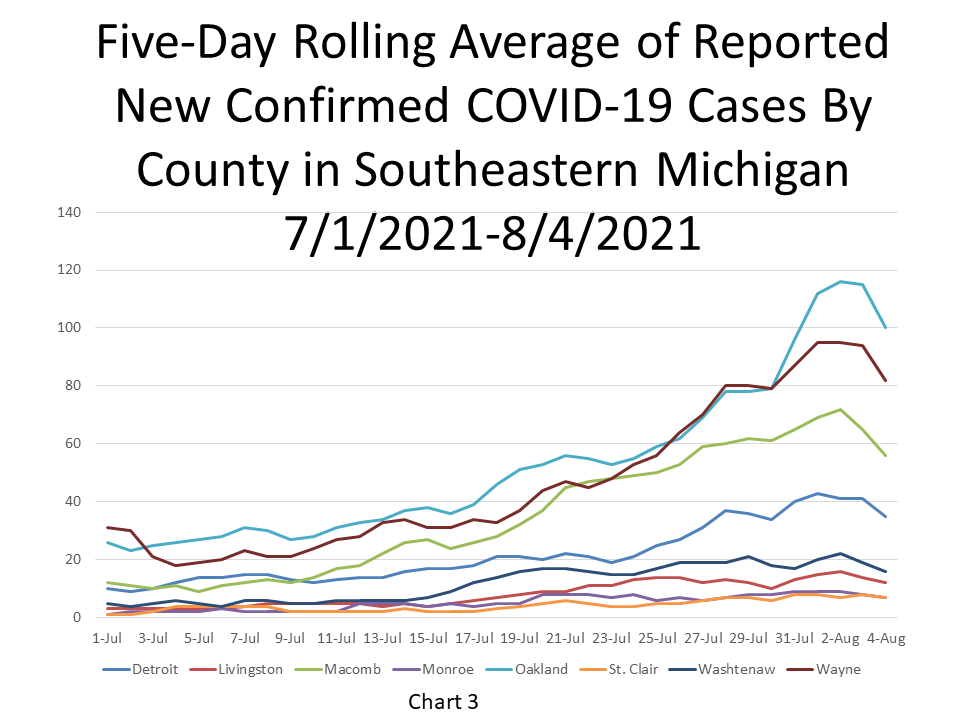
Charts 2 and 3 provide a closer look at the number of new COVID cases over time. In Chart 2 we are reminded of the COVID case surges in fall/winter of 2020 and again in spring of 2021. However, as Chart 3 shows with a zoomed in look at the last month. New COVID case numbers are again on the rise. Oakland County had the highest number of new confirmed COVID cases on August 4, 2021 with 100, followed by Wayne County with 82 new cases and Macomb County with 56 new confirmed cases.

The daily data highlighted in these posts is from Michigan.gov/coronavirus, where data is updated daily at 3 p.m. Historical data were supplied from covidtracking.com, which republishes COVID data from the State. Additionally, the case totals do not reflect the number of people who have recovered, just those who have been infected. In June of 2020 the State changed how it reports its data on the website, making data more accurate in the long-term but more complicated to track as well. The State regularly updates older data, and as we continue to publish regular updates on COVID the State’s changes to past data many not always be reflected in our posts. The data published in this post is accurate for the day we it was received and published though.

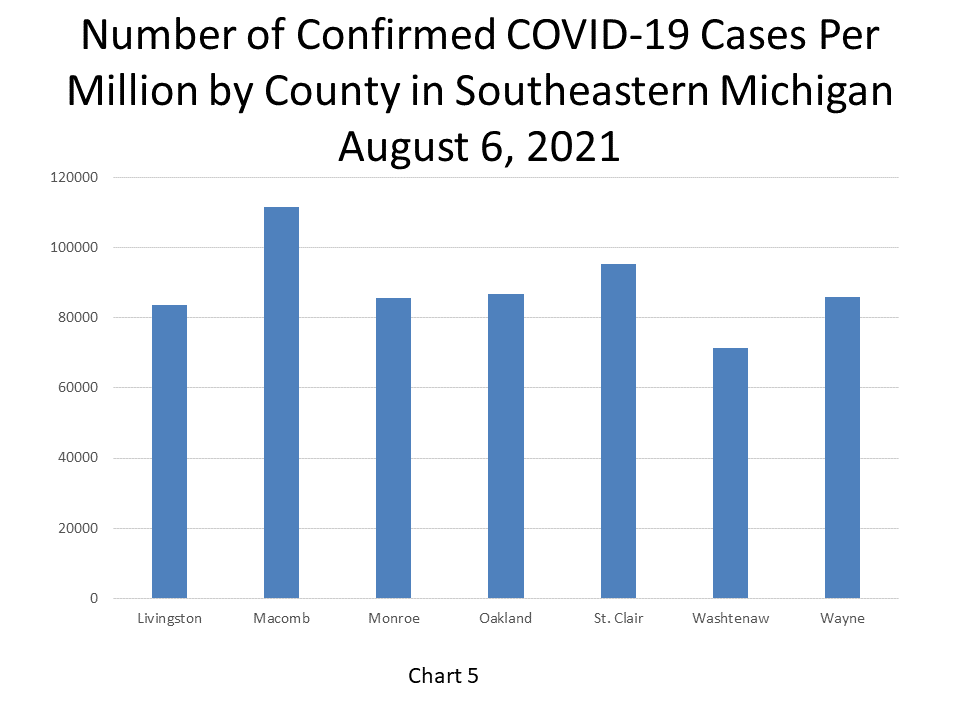
The chart below (Chart 4) shows that Macomb County had the highest number of COVID confirmed cases per capita. According to the data released on August 6, 2021 by the State of Michigan, Macomb County had 111,540 COVID cases per million people. St. Clair County had the second highest number of confirmed cases per million people at 95,339. Washtenaw County had the lowest per capita rate at 71,278 confirmed COVID cases per million people.

While the current surge of COVID cases may not numerically appear to be as troubling as what we experienced in the spring and fall, the Delta variant is highly transmissible and a cause for both caution and concern, especially for the unvaccinated. As of last week the variant was confirmed in 40 different Michigan counties.

COVID’S Economic Impacts Continue in Michigan and Beyond

Twenty-twenty may be a wrap but the COVID-19 pandemic continues on and the economic impacts continue to be felt, nationally and locally. According to the Michigan Department of Health and Human Services, on Jan. 2, 2021 there were 497,127 confirmed COVID-19 cases; that is 8,983 new confirmed cases since Dec. 29, 2020 (the State did not release data over the New Year’s holiday). According to the five-day rolling average (shown in the chart below) there were 489,096 confirmed COVID cases in Michigan on Dec. 31, 2020. New case numbers continue to remain in the thousands, and while the vaccine is in its first phase of distribution, we still have a ways to go until the affects of this virus—physically, economically, socially and mentally—are no longer felt.

In November of 2020 the unemployment rates for the State of Michigan and for the City of Detroit increased after general declines between July and October. The State of Michigan reported an unemployment rate of 6.3 in November, a higher rate than what was reported in October, which was 5.7—the lowest rate reported since the pandemic began. While the November unemployment rate was still lower than what was reported between April and September of 2020, it was still an increase from October and likely a reflection of the stronger COVID-19 restrictions imposed by the State and growing caution from citizens as the confirmed case numbers began to rapidly increase.

For the City of Detroit, the unemployment rate for November of 2020 was 18.7, which is higher than the October rate of 15.4. While Detroit’s unemployment numbers remain much higher than what they were a year ago and above the State’s, the city is following the same trend as the State. Furthermore, the November unemployment data shows how the unemployment gap between the State and Detroit continues to grow wider as the case numbers increase.

A direct reflection of the unemployment data above is the number of small business closures. According to the Southeastern Michigan Council of Governments (SEMCOG), 33 percent of small businesses in Metro-Detroit closed as of Dec. 30, 2020. While this lower than the May 12, 2020 local small business closure percentage of 54 it is still far above the 3 percent closure rate on April 1, 2020—less than a month after COVID hit Michigan.

The data on the percentage of small business closures is determined through the Opportunity Insights Economic Tracker. This source uses credit card transaction data from 500,000 small businesses and estimates closures from the number of small businesses not having at least one transaction in the previous three days. The data covers industries such as healthcare services, leisure and hospitality, and retail and transportation.

Michigan’s economy continues to rely heavily on the auto industry and between February and March of 2020 auto sales for cars, trucks and light weight vehicles were cut in half. Since then, the number of auto sales has slowly, yet steadily, grown—but not to pre-pandemic levels. In November of 2020 auto sales for: light weight vehicles was 15.5 million, compared to 16.9 million the year prior; light truck sales was 11.8 million compared to 12.6 million in November of 2019; car sales was 3.8 million, compared to 4.4 million the year prior. All three types of vehicles have experienced a decline, with light weight vehicles experiencing the largest decline when comparing 2019 sales to present sales.

Below shows the consumption expenditures of goods in the U.S. between 2019 and 2020. According to the U.S. Bureau of Economic Analysis, durable goods have an average useful life of at least 3 years (e.g. motor vehicles) while nondurable goods have an average useful life of less than 3 years (e.g. food) and services are commodities that cannot be stored or inventoried and are consumed at the time of purchase (e.g., dining out). The chart below shows how in March of 2020 consumption of nondurable goods increased while consumption of durable goods and services decreased. Following the initial panic of the COVID-19 pandemic, consumption expenditures of nondurable goods decreased in April, 2020 and have since somewhat leveled off. In November of 2020 $3167 billion in nondurable goods was consumed and in November, 2019 $3017 billion in nondurable goods was consumed.  Overall, there has been an increase in consumption expenditures of nondurable goods since last year. For durable goods, $1813 billion was consumed in November of 2020 and in November of 2019 $2032 billion was consumed; this shows an overall decrease.

Services have been the hardest hit in terms of expenditure consumption. In November of 2020 $8014 billion in services was consumed and in November of 2019 $8589 billion was consumed.

In addition to COVID impacts on employment rates and consumption of goods and services, it has also impacted the sale prices of homes. However, the pandemic seems to have had the opposite effect—home prices have continued to increase.

According to the Case-Shiller Home Price Index, the average price of single-family dwellings sold in Metro Detroit was $135,760 in September of 2020; this was $164 higher than the average family dwelling price in August. The September 2020 price was an increase of $8,290 from September of 2019.