In March of 2021 the unemployment rates for the State of Michigan and for the City of Detroit continued to a decline, which is a more recent trend. The State of Michigan reported an unemployment rate of 5.2 in March, which is the same at its February rate. However, since December of 2020 the State’s unemployment rate declined from 7.3 to 5.2. For the City of Detroit, the unemployment rate for March of 2021 was 9.3, which is 0.3 points lower than the February unemployment rate and 11 points lower than the December 2020 rate. Both the Michigan and the Detroit rates were similar to the January 2020, pre-pandemic rates.
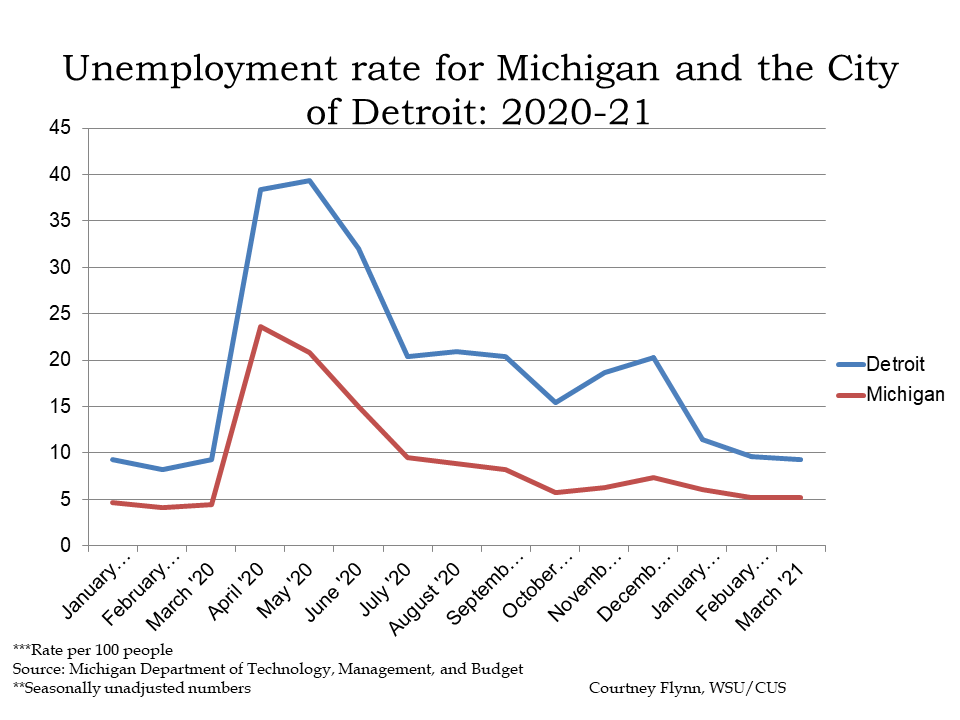
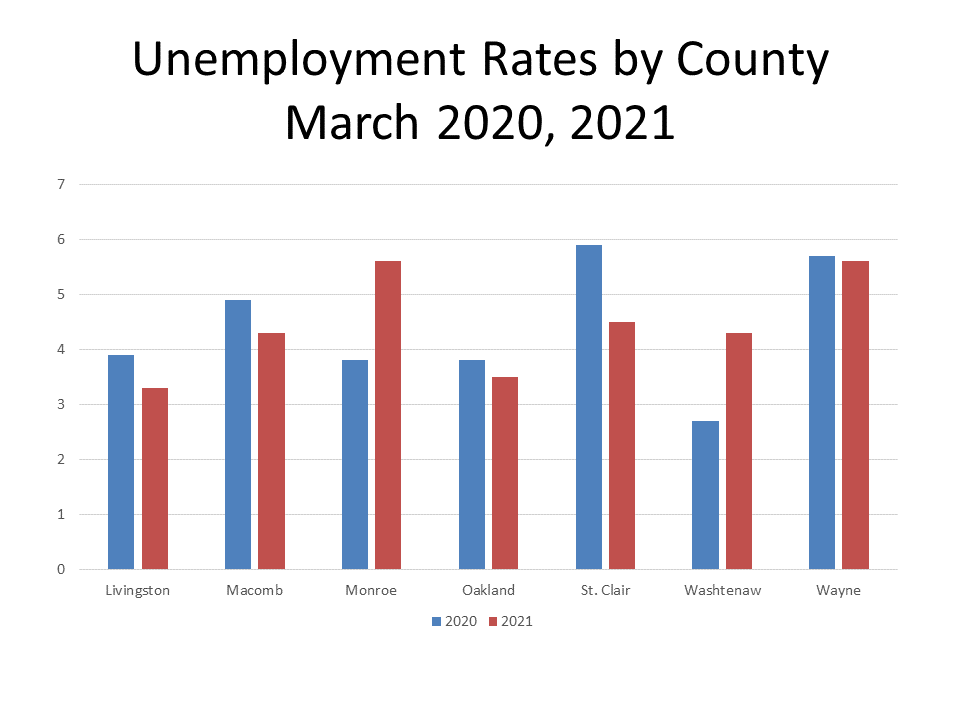
The chart above shows unemployment rates beginning to level off and the chart below reflects a similar message for some counties. Livingston, Macomb, Oakland and Wayne counties all reported higher unemployment rates in March of 2020 than March of 2021. In March of 2020 St. Clair County had the highest unemployment rate of 5.9, followed by Wayne County with an unemployment rate of 5.7. Washtenaw County had the lowest unemployment rate in March 2020 at 2.7, but by March of 2021 that increased to 4.3. Washtenaw and Monroe counties were the only two in the region with higher unemployment rates in March of 2021 than March 2020. Both Monroe and Wayne counties had the highest unemployment rates in March of 2021 at 5.6. Livingston County had the lowest unemployment rate in March of 2021 at 3.2.
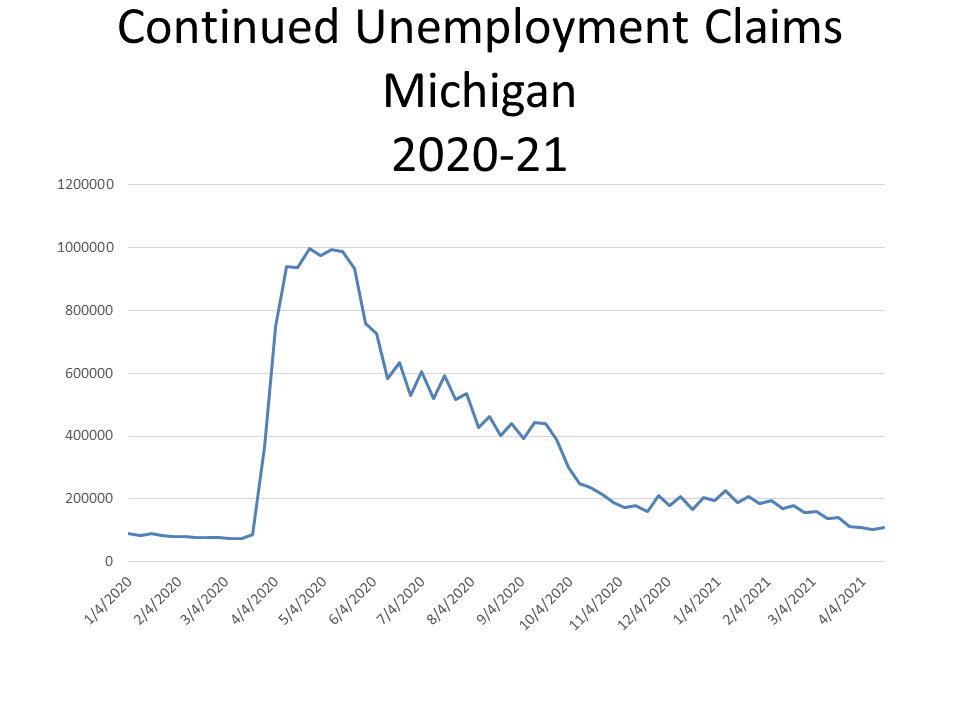
Just as the unemployment rate in the region is declining, so is the number of continued unemployment claims. These claims, also referred to as insured unemployment, are the number of people who have already filed an initial claim and who have experienced a week of unemployment and then filed a continued claim to claim benefits for that week of unemployment. Continued claims data are based on the week of unemployment, not the week when the initial claim was filed, according to the Southeastern Michigan Council of Governments.
The chart below shows a spike in April and May of 2020, when COVID restrictions tightened throughout the State. Since then though there has been a steady decline in the number of continued claims. The largest declines occurred between May and June of 2020 and September and November of 2020. Although there have been some increases in the number of continued unemployment claims since November of 2020, the April 10, 2021 number of 102,721 unemployed claims is the lowest number of claims in over a year.
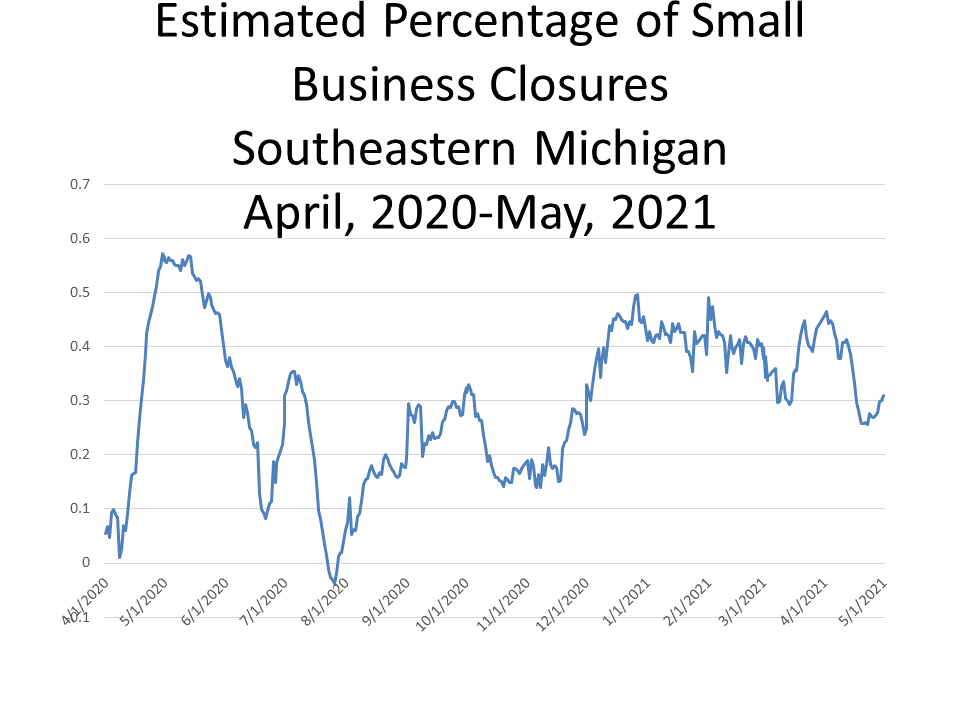
Although unemployment numbers have been on the decline, there has been a recent increase in the number of small business closures, according to the Opportunity Insights Economic Tracker. This source uses credit card transaction data from 500,000 small businesses, Opportunity Insights estimates closures from the number of small businesses not having at least one transaction in the previous three days. The data cover many industries, including healthcare services, leisure and hospitality, and retail and transportation. The date source does says it has less coverage in manufacturing, construction, and finance.
According to the data, 31 percent of small businesses closed as of May 1, 2021. This number was an increase from the 26 percent of small business that were estimated to be closed on April 23, 2021.
Since April of 2020 the percentage of small business closures has increased, but those numbers are not as high as when the pandemic began.
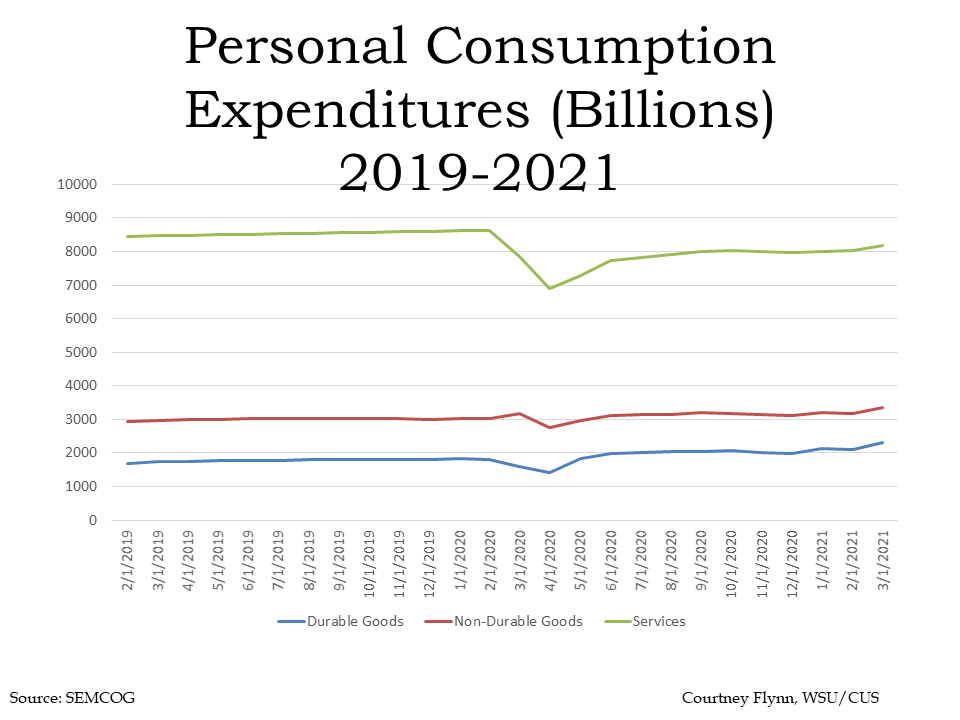
Below shows the consumption expenditures of goods in the U.S. between 2019 and 2021. According to the U.S. Bureau of Economic Analysis, durable goods have an average useful life of at least 3 years (e.g. motor vehicles) while nondurable goods have an average useful life of less than 3 years (e.g. food) and services are commodities that cannot be stored or inventoried and are consumed at the time of purchase (e.g., dining out). The chart below shows how consumption of services continues to remain steady, but not back to pre-COVID levels. On March 1, 2021 it was estimated that there was $8,182 billion in consumption of services, a slight increase from the month prior but below the January 1, 2020 levels.
The expenditures on durable and non-durable goods are now increasing above pre-COVID levels with the amount spent on durable goods being $2,314 billion as of March 1, 2021 and the amount spent on non-durable goods being $3,342 billion.
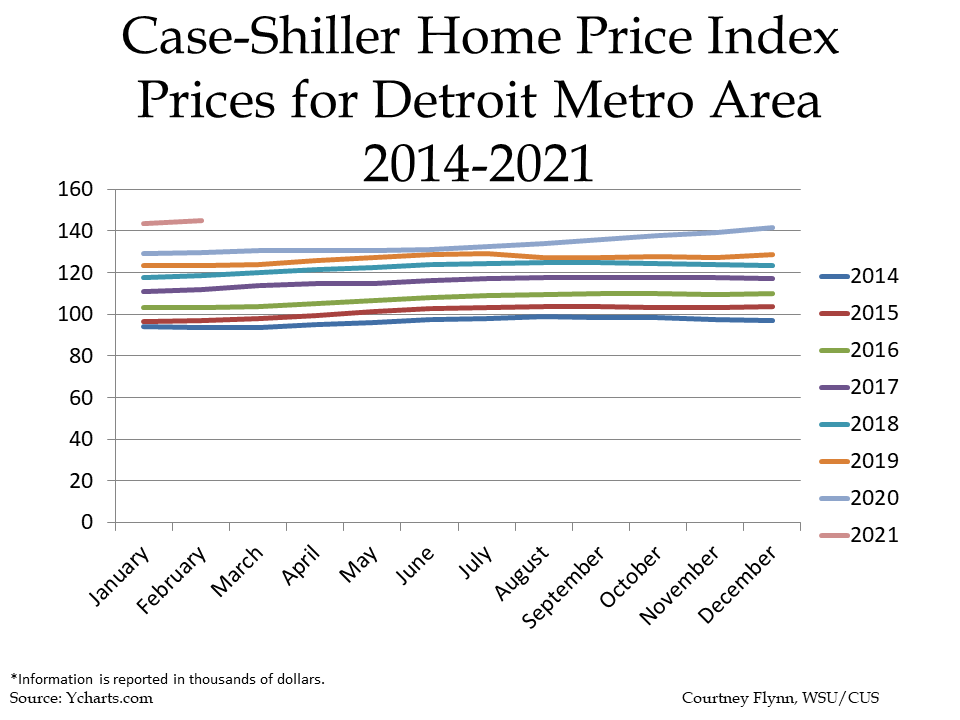
According to the Case-Shiller Home Price Index, the average price of single-family dwellings sold in Metro Detroit was $148,500 in February of 2021; this was $1,500 higher than the average family dwelling price in January. The February 2021 price was an increase of $14,070 from February of 2020 and $49,430 from February of 2014. Home prices have continued to increase year-after-year but the recent average price of single-family dwellings sold in the Metro-Detroit area has increased at a higher rate than in previous years.