CPI Soars for Midwest Region

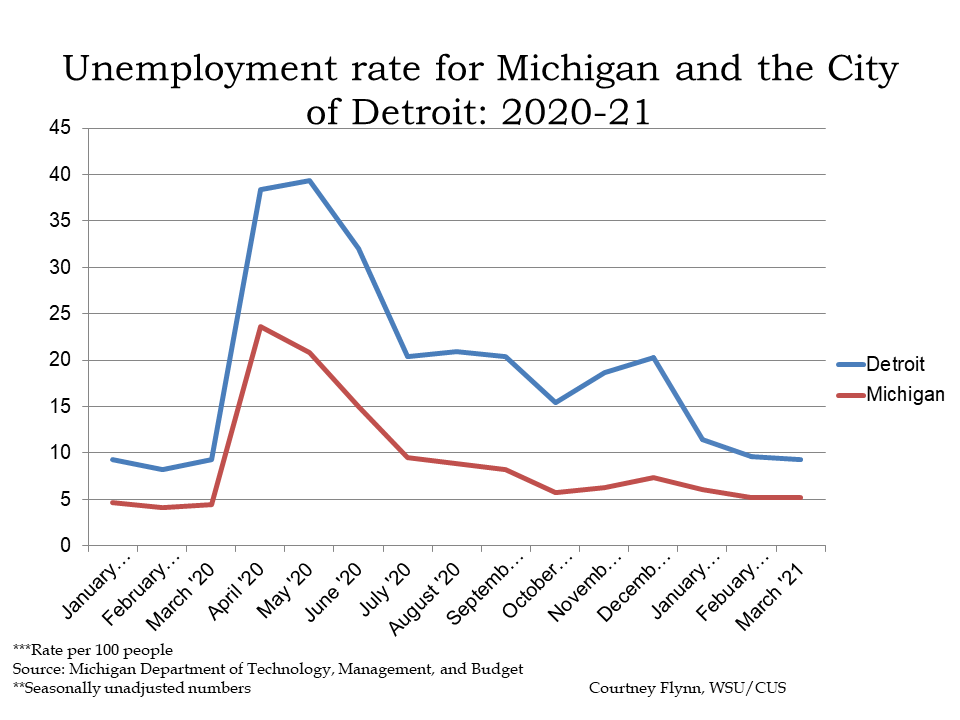
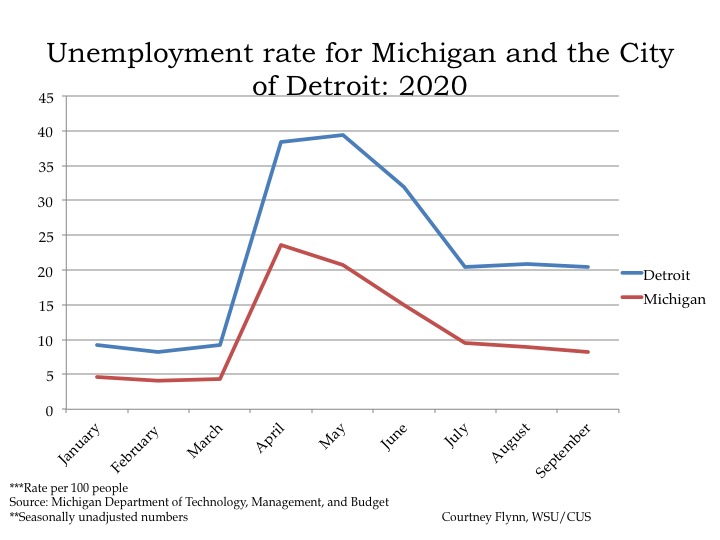
In August of 2021 the unemployment rates for the State of Michigan remained steady from the previous months while the City of Detroit’s unemployment rate took a dip, following a slight increase the month prior. The State of Michigan reported an unemployment rate of 4.4 in August, which was just below the 5 percent unemployment rate reported in July. Since January of 2021 the State’s unemployment rate has not gone above 6.1 percent.

For the City of Detroit, the unemployment rate for August of 2021 was 8.4 percent, which is 1.7 points lower than the July unemployment rate and 10.8 points lower than the August 2020 rate.

Both data sets show that the unemployment rates in Michigan and Detroit are stabilizing to pre-pandemic rates.

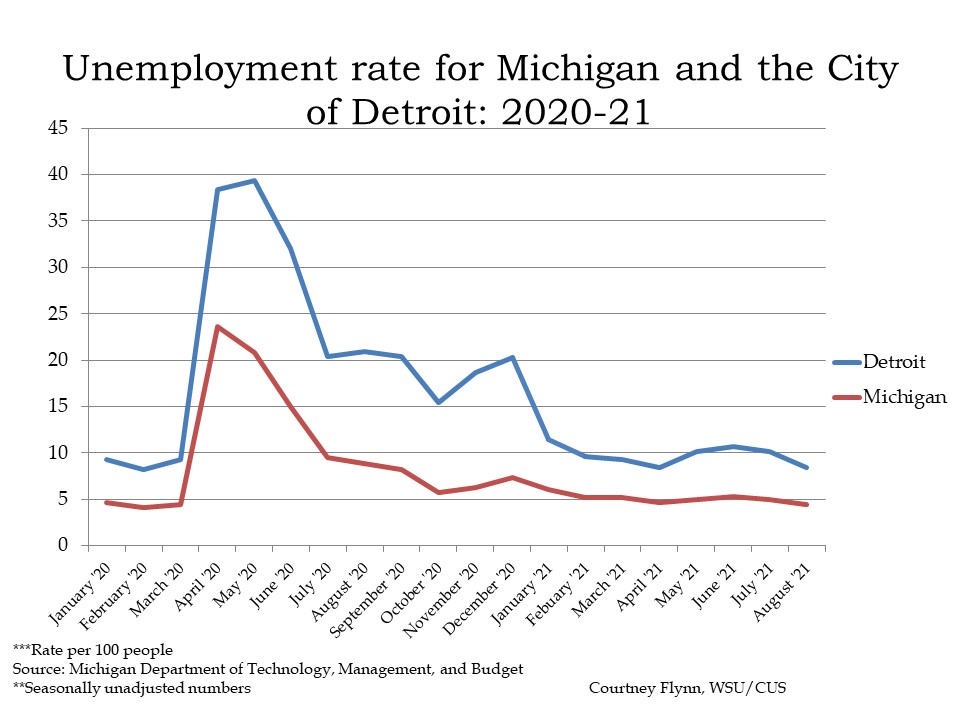
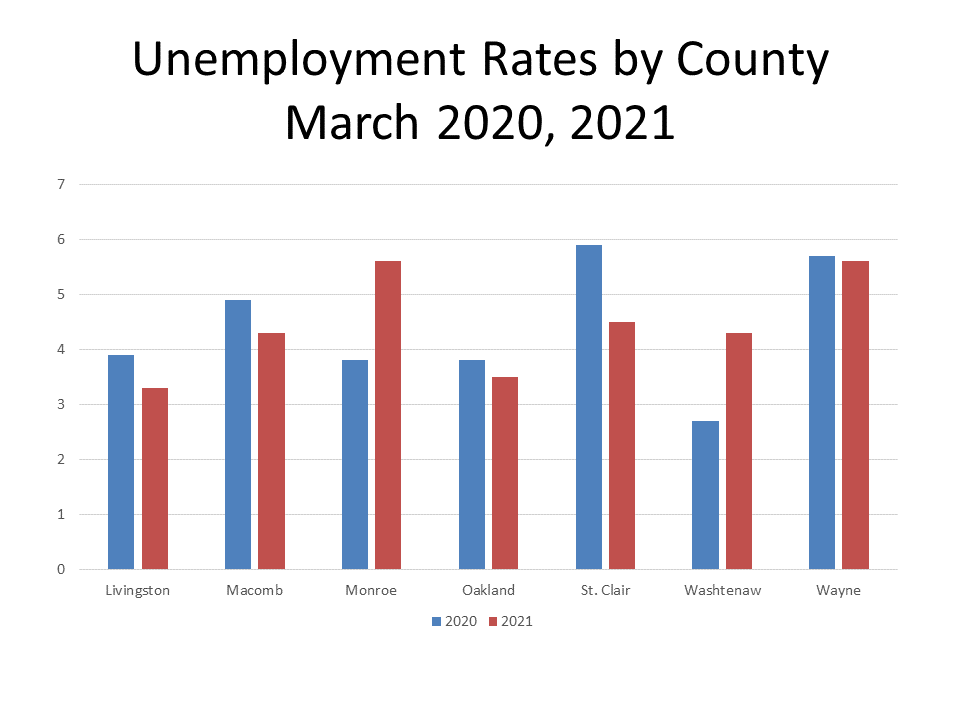
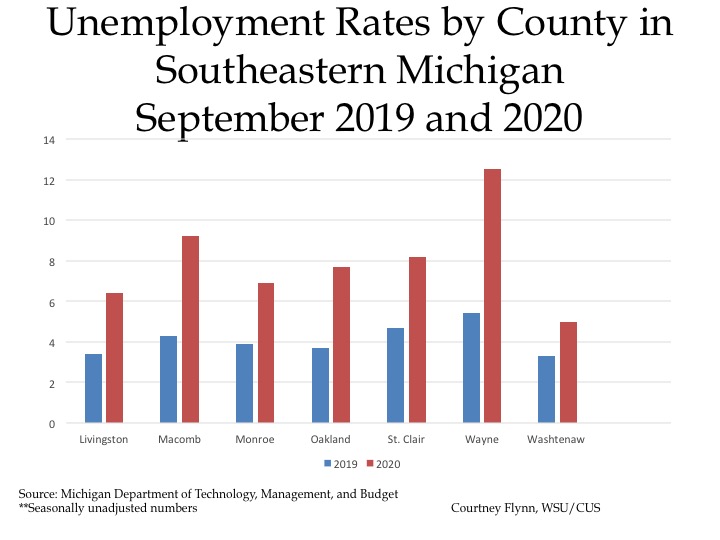
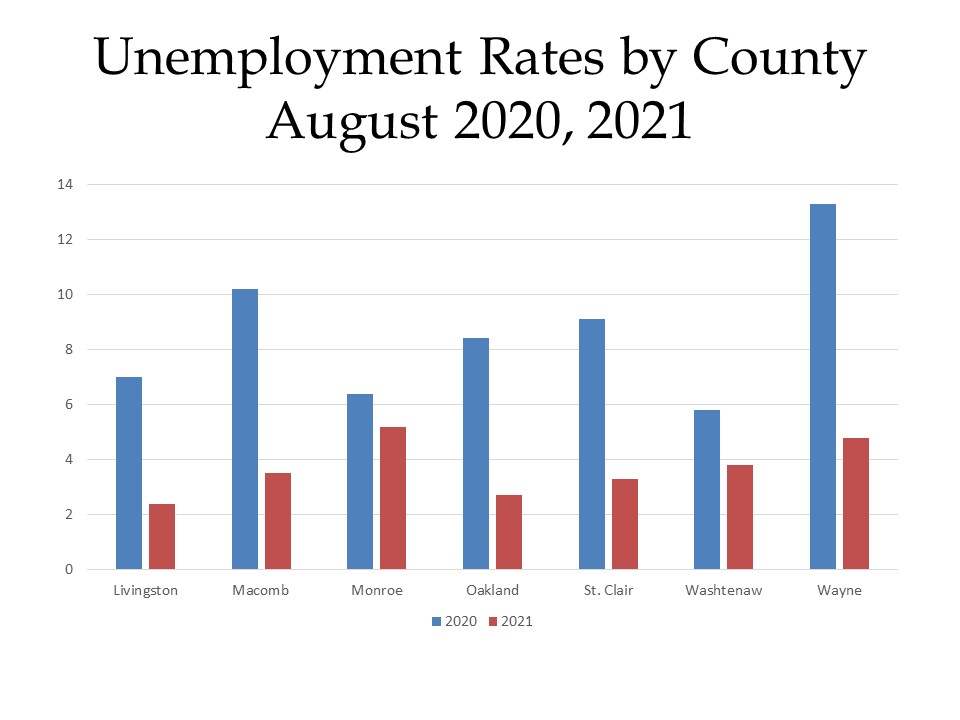
The chart above shows unemployment rates beginning to level off and the chart below shows a deeper story—just how drastically unemployment rates have dropped in a year. Each county in Southeastern Michigan experienced an unemployment rate decrease between August of 2020 and August of 2021, with Wayne County experiencing the largest decrease at 8.5 points. In August of 2020 Wayne County had an unemployment rate of 13.3 percent and in August of 2021 it decreased to 4.8 percent. Monroe County had the smallest change in the last year with it recording an unemployment rate of 6.4 percent in August of 2020 and a rate of 5.2 percent in August of 2021. In August of 2021, Monroe County also had the highest unemployment rate regionally. Livingston County reported the lowest unemployment rate in August of 2021 at 2.4 percent while Washtenaw County reported the lowest unemployment rate in August of 2020 at 5.8 percent.

The charts below show the percent changes in the Consumer Price Index (CPI) on a month-to-month basis and a year-to-year basis for each month in years 2019, 2020 and 2021 in the Midwest Region. The CPI is a measure that examines the weighted average of prices of consumer goods and services, such as transportation, food, energy, housing and medical care. It is calculated by taking price changes for each item in the predetermined group of goods and averaging them.

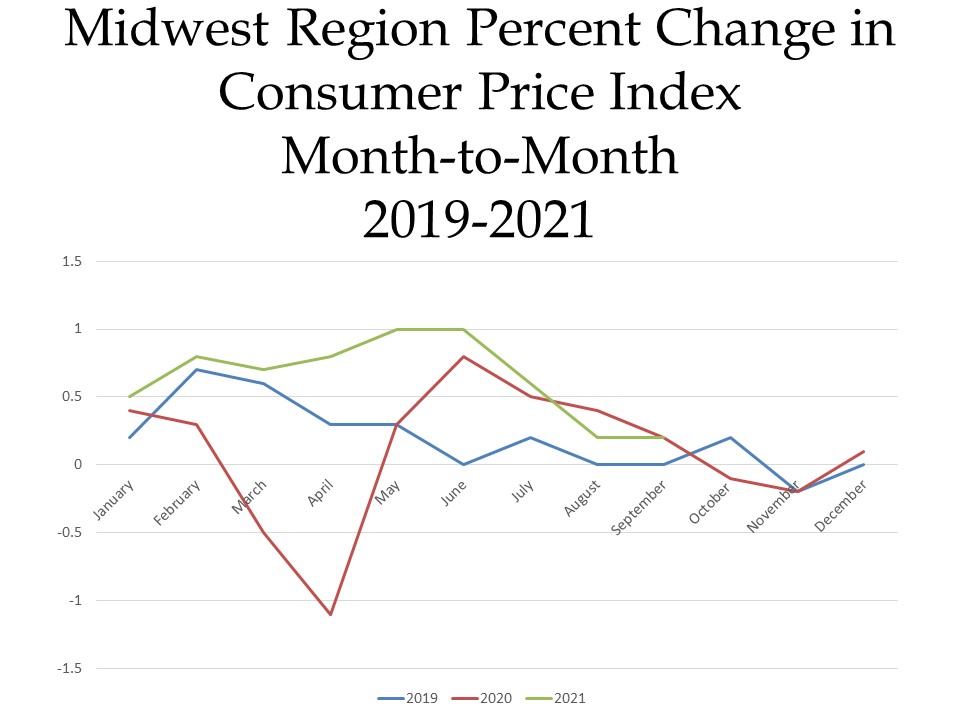
The first  chart below highlights how the CPI changed on a month-to-month basis between 2019 and 2021. Prices in the Midwest region fell to their lowest in April of 2020, a -1.1 percent decline from the month prior; this was just as the pandemic was beginning. Just a month later though they increased by 0.8 percent. Currently in 2021, area prices are up 0.2 percent between August and September. According to the Bureau of Labor Statistics, food prices increased 1 percent between August and September of 2021, and energy prices increased 0.9 percent. Categories that were higher included shelter, apparel, household furnishings and operations.

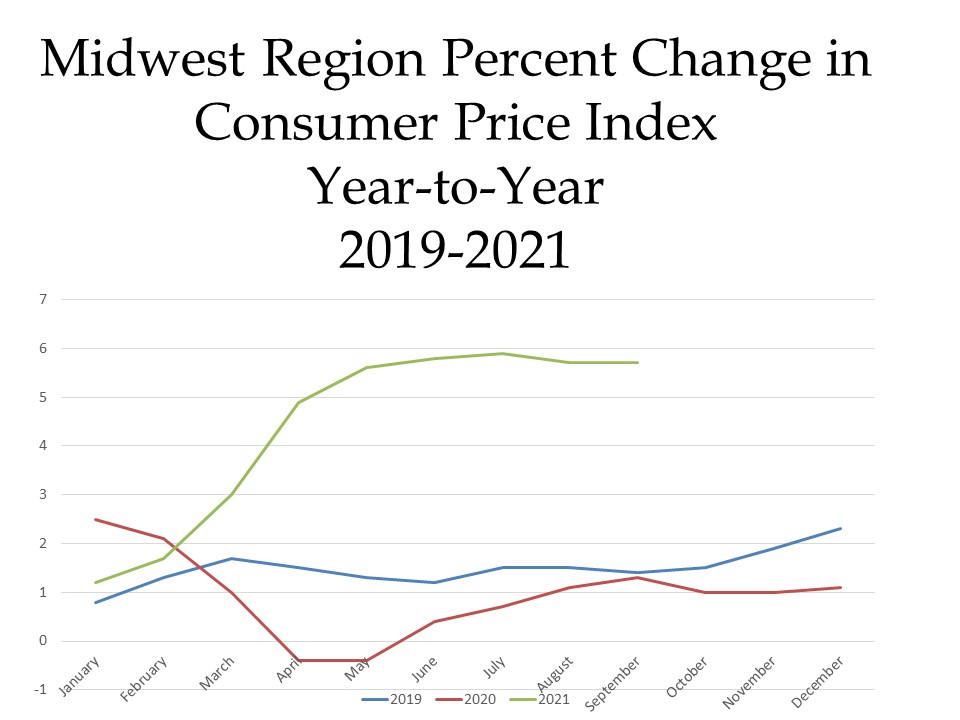
When examining the second chart, which shows how prices changed on a year-to-year basis,  we see how prices in nearly the entire year of 2020 declined below what they were in 2019 (which was a fairly stable year) and how in 2021 the CPI has been lingering between about 5.5 and 5.9 percent since May. Of course, with the steep decline in 2020 due to the pandemic, we are likely to see a higher CPI in 2021 as everything begins to stabilize. However, some categories are experiencing rather large leaps. For example, in September of 2021 the CPI was up 5.7 percent from a year ago. One of the expenditures that has experienced a large increase in the CPI categories is gas services. Utility services are up 34.2 percent from a year ago and gasoline (motor fuel) is up 45.6 percent from a year ago. Under food and beverages, meats, poultry, fish and eggs experienced the highest increase at a 7.4 percent increase from a year ago, and housing experienced a 5.1 percent increase.
Home prices are being driven up by the demand for housing. In Metro Detroit, according to the Case-Shiller Home Price Index, the average price of single-family dwellings sold was $154,160 in July of 2021; this was $1,560 higher than the average family dwelling price in June. The July  2021 price was an increase of $21,700 from July of 2020 and $56,030 from July of 2014. Home prices have continued to increase year-after-year but the recent average price of single-family dwellings sold in the Metro-Detroit area has increased at a higher rate than in previous years, and it appears it may not be slowing down any time soon.

Unemployment Rates Leveling Off, Consumer Consumption Increasing

In March of 2021 the unemployment rates for the State of Michigan and for the City of Detroit continued to a decline, which is a more recent trend. The State of Michigan reported an unemployment rate of 5.2 in March, which is the same at its February rate. However, since December of 2020 the State’s unemployment rate declined from 7.3 to 5.2.  For the City of Detroit, the unemployment rate for March of 2021 was 9.3, which is 0.3 points lower than the February unemployment rate and 11 points lower than the December 2020 rate. Both the Michigan and the Detroit rates were similar to the January 2020, pre-pandemic rates.

The chart above shows unemployment rates beginning to level off and the chart below reflects a similar message for some counties. Livingston, Macomb, Oakland and Wayne counties all reported higher unemployment rates in March of 2020 than March of 2021. In March of 2020 St. Clair County had the highest unemployment rate of 5.9, followed by Wayne County with an unemployment rate of 5.7.  Washtenaw County had the lowest unemployment rate in March 2020 at 2.7, but by March of 2021 that increased to 4.3. Washtenaw and Monroe counties were the only two in the region with higher unemployment rates in March of 2021 than March 2020. Both Monroe and Wayne counties had the highest unemployment rates in March of 2021 at 5.6. Livingston County had the lowest unemployment rate in March of 2021 at 3.2.

Just as the unemployment rate in the region is declining, so is the number of continued unemployment claims. These claims, also referred to as insured unemployment, are the number of people who have already filed an initial claim and who have experienced a week of unemployment and then filed a continued claim to claim benefits for that week of unemployment. Continued claims data are based on the week of unemployment, not the week when the initial claim was filed, according to the Southeastern Michigan Council of Governments.

The chart below shows a spike in April and May of 2020, when COVID restrictions tightened throughout the State. Since then though there has been a steady decline in the number of continued claims. The largest declines occurred between May and June of 2020 and September and November of 2020. Although there have been some increases in the number of continued unemployment claims since November of 2020, the April 10, 2021 number of 102,721 unemployed claims is the lowest number of claims in over a year.

Although unemployment numbers have been on the decline, there has been a recent increase in the number of small business closures, according to the Opportunity Insights Economic Tracker. This source uses credit card transaction data from 500,000 small businesses, Opportunity Insights estimates closures from the number of small businesses not having at least one transaction in the previous three days. The data cover many industries, including healthcare services, leisure and hospitality, and retail and transportation. The date source does says it has less coverage in manufacturing, construction, and finance.

According to the data, 31 percent of small businesses closed as of May 1, 2021. This number was an increase from the 26 percent of small business that were estimated to be closed on April 23, 2021. 

Since April of 2020 the percentage of small business closures has increased, but those numbers are not as high as when the pandemic began.

Below shows the consumption expenditures of goods in the U.S. between 2019 and 2021. According to the U.S. Bureau of Economic Analysis, durable goods have an average useful life of at least 3 years (e.g. motor vehicles) while nondurable goods have an average useful life of less than 3 years (e.g. food) and services are commodities that cannot be stored or inventoried and are consumed at the time of purchase (e.g., dining out). The chart below shows how consumption of services continues to remain steady, but not back to pre-COVID levels. On March 1, 2021 it was estimated that there was $8,182 billion in consumption of services, a slight increase from the month prior but below the January 1, 2020 levels.

The expenditures on durable and non-durable goods are now increasing above pre-COVID levels with the amount spent on durable goods being $2,314 billion as of March 1, 2021 and the amount spent on non-durable goods being $3,342 billion.

According to the Case-Shiller Home Price Index, the average price of single-family dwellings sold in Metro Detroit was $148,500 in February of 2021; this was $1,500 higher than the average family dwelling price in January. The February 2021 price was an increase of $14,070 from February of 2020 and $49,430 from February of 2014. Home prices have continued to increase year-after-year but the recent average price of single-family dwellings sold in the Metro-Detroit area has increased at a higher rate than in previous years.  

Michigan’s Unemployment Benefits Lowest in the Region

The national average for weekly unemployment benefits in the United States is $468; $362 per week is what is provided in Michigan. Michigan has the lowest unemployment benefits of any state in the Great Lakes region and ninth lowest in the nation. In addition to the unemployment amount being $362 a week, that amount is traditionally paid for 20 weeks (it has currently been extended to 26 weeks due to the COVID-19 pandemic). Even with extended and additional unemployment benefits, families in Michigan continue to financially struggle.

According to the most recent Kids Count report, 56 percent of adults living in a household with children have reported losing income as of Nov. 9, 2020 in Michigan. The same report states that only 4 percent of adults living in a household with children in Michigan are receiving their full pay and not using leave for time not working, while 92 percent who are off work are not receiving any pay for their time off.

The October 2020 unemployment rate in Michigan was 5.1 percent, compared to 3.5 percent in October of 2019 (the most recent data available).  At the national level, according to the U.S. Bureau of Labor Statistics the unemployment rate was 6.9 percent of the non-farm working population. At the national and local level, unemployment rates aren’t as high as they were in April, when the pandemic first hit, but they are higher than they were compared to 2019.

So, as the pandemic continues we are more likely to see higher unemployment rates and more people unable to meet their needs from the unemployment benefits they receive (or should be receiving). According to a recent Money.com article, unemployment benefits in most states do not cover the basic needs of most families. This is due to the cost of living in a state (food, rent, utilities) compared to the amount and length of unemployment benefits received.

The map below shows the maximum unemployment an individual can receive in each state. Massachusetts has the highest amount of unemployment paid to an individual (with dependents) at $1,234 a week; it is also one of the wealthiest states. Conversely, Mississippi pays the lowest amount at $235. According to the article, Kentucky and Maine are among the poorest states in the Country but their unemployment benefits ($552 and $667, respectively) allow residents to cover their basic needs.  The unemployment benefits in Kentucky and Maine are higher than that of Michigan’s $362 a week.


According to the Economic Policy Institute, families with two adults and two children in the Detroit-Livonia-Warren metro need an annual income of $79,308 – or $6,609 per month – to live comfortably. With the an unemployment amount of $362 a week for 26 weeks (factoring in the pandemic) for an adult household of two (two adults bringing in income, but with two children as well), that brings in about $19,000 for the year—far below the amount a family with two children needs to live comfortably.

As the pandemic continues on, citizens and certain lawmakers continue to urge for additional relief to aide affected families and the economy. Just last week, Gov. Gretchen Whitmer called on the legislature to permanently extend the unemployment benefits length to 26 weeks and also increase the weekly amount (no amount was specified). No movement has been made on the request. Michigan’s current unemployment benefits were inked into law in 2002 and are due for an overhaul. The way it currently stands, hundreds of people could be left without unemployment benefits the day after Christmas because of a combination of having maxed out their time receiving Michigan unemployment benefits and the fact that federal COVID unemployment programs created through the CARES Act are set to expire. Changes to unemployment benefits need to take place at the State level, but help from the federal government is also necessary, especially during the pandemic. 

COVID Continues to Impact Michigan Economy

The COVID-19 pandemic continues to have an impact on the national, statewide and local economy. This will most certainly continue as new daily case numbers continue to rise. On Nov. 9, 2020 the State of Michigan reported 216,804 confirmed COVID cases, between Nov. 7 and Nov. 8 the Michigan Department of Health and Human Services estimated that was an average of 4,505 new COVID cases a day. Although Gov. Gretchen Whitmer does not have the executive powers she once did, the Michigan Department of Health and Human Services, and other agencies, have the ability to institute certain mandates. Currently, several—but certainly not all — businesses remain open, but scrutiny on safety precautions to slow the spread is increasing.

Current unemployment rates are discussed in this post to show one facet of the economic impact the pandemic has had on the economy. In future posts we will continue to dig into the other economic impacts of the virus, and also how local governments have fared with federal and state aide.

In September of 2020 the unemployment rates for the State of Michigan and for the City of Detroit declined from recent record highs as a result of COVID-19. However, unemployment rates remain higher now than at this time last year. The State of Michigan reported an unemployment rate of 8.2 in September, a lower rate than what was reported in August, which was 8.9. The State unemployment rate for September of 2019 was 3.5. In September of 2008, when the Great Recession was just getting underway, the unemployment rate was 8.4 percent.

For the City of Detroit, the unemployment rate for September of 2020 was 20.4, which is only slightly lower than the August rate of 20.9. In September of 2019 the unemployment rate was 8.1.

The data above shows a story that we are all familiar with now, the pandemic has had a direct affect on our economy locally and statewide. Another image the data highlights though is that the unemployment gap between the State and Detroit has grown wider since the pandemic hit. Federal Reserve Chairman Jerome Powell was recently quoted in the Detroit Free Press saying women, minorities and low-income workers are suffering the most in this downturn. Detroit is home to the largest black population in the state and also has among the highest percentage of residents who live at or below the poverty level.

The chart below displays the unemployment rates for each of the seven counties in Southeastern Michigan for September of 2019 and 2020. In September of 2020 Wayne County had the highest unemployment rate at 12.5. Washtenaw County had the lowest unemployment rate at 5. Each county though had a higher unemployment rate in September of this year compared to September of 2019. Just as Wayne County had the highest unemployment rate it also had the largest increase between 2019 and 2020; in that year it increased 7.1 points. Washtenaw County had the lowest increase at 1.7 points.

In addition to COVID impact employment rates, it has also impacted the housing stock and sale and rental rates. According to a recent Detroit Free Press article, housing prices continue to increase due a high demand but low stock of homes, low mortgage rates and also the fact that the early shutdown of the economy pushed the spring home selling season farther out into summer and now fall.

The chart below shows the Standard and Poor’s Case-Shiller Home Price Index for the Detroit Metropolitan Statistical Area. The index includes the price for homes that have sold but does not include the price of new home construction, condos, or homes that have been remodeled. While it does show an increase in average home prices, it has yet to reflect those of late summer and early fall.

According to the index, the average price of single-family dwellings sold in Metro Detroit was $132,460 in July of 2020; this was $131 higher than the average family dwelling price in June. The July 2020 price was an increase of $3,240 from July of 2019.

Michigan Employment Ramifications from COVID-19

Today, Gov. Gretchen Whitmer placed a three week stay-at-home order on the residents of Michigan to slow the spread of the coronavirus disease (COVID-19). This order, along with other executed orders issued in the last week means restaurants are limited to takeout, casinos are shuttered and the Big 3 (Ford, GM and Chrysler-Fiat) all temporarily closed their manufacturing plants, along with hundreds of other businesses deemed non-essential. As the number of confirmed cases in Michigan continue to rise so do the concerns about economic stability. Staying home and social distancing are necessities at a time like this but businesses, and their employees, are grappling with how to stay afloat. Some have the ability to have their employees work from home, others can pay their workers for some period of time despite being closed, and many employees are left without knowing where their next paycheck will come from.

According to Bridge Magazine, the Michigan Department of Labor and Economic Opportunity reported about 108,000 unemployment claims as between March 16-20, 2020. The same agency reported that the average weekly unemployment claims during the height of the Great Recession peaked at about 90,000.

To provide a better glimpse as to how many people in Michigan may be economically impacted due to this global pandemic we have provided the most recent annual employment numbers from the State for occupations and industries that have been or are most likely to be impacted.

All the employment data in this post is from the Michigan Department of Management, Technology and Budget and focuses on Metropolitan Statistical Areas (MSA) in Michigan, which are areas with a dense population at its core and close economic ties to the surrounding areas in the region. Not all MSAs in this post had data to reflect the industries or occupations examined in this post. Additionally, some State totals may vary from the totals in the pie charts due to the fact not all MSAs had data and some areas, such in the Upper Peninsula, do not have an MSA but do still have employees in the various industries and occupations examined.

The chart below shows the number of employees in 2019 of the various industries and occupations that are arguably amongst the hardest hit due to COVID-19, whether it be from being forced to or from being overworked due to community needs (health care workers and grocery stores, who have been deemed essential employees by the governor).

In 2019, there were 672,000 people who declared manufacturing as their occupation; this was the highest number in the State of Michigan of those examined in this post; those declaring health care and social assistance as their occupation came in second at 606,900. The food preparations and serving industry came in third with 392,900 people employed in the State of Michigan.

In breaking the data down further, we look at the same industries and occupations (if data was available) for the Detroit-Warren-Dearborn MSA. For just this area, the health care and social assistance occupation had the most number of employees at 288,300 in 2019, followed by manufacturing at 257,900. In the Detroit-Warren-Dearborn MSA there were 169,500 people in the food preparation and serving industry.

The two pie charts below highlight what areas (MSAs) are likely to be impacted the most in terms of unemployment as a result of COVID-19 related closures. Food preparation and serving and manufacturing were the only two occupations with comprehensive data sets for 2019, and as both charts show, the Detroit-Warren-Dearborn MSA had the highest number of employees (this is also the most densely populated area in the State). For food preparation and serving there were 169,950 employees in the Detroit-Warren-Dearborn MSA followed by the Grand Rapids-Wyoming MSA with 45,140 employees. For manufacturing there were 257,900 employees in the Detroit-Warren-Dearborn MSA in 2019 and 119,000 in the Grand Rapids-Wyoming MSA.

As the snapshots above show, thousands of people are at risk of being unemployed for an unknown amount of time. And, as noted earlier, the number of unemployment claims continue to rise as a result of COVID-19 and the precautions being taken to “flatten the curve.” In 2019 the unemployment rate for the State of Michigan was 4.1 percent, the lowest it has been since the start of the Great Recession in 2008. We certainly have a long way to go before unemployment rates reach what they were during the peak of the recession (14%) but with such a swift shift in employment for hundreds of thousands of people the possibility is certainly on the minds of many.

While the economic future of Michigan and the country is not exactly certain at this time, actions are being taken by federal and state officials to aid citizens. At the federal level officials are working to secure a coronavirus stimulus check for qualifying citizens and in Michigan Gov. Whitmer extended unemployment benefits, among other forms of support. For now, what we can do is adhere to the guidelines created by the Centers for Disease Control to “flatten the curve,” which include: remaining at home-especially when sick, keeping at least six feet away from others, washing your hands frequently for at least 20 seconds, covering coughs and sneezes and regularly cleaning frequently touched surfaces. Additionally, local businesses can be supported by: purchasing gift cards, donating to funds they may have created or are being supported through, ordering their products online or purchasing carry-out and writing your elected officials to find means to further support them through public policy decisions.

Unemployment numbers decreased with the holiday season

  • From October 2014 to December 2014, the unemployment rate across the state and in the City of Detroit’s decreased (monthly);
  • The Purchasing Manager’s Index for Southeast Michigan increased from November 2014 to December 2014 (monthly);
  • Commodity Price Index decreased from November 2014 to December 2014 for Southeast Michigan (monthly);
  • Wayne, Macomb and Oakland counties experienced decreases in the number of monthly building permits pulled.

Slide02According to the most recent data provided by the Michigan Department of Technology, Management, and Budget, the unemployment rate for the state of Michigan decreased from 7.1 percent in October to 6.3 percent in December. During this same period, unemployment in the city of Detroit also decreased from 15.1 in October percent to 12.2 percent.

Slide04

From November to December of 2014, the number of people employed in the city of Detroit increased by 1,775, leading to a total of 287,228 people employed in December.

Slide06

The above chart shows the number of people employed in the auto manufacturing industry in the Detroit Metropolitan Statistical Area (MSA) (Detroit-Warren-Livonia) from December 2013 to December 2014. From July 2014 to November 2014 employment in this industry has increased by 9,000 from 91,600 to 100,600. However, from November to December, that number stagnated, remaining at 100,600. This was still the highest it had been over the last year.

Slide08

The Purchasing Manger’s Index (PMI) is a composite index derived from five indicators of economic activity: new orders, production, employment, supplier deliveries, and inventories. A PMI above 50 means the economy is expanding.

According to the most recent data released on Southeast Michigan’s Purchasing Manager’s Index, the PMI for December 2014 was 64.2, an increase of 7.4 points from the prior month. As compared to December 2013, there has been an increase of 13.6 points.

Slide10

The Commodity Price Index, which is a weighted average of selected commodity prices, was recorded at 54.2 points in December 2014, which was 7.6 points lower than the previous month and 1.9 points higher than December 2013.

Slide12Slide13Slide14

The above charts show the number of residential building permits obtained each month in Oakland, Macomb, and Wayne counties from January 2013 until December 2014. These numbers are reported by local municipalities to the Southeastern Michigan Council of Governments and include single-family units, two-family units, attached condos, and multi-family units.


Oakland, Wayne, and Macomb counties all experienced a decrease in the number of building permits pulled from November 2014 to December 2014. These declines are largely seasonal, due to weather. Only Wayne County issued more permits in December 2014 than it did in December 2013. Oakland County issued 131 permits in December of 2014, a decrease of 10 compared to November 2014 and a decrease of 18 compared to December 2013. Macomb County issued 31 permits in December 2014, 47 fewer than in November 2014 and 52 fewer than in December 2013.

Wayne County issued nine fewer building permits in December than November of this year; in total 52 permits were pulled. This is seven more than the number pulled for the county in December 2013.