Michigan Employment Ramifications from COVID-19

Today, Gov. Gretchen Whitmer placed a three week stay-at-home order on the residents of Michigan to slow the spread of the coronavirus disease (COVID-19). This order, along with other executed orders issued in the last week means restaurants are limited to takeout, casinos are shuttered and the Big 3 (Ford, GM and Chrysler-Fiat) all temporarily closed their manufacturing plants, along with hundreds of other businesses deemed non-essential. As the number of confirmed cases in Michigan continue to rise so do the concerns about economic stability. Staying home and social distancing are necessities at a time like this but businesses, and their employees, are grappling with how to stay afloat. Some have the ability to have their employees work from home, others can pay their workers for some period of time despite being closed, and many employees are left without knowing where their next paycheck will come from.

According to Bridge Magazine, the Michigan Department of Labor and Economic Opportunity reported about 108,000 unemployment claims as between March 16-20, 2020. The same agency reported that the average weekly unemployment claims during the height of the Great Recession peaked at about 90,000.

To provide a better glimpse as to how many people in Michigan may be economically impacted due to this global pandemic we have provided the most recent annual employment numbers from the State for occupations and industries that have been or are most likely to be impacted.

All the employment data in this post is from the Michigan Department of Management, Technology and Budget and focuses on Metropolitan Statistical Areas (MSA) in Michigan, which are areas with a dense population at its core and close economic ties to the surrounding areas in the region. Not all MSAs in this post had data to reflect the industries or occupations examined in this post. Additionally, some State totals may vary from the totals in the pie charts due to the fact not all MSAs had data and some areas, such in the Upper Peninsula, do not have an MSA but do still have employees in the various industries and occupations examined.

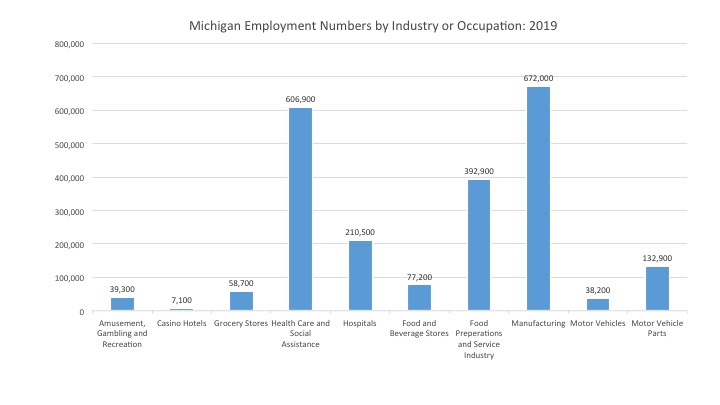
The chart below shows the number of employees in 2019 of the various industries and occupations that are arguably amongst the hardest hit due to COVID-19, whether it be from being forced to or from being overworked due to community needs (health care workers and grocery stores, who have been deemed essential employees by the governor).

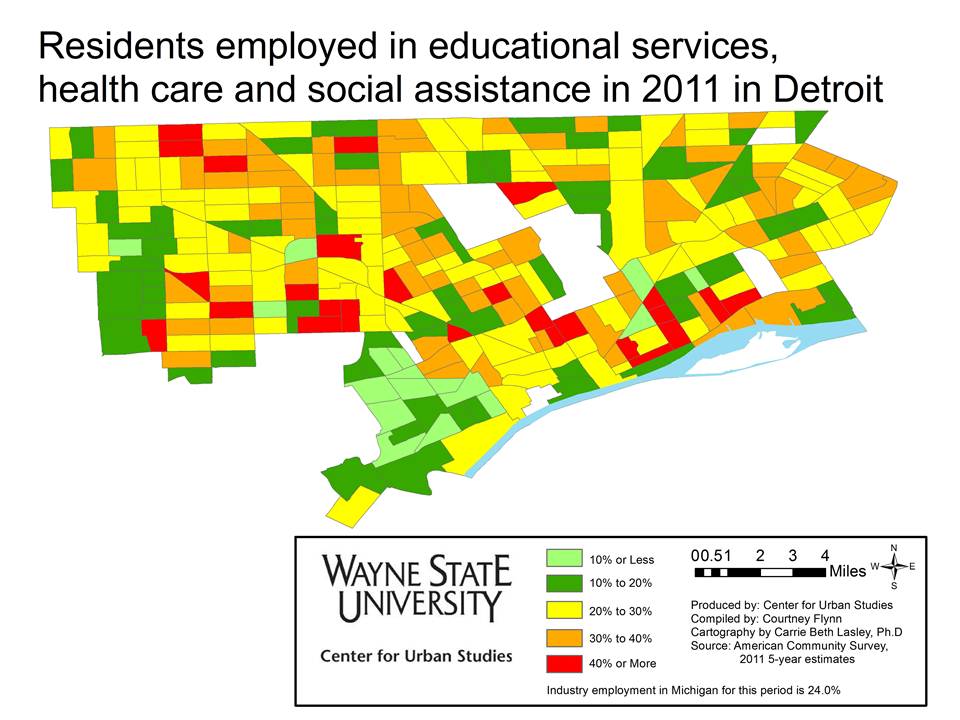
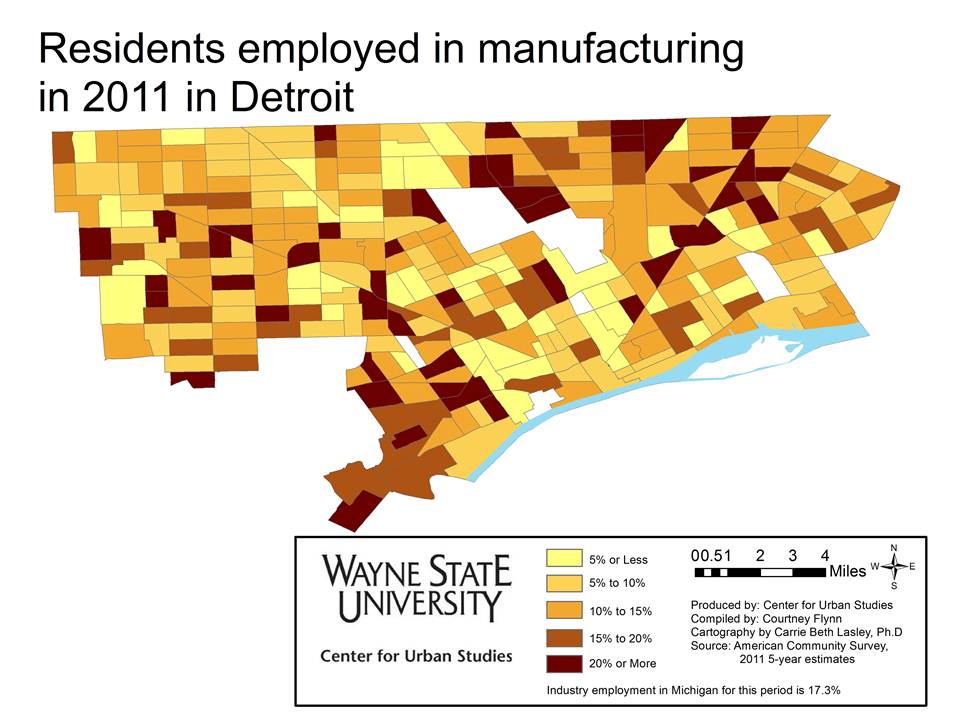
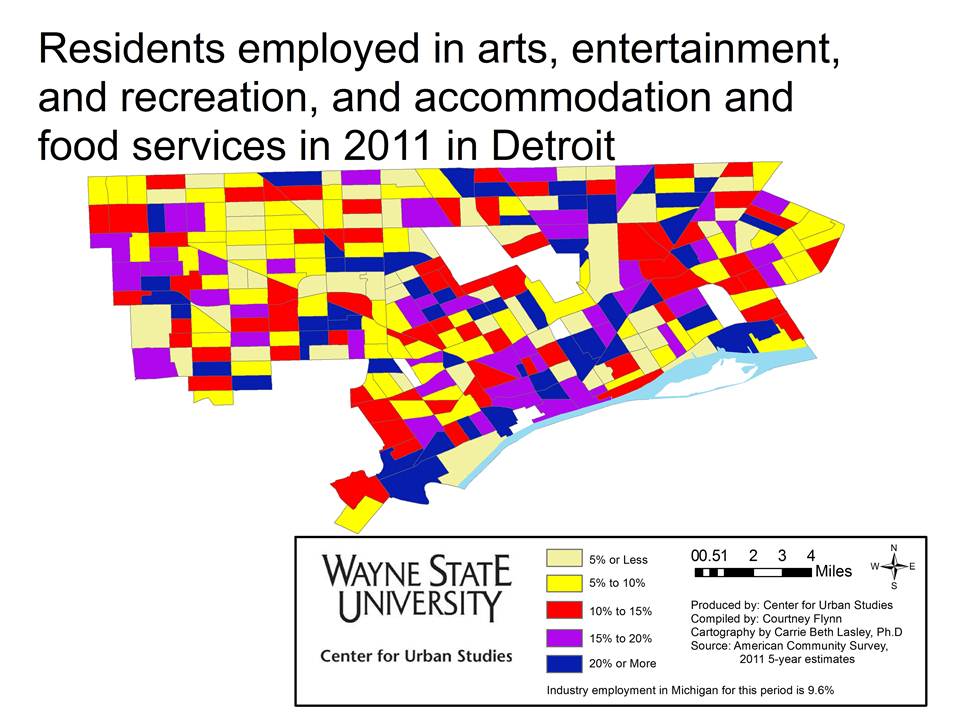
In 2019, there were 672,000 people who declared manufacturing as their occupation; this was the highest number in the State of Michigan of those examined in this post; those declaring health care and social assistance as their occupation came in second at 606,900. The food preparations and serving industry came in third with 392,900 people employed in the State of Michigan.

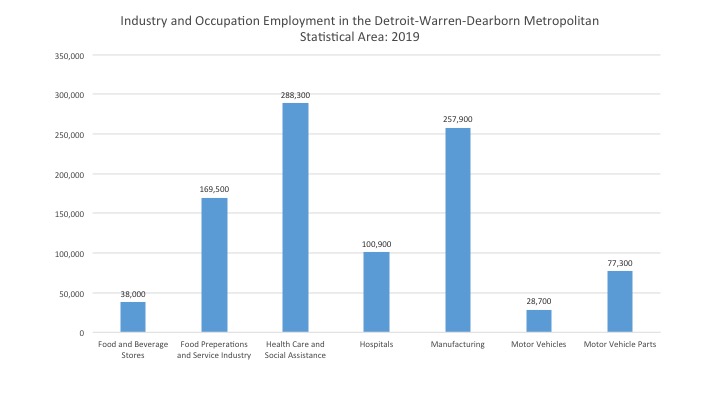
In breaking the data down further, we look at the same industries and occupations (if data was available) for the Detroit-Warren-Dearborn MSA. For just this area, the health care and social assistance occupation had the most number of employees at 288,300 in 2019, followed by manufacturing at 257,900. In the Detroit-Warren-Dearborn MSA there were 169,500 people in the food preparation and serving industry.

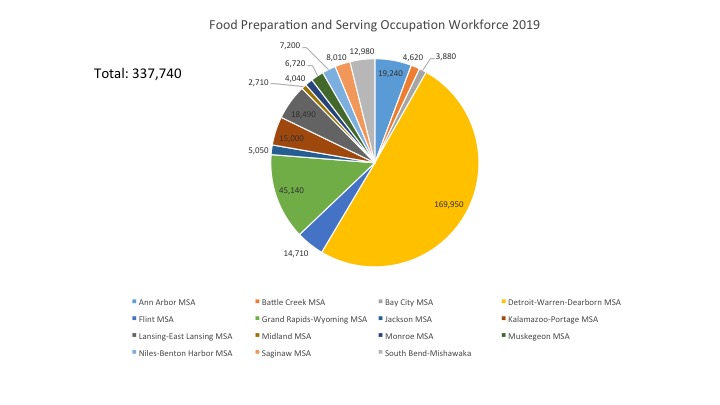
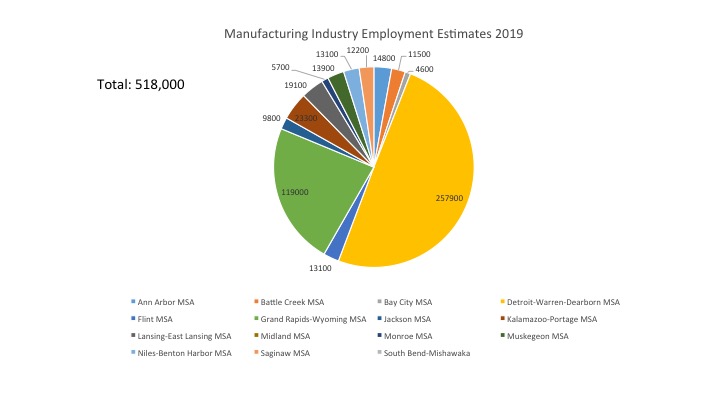
The two pie charts below highlight what areas (MSAs) are likely to be impacted the most in terms of unemployment as a result of COVID-19 related closures. Food preparation and serving and manufacturing were the only two occupations with comprehensive data sets for 2019, and as both charts show, the Detroit-Warren-Dearborn MSA had the highest number of employees (this is also the most densely populated area in the State). For food preparation and serving there were 169,950 employees in the Detroit-Warren-Dearborn MSA followed by the Grand Rapids-Wyoming MSA with 45,140 employees. For manufacturing there were 257,900 employees in the Detroit-Warren-Dearborn MSA in 2019 and 119,000 in the Grand Rapids-Wyoming MSA.

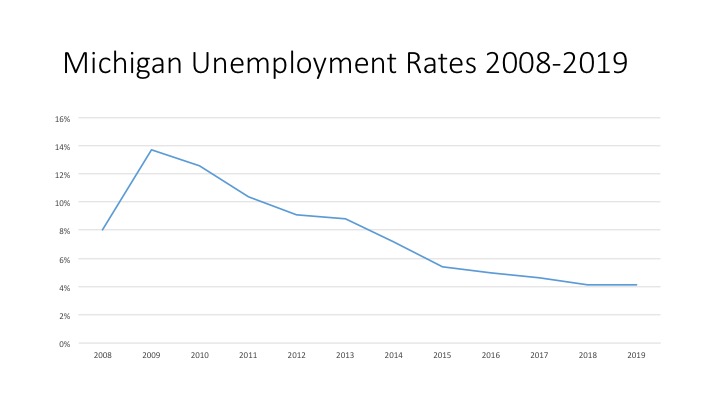
As the snapshots above show, thousands of people are at risk of being unemployed for an unknown amount of time. And, as noted earlier, the number of unemployment claims continue to rise as a result of COVID-19 and the precautions being taken to “flatten the curve.” In 2019 the unemployment rate for the State of Michigan was 4.1 percent, the lowest it has been since the start of the Great Recession in 2008. We certainly have a long way to go before unemployment rates reach what they were during the peak of the recession (14%) but with such a swift shift in employment for hundreds of thousands of people the possibility is certainly on the minds of many.

While the economic future of Michigan and the country is not exactly certain at this time, actions are being taken by federal and state officials to aid citizens. At the federal level officials are working to secure a coronavirus stimulus check for qualifying citizens and in Michigan Gov. Whitmer extended unemployment benefits, among other forms of support. For now, what we can do is adhere to the guidelines created by the Centers for Disease Control to “flatten the curve,” which include: remaining at home-especially when sick, keeping at least six feet away from others, washing your hands frequently for at least 20 seconds, covering coughs and sneezes and regularly cleaning frequently touched surfaces. Additionally, local businesses can be supported by: purchasing gift cards, donating to funds they may have created or are being supported through, ordering their products online or purchasing carry-out and writing your elected officials to find means to further support them through public policy decisions.

Most Detroit residents employed in health care, educational services, and social assistance industries

This post is an extension of last week’s (link here), in that we are showing which industries draw the most about of Detroit residents, ages 16 and older, for employment. Here  we examine the types of jobs by percentage of the working population in the City of Detroit in 2011, according to the five-year American Community Survey. To learn more about the specific occupations included in the different industries described  in this post please click here.

In reviewing the maps, a pattern similar to the region is reflected. The structure of the local economy is based around health care, educational services, social assistance, manufacturing, arts, entertainment, and food service industries.

According to the map, in the health care, educational services, and social assistance industries there were about 20 Census tracts that had 41 percent or more of the population employed in these services. There were also about 75 Census tracts where between 30 and 40 percent of the population was employed in these industries in 2011.The other top industries in which Detroit residents were employed in for the year 2011 were the arts, entertainment and recreation, accommodation, and food service industries. There were about 40 Census tracts in the city were 20 percent or more of the residents were employed in these industries. Manufacturing also had a large employment draw in the city; there were about 35 Census tracts within Detroit where 20 percent or more of the 16 years and older population was employed in the manufacturing industry.

Agriculture was the industry with the least amount of Detroit residents employed in it. All but five of the Census tracts had 5 percent or less of the population employed in the industry. The information and construction industries also had low draws. There was a pocket in southwest Detroit though where there was about 15 Census tracts in 2011 with 15 percent or more of the population employed in construction.

Detroit’s unemployment decreases, Purchasing Manager’s and Commodity Price indexes remain steady

•For the month of April 2013, Detroit’s unemployment rate decreased while the number of employed remained steady.
•When looking at the auto-manufacturing employment, the data showed employment in this industry continued to increase since January 2013 for the Detroit Metropolitan Statistical Area.
•Purchasing Manager’s Index remained steady from March 2013 to April 2013 for Southeast Michigan (monthly);
•Commodity Price Index decreased from March 2013 to April 2013 for Southeast Michigan (monthly);
•The most recent Consumer Price Index changes for all and all items less food and energy showed no increase (bi-monthly) for the Detroit-Ann Arbor-Flint area;
•Building permits pulled increased for Wayne and Oakland counties from March 2013 to April 2013; they decreased for Macomb County (monthly).
econ1

According to the most recent data provided by the Michigan Department of Technology, Management and Budget, the March 2013 and April 2013 unemployment rates for the State of Michigan were 8.8 and 8.4 per 100 people, respectively. Since July 2012, the unemployment rates for the State of Michigan decreased. For the City of Detroit, the unemployment rate for March and April of this year were 17.5 and 16. While there have been fluctuations in the city’s unemployment rate, the unemployment rate in the City of Detroit was 15.8 in April 2012, just .2 lower than the April 2013 rate.

Slide04

Since February 2013, the unemployment rate in the City of Detroit decreased while the number of employed slightly increased.

In March 2013, there were 280,363 employed Detroit residents and in April 2013 it was reported there were 280,367 people employed.

Slide06

The above chart shows the number of people employed in the auto manufacturing industry in the Detroit Metropolitan Statistical Area from April 2012 to April 2013. Employment sharply increased in January 2013 and continued to increase through April 2013. In April 2013, 92,800 people were employed in both the auto manufacturing and auto parts manufacturing industries, which is 15,300 more than were employed in this sector in April 2012.

Slide08

The Purchasing Manger’s Index (PMI) is a composite index derived from five indicators of economic activity: new orders, production, employment, supplier deliveries, and inventories; a PMI above 50 means the economy is expanding. According to the most recent data released on Southeastern Michigan’s Purchasing Manager’s Index, the number decreased by .4 points from March 2013 to April 2013; in April it was recorded at 55.3. The PMI of 55.3 indicates the economy was expanding. The recorded number for April of this year, however, is 7.3 points below where it was in 2012.

Slide10

The Commodity Price Index, which is a weighted average of selected commodity prices for Southeast Michigan, fluctuated throughout 2012. For January and February 2013 the index appeared to be following the same pattern as 2012. However,  there was a decrease of 8.8 points from March 2013 to April 2013. From February 2013 to April 2013 there was a 16.7 point decrease.  When comparing the Commodity Price Index from April 2012 to April 2013 there was a 6.9 point decrease.

Slide12

Slide13

The Consumer Price Index measures the change in prices. The prices which are measured are based on prices of “food, clothing, shelter, fuels, transportation fares, charges for doctors’ and dentists’ services, drugs, and the other goods and services that people buy for day-to-day living,” according to the Bureau of Labor Statistics.

The above graphs show the percent change in the price index measurements. This means although the graph appears to show a decrease from February there was no change since the percent change is 0.

The Consumer Price Index, which is reported every two months, did not change from February 2013 to April 2013 for the Detroit-Ann Arbor-Flint area. According to the Bureau of Labor Statistics this is mainly based on the fact that energy and food costs did not experience much increase within the past two months. From February to April there was a .1 decrease in the energy index and a .3 increase in the food index. The Consumer Price Index minus the prices of energy and food, shown in the second Consumer Price Index graph, also remained the same. This stability was based around the fact that the price for apparel and shelter rose while medical costs decreased, according to the BLS.

Slide15

Slide16

Slide17

The above charts show the number of residential building permits obtained each month in Oakland, Macomb, and Wayne counties from January 2012 until April 2013. These numbers are reported by local municipalities to the Southeastern Michigan Council of Governments and include single family, two family, attached condo, and multi-family units. Macomb County was the only one of the three counties that did not experience an increase in the number of permits obtained from March to April in either 2012 or 2013.  Oakland County had the largest increase in the number of building permits pulled from March to April of this year. For Oakland County, there was an increase in 82 permits pulled. In Wayne County, there was a 53 permit increase.

When comparing the number of permits pulled in April 2012 and April 2013, all three counties showed an increase over the previous year.

In the coming weeks Drawing Detroit will be posting a map showing where growth in the housing industry is taking place in Macomb, Oakland and Wayne counties; please check back for updates.