Most Detroit residents employed in health care, educational services, and social assistance industries

This post is an extension of last week’s (link here), in that we are showing which industries draw the most about of Detroit residents, ages 16 and older, for employment. Here  we examine the types of jobs by percentage of the working population in the City of Detroit in 2011, according to the five-year American Community Survey. To learn more about the specific occupations included in the different industries described  in this post please click here.

In reviewing the maps, a pattern similar to the region is reflected. The structure of the local economy is based around health care, educational services, social assistance, manufacturing, arts, entertainment, and food service industries.

According to the map, in the health care, educational services, and social assistance industries there were about 20 Census tracts that had 41 percent or more of the population employed in these services. There were also about 75 Census tracts where between 30 and 40 percent of the population was employed in these industries in 2011.The other top industries in which Detroit residents were employed in for the year 2011 were the arts, entertainment and recreation, accommodation, and food service industries. There were about 40 Census tracts in the city were 20 percent or more of the residents were employed in these industries. Manufacturing also had a large employment draw in the city; there were about 35 Census tracts within Detroit where 20 percent or more of the 16 years and older population was employed in the manufacturing industry.

Agriculture was the industry with the least amount of Detroit residents employed in it. All but five of the Census tracts had 5 percent or less of the population employed in the industry. The information and construction industries also had low draws. There was a pocket in southwest Detroit though where there was about 15 Census tracts in 2011 with 15 percent or more of the population employed in construction.

Jobs in healthcare on the rise

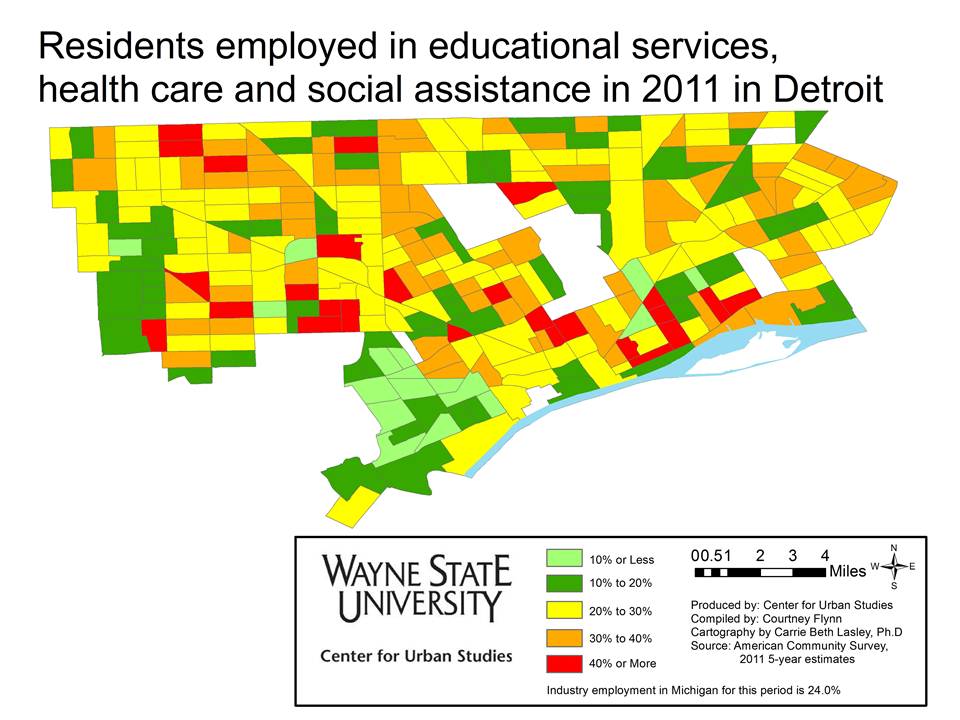
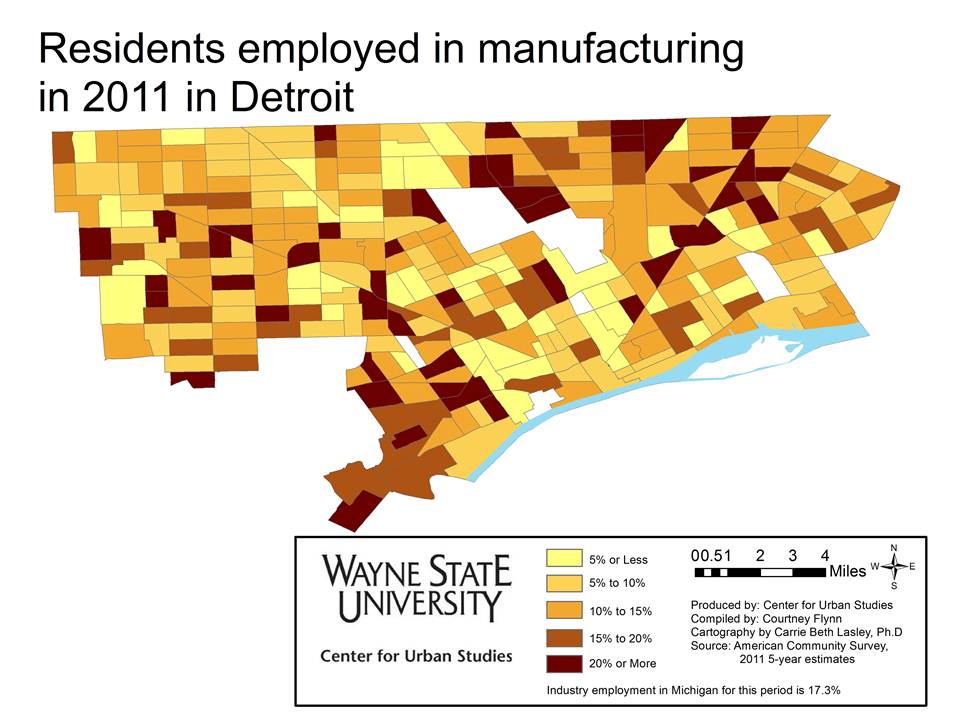
A look at the information presented below shows the numbers of healthcare related jobs becoming available are on the rise. As this industry is expected to grow in the Detroit area (Lapeer, Monroe, Macomb, Oakland, St. Clair and Wayne counties) job loss in the manufacturing industry is expected to continue through 2018. Overall in the area there is expected to be about 112,000 more jobs added to the Detroit area labor market through 2018; this is a 5.5 percent growth.

All of the information presented on job growth and decline spans over 10 years, from 2008 to 2018.

Of the industry and occupation forecasts examined in this post, the industry forecasts are produced by the Michigan Department of Management, Technology and Budget.  The industry forecasts are based on historical job trends in the specific industry and the expected short-term, or long-term demand, in those sectors. These demands are determined by industry experts and the Michigan Department of Management, Technology and Budget. Once the industry projections are produced, information on occupational staffing patterns and the shifting trends in such occupational patterns are examined. The examination of these patterns is then used to generate the occupational forecasts.

According to the Michigan Department of Management, Technology and Budget, since a specific occupation is often found in many industries, the relative concentration of an occupation in high demand or low demand industries impacts the overall expected growth rate.  Technology factors are also used because the impact of technological change can decrease or increase future jobs in specific occupations.

growth1

growth2

The above charts show the top 10 jobs the Michigan Department of Technology, Management and Budget predicts will experience the highest percent of growth from 2008-2018 in the Detroit area. While the percentage of growth for the above occupations range from 48 to 26 percent, the raw numbers show the growth will not be that significant. For example, there is a projected 36.3 percent growth in the financial examiner occupation in the Detroit area through 2018. However, when looking at the raw numbers it shows that 36 percent growth is equivalent to 65 jobs over a 10 year span.

Occupations are defined as a set of activities or tasks that persons are paid to perform. Someone can have the same occupation as another person and not be employed in the same industry.

growth3

The above chart shows the expected top 10 growing occupations in the Detroit area through 2018, based on raw or absolute numbers. While three health related occupations are on the top 10 list based on percent of growth, they did not make this top 10 list on raw numbers. According to the Michigan Department of Technology, Management and Budget, healthcare practitioners and technical related occupations will experience the most growth with an expected 18,911 increase in jobs through 2018. There are four healthcare related occupations that are expected to add about 92,000 jobs in the Detroit area in the coming years. The two computer and technology occupations on the list are expected to add about 19,000 jobs.

growth4

growth5

While health and computer related fields are among the occupations suggested to experience growth through 2018, it is the manual labor based jobs that are suggested to decline, according to the Michigan Department of Technology, Management and Budget. The above two charts show the top 10 declining occupations in the Detroit area based on percent of decline. Drilling and boring occupations are expected to decline the most by percent through 2018. However, when looking at the raw numbers of the 10 occupations shown above, postal service sorters and processors are expected lose the most number of jobs.

growth6

When examining the top 10 occupations expected to experience the most job loss through 2018 based on raw numbers, most are related to manufacturing processes.  There is only one listed in the top 10 declining occupations based on percent decline. This occupation is the postal service sorters and processors. The Michigan Department of Technology, Management and Budget expects there to be a loss of 1,006 positions in this occupation through 2018. The production occupation is expected to experience the largest decline in jobs, based on raw numbers from 2008 to 2018. There is an estimated loss of 16,818 jobs.

growth8

growth9

Of the top 10 growing industries in the Detroit area, based on percent growth, three are healthcare related and one is technology related. When examining the raw numbers of the top 10 growing industries based on percent growth the healthcare and social assistance industry is expected to grow the most, by 47,421 jobs in the 10 year period.

An industry is a group of establishments that produces similar goods and services.

growth10

When just examining the raw numbers of expected job increases of the top growing industries in the Detroit area, the healthcare and social assistance industry is expected to experience the most amount of growth. This industry is expected to produce an additional 47,421 jobs through 2018.

Slide18

Slide19

When looking at the raw numbers of the industries presented in the above two charts, fabricated metal product manufacturing is expected to experience the largest decline with a loss of 4,144 jobs. Machine manufacturing came in closely behind with an expected loss of 3,836 jobs.

Slide21

When examining declining industries in the Detroit area, six of the top 10 declining industries, based on percent of decline, match those on the top 10 declining list based on just the raw numbers.  Of those six that match both lists, four industries are manufacturing based. Overall, the Michigan Department of Technology, Management and Budget is expecting a loss of 40,332 manufacturing related industry jobs in the Detroit area through 2018.

For further information on Michigan’s “Hot 50” jobs visit here.

Detroit’s unemployment decreases, Purchasing Manager’s and Commodity Price indexes remain steady

•For the month of April 2013, Detroit’s unemployment rate decreased while the number of employed remained steady.
•When looking at the auto-manufacturing employment, the data showed employment in this industry continued to increase since January 2013 for the Detroit Metropolitan Statistical Area.
•Purchasing Manager’s Index remained steady from March 2013 to April 2013 for Southeast Michigan (monthly);
•Commodity Price Index decreased from March 2013 to April 2013 for Southeast Michigan (monthly);
•The most recent Consumer Price Index changes for all and all items less food and energy showed no increase (bi-monthly) for the Detroit-Ann Arbor-Flint area;
•Building permits pulled increased for Wayne and Oakland counties from March 2013 to April 2013; they decreased for Macomb County (monthly).
econ1

According to the most recent data provided by the Michigan Department of Technology, Management and Budget, the March 2013 and April 2013 unemployment rates for the State of Michigan were 8.8 and 8.4 per 100 people, respectively. Since July 2012, the unemployment rates for the State of Michigan decreased. For the City of Detroit, the unemployment rate for March and April of this year were 17.5 and 16. While there have been fluctuations in the city’s unemployment rate, the unemployment rate in the City of Detroit was 15.8 in April 2012, just .2 lower than the April 2013 rate.

Slide04

Since February 2013, the unemployment rate in the City of Detroit decreased while the number of employed slightly increased.

In March 2013, there were 280,363 employed Detroit residents and in April 2013 it was reported there were 280,367 people employed.

Slide06

The above chart shows the number of people employed in the auto manufacturing industry in the Detroit Metropolitan Statistical Area from April 2012 to April 2013. Employment sharply increased in January 2013 and continued to increase through April 2013. In April 2013, 92,800 people were employed in both the auto manufacturing and auto parts manufacturing industries, which is 15,300 more than were employed in this sector in April 2012.

Slide08

The Purchasing Manger’s Index (PMI) is a composite index derived from five indicators of economic activity: new orders, production, employment, supplier deliveries, and inventories; a PMI above 50 means the economy is expanding. According to the most recent data released on Southeastern Michigan’s Purchasing Manager’s Index, the number decreased by .4 points from March 2013 to April 2013; in April it was recorded at 55.3. The PMI of 55.3 indicates the economy was expanding. The recorded number for April of this year, however, is 7.3 points below where it was in 2012.

Slide10

The Commodity Price Index, which is a weighted average of selected commodity prices for Southeast Michigan, fluctuated throughout 2012. For January and February 2013 the index appeared to be following the same pattern as 2012. However,  there was a decrease of 8.8 points from March 2013 to April 2013. From February 2013 to April 2013 there was a 16.7 point decrease.  When comparing the Commodity Price Index from April 2012 to April 2013 there was a 6.9 point decrease.

Slide12

Slide13

The Consumer Price Index measures the change in prices. The prices which are measured are based on prices of “food, clothing, shelter, fuels, transportation fares, charges for doctors’ and dentists’ services, drugs, and the other goods and services that people buy for day-to-day living,” according to the Bureau of Labor Statistics.

The above graphs show the percent change in the price index measurements. This means although the graph appears to show a decrease from February there was no change since the percent change is 0.

The Consumer Price Index, which is reported every two months, did not change from February 2013 to April 2013 for the Detroit-Ann Arbor-Flint area. According to the Bureau of Labor Statistics this is mainly based on the fact that energy and food costs did not experience much increase within the past two months. From February to April there was a .1 decrease in the energy index and a .3 increase in the food index. The Consumer Price Index minus the prices of energy and food, shown in the second Consumer Price Index graph, also remained the same. This stability was based around the fact that the price for apparel and shelter rose while medical costs decreased, according to the BLS.

Slide15

Slide16

Slide17

The above charts show the number of residential building permits obtained each month in Oakland, Macomb, and Wayne counties from January 2012 until April 2013. These numbers are reported by local municipalities to the Southeastern Michigan Council of Governments and include single family, two family, attached condo, and multi-family units. Macomb County was the only one of the three counties that did not experience an increase in the number of permits obtained from March to April in either 2012 or 2013.  Oakland County had the largest increase in the number of building permits pulled from March to April of this year. For Oakland County, there was an increase in 82 permits pulled. In Wayne County, there was a 53 permit increase.

When comparing the number of permits pulled in April 2012 and April 2013, all three counties showed an increase over the previous year.

In the coming weeks Drawing Detroit will be posting a map showing where growth in the housing industry is taking place in Macomb, Oakland and Wayne counties; please check back for updates.

Detroit’s unemployment decreases, number of auto-manufacturing jobs remains steady

For the month of February, Detroit’s unemployment rate decreased while the number of employed began to increase. When looking at the auto-manufacturing field specifically, there was only a slight increase in the number of people employed from January to February.

•Unemployment and underemployment rates decrease, while the number of employed increases. The number of auto manufacturing and auto parts manufacturing employees remained steady from January 2013 to February (monthly);
•Purchasing manager’s index decreased from January 2013 to February 2013 (monthly);
•Commodity price index increased from January 2013 to February 2013s (monthly);
•The most recent consumer price index changes for all and all items less food and energy increased (bi-monthly);
•Building permits pulled decreased for Wayne, Oakland and Macomb counties from February to March. When comparing March of this year to March of 2012, the number of building permits pulled for each county is below what was pulled at this time last year (monthly).
econ1

According to the most recent data provided by the Michigan Department of Technology, Management and Budget, the February 2013 unemployment rate for the State of Michigan was 8.8 per 100 people, which is 0.1 below where it was from November of 2012 to January of 2013. For the City of Detroit, 18 percent of the population were unemployed in January 2013; the February rate is a decrease of 1.8 percent from the city’s percentage of unemployed in January.

econ2

The number of employed in the City of Detroit increased by 3,810 people from January to February of 2013.

econ3

The above chart shows the number of people employed in auto manufacturing industry in the Detroit Metropolitan Statistical Area throughout 2012 and into 2013. Employment peaked in February 2013 continued to increase from its January peak. With 90,700 people being employed in both the auto manufacturing and auto parts manufacturing industries this is 200 more people than January. This is also 12,400 more people employed in this sector of the job market than in February of 2012.

econ4

Although the underemployment rate in Michigan and the U.S declined for 2012, it is still about 5 percentage points above where it was in 2006, for both. Also, it should be noted that Michigan’s underemployment rate has consistently remained above that of the U.S.

According to the Bureau of Labor Statistics, this measure of worker underutilization includes the total unemployed, total of part-time employed for economic reasons, discouraged workers, and other marginally attached workers. This measure of the underemployment  does not consider this group of people as unemployed because they had not looked for work in the four weeks prior to the rate being calculated.

To learn more on underemployment read the following articles:

http://www.nytimes.com/2013/04/20/business/part-time-work-becomes-full-time-wait-for-better-job.html

http://www.nytimes.com/2013/04/22/opinion/krugman-the-jobless-trap.html?_r=0

econ5

According to the most recent data released on Southeastern Michigan’s Purchasing Manager’s Index, the number increased by 4 points from February 2013 to March 2013; in March it was recorded at 55.7. The recorded number for February of this year is 10.4 points below where it was in 2012. The Purchasing Manger’s Index (PMI) is a composite index derived from five indicators of economic activity: new orders, production, employment, supplier deliveries, and inventories; a PMI above 50 means the economy is expanding. The PMI of 55.7 means expansion continues and with the rise of 4 points in month it means that expansion was accelerated.

econ6

The Commodity Price Index, which is a weighted average of selected commodity prices for Southeast Michigan, fluctuated throughout 2012. For January and February of 2013 it appeared to be following the same trend as 2012. However, for the month of March there was a decrease from February; the decrease was by 10.4 points. Also, when comparing the Commodity Price Index from March 2012 to March 2013 there was a 6.7 point decrease.

econ7

econ8

econ9

The above charts show the number of residential building permits obtained each month in Oakland, Macomb, and Wayne counties from February 2012 until the present. These numbers are reported by local municipalities to the Southeastern Michigan Council of Governments and include single family, two family, attached condo, and multi-family units. The information presented shows that the number of building permits obtained in Wayne, Oakland and Macomb counties this month decreased from February and is also below where they were in March of 2012. Macomb County had the largest difference in numbers reported in March of 2012 and March of 2013. For 2012, Macomb County reported that 172 building permits were pulled and in 2013 it has been reported that 72 permits were pulled.

According to the Southeastern Michigan Council of Governments data used for these charts, there have been zero building permits pulled in the City of Detroit in 2013 thus far.

Detroit’s unemployment rises as population shows sign of leveling off

Although it appears Detroit’s population is beginning to steady, the start of 2013 showed increased unemployment rates and zero growth for the number of building permits pulled.

•Since 2010 Detroit’s population has appeared to be steadying, only experiencing slight decline;
•For the tri-county area, the population’s in Macomb and Oakland counties have been increasing while Wayne County’s population has been historically declining.
•Unemployment rate increases, while the number of employed decreases. The number of auto manufacturing and auto parts manufacturing employees also increased from December 2012 to January 2013 though (monthly);
•Purchasing manager’s index decreased from January 2013 to February 2013 (monthly);
•Commodity price index increased from January 2013 to February 2013s (monthly);
•The most recent consumer price index changes for all and all items less food and energy increased (bi-monthly);
•Building permits increase for Oakland and Macomb counties in January and February 2013, compared to the same months in 2012. In Wayne County, the number of permits in the first two months of year declined, compared to last year from last year to this year (monthly) . No building permits were pulled for Detroit.
Econ1

Overall, the City of Detroit’s population has experienced a decline, going from about 1.5 million residents in 1970 to 677,891 in 2012. However, from 2010, when the U.S. Census Bureau released its most recent Census data, to 2012, the population has seemed to somewhat stabilize. From 2010 to 2012 there was a decline of 35,109 residents. This decline is based on 2010 Census data and compared with Southeastern Michigan Council of Governments data (2012). The biannual population estimates from SEMCOG are based on trends from area demographics.

Econ2


Since 1970, Oakland and Macomb counties have experienced population increases while Wayne County has experienced a population decline. From 2010 to 2012 Oakland County’s population increased from 1,203,012 to 1,216,207. In that same time frame Macomb County’s population increased from 841,126 in 2010 to 843,435. Wayne County had a population decline of  1,815,734 in 2010 to 1,787,920.

All information is based on Census data, except for the 2012 data. These numbers are Southeastern Michigan Council of Governments data; the biannual population estimates from SEMCOG are based on trends from area demographics.

Econ3

According to the most recent data provided by the Michigan Department of Technology, Management and Budget, the January 2013 unemployment rate for the State of Michigan was 8.9 per 100 people, which is the same as it was in November and December of last year. For the City of Detroit, 19.8 percent of the population were unemployed in January 2013; this is an increase 1.7 percent from the city’s percentage of unemployed in December 2012 .

Econ4

The number of employed in the City of Detroit decreased by 2,043 people from January to February of 2013. From October 2012 to January 2013 there was a loss of 5,407 employed people.

Econ5

The above chart shows the number of people employed in auto manufacturing industry in the Detroit Metropolitan Statistical Area throughout 2012 and into 2013. Employment peaked in January 2013, with 90,700 people being employed in both the auto manufacturing and auto parts manufacturing industries. This is 10,400 more people employed from the previous peak of 80,300 employees in March of 2012.

econ6

According to the most recent data released on Southeastern Michigan’s Purchasing Manager’s Index, the number decreased by 3.6 points from January 2013 to February 2013; in February it was recorded at 51.7. The recorded number for February of this year is13.4 points below where it was in 2012.The Purchasing Manager’s Index (PMI) is a composite index derived from five indicators of economic activity: new orders, production, employment, supplier deliveries, and inventories; a PMI above 50 means the economy is expanding. The PMI of 51.7 means the economy continues to expand.

Econ7

The Commodity Price Index, which is a weighted average of selected commodity prices for Southeast Michigan, fluctuated throughout 2012 and, so far, is appearing to follow a similar trend in 2013. However, the Commodity Price Index has been reported at slightly higher levels for January and February of 2013 than it was in the same months for 2012.  From January 2013 to February 2013 the Commodity Price Index increased from 58.9 to 66.7. The score in February 2013 is .2 points above where the Commodity Price Index was in February of 2012.

Econ8

Econ9

The Consumer Price Index, which is reported every two months, increased 1.1 percent from December of 2012 to February of this year. From February of 2012 until last month the CPI increased .7 percent in the Detroit-Ann Arbor-Flint area. The Consumer Price Index measures the change in prices in a fixed market. The prices which are measured are based on prices of “food, clothing, shelter, fuels, transportation fares, charges for doctors’ and dentists’ services, drugs, and the other goods and services that people buy for day-to-day living,” according to the Bureau of Labor Statistics. Increased prices for energy (a 3.9 percent increase) and a .3 percent increase in the food index were noted for the change.

The Consumer Price Index, minus the prices of energy and food, shown in the second Consumer Price Index graph, increased .8 percent from December to February. This was because of pricing related to shelter recreation, and motor vehicles, according to the BLS.

Econ10Econ11

Econ12

The above charts show the number of residential building permits obtained each month in Oakland, Macomb, and Wayne counties from January 2012 until the present. These numbers are reported by local municipalities to the Southeastern Michigan Council of Governments and include single family, two family, attached condo, and multi-family units. The information presented shows that the number of building permits obtained in Oakland and Macomb counties this year, so far, are higher than those pulled in January and February of last year. While the Oakland County numbers are higher for 2013 than 2012 thus far, from January to February of 2013 there was  decline of permits pulled. In Oakland County, 222 have permits have been pulled in 2013, so far, and in Macomb County 284 have been pulled. In Wayne County, on the other hand, there has been a decrease in the number of building permits pulled for January and February of 2013 compared to them same months in 2012. In 2012 a total of 102 permits were pulled for both months and in 2013 there have been 107 pulled.

In 2013 thus far, Macomb County leads with the most number of building permits pulled.

According to the Southeastern Michigan Council of Governments data used for these charts, in January and February of 2013 zero building permits have been pulled in the City of Detroit.