The Motor City and Automotive Industry still dictate state’s export economy

The Southeast Michigan region was the fifth largest export market in the United States in 2013 according to U.S. Census Bureau Statistics, with more than $53.9 billion in exports. In the same year, the state of Michigan reported $58.7 billion in exports, making the region (which includes Lapeer County in the Southeast Michigan) responsible for 91.8 percent of the state’s export economy. This post explores the role of exports in the regional economy and examines how trade connects the region to the world economy.

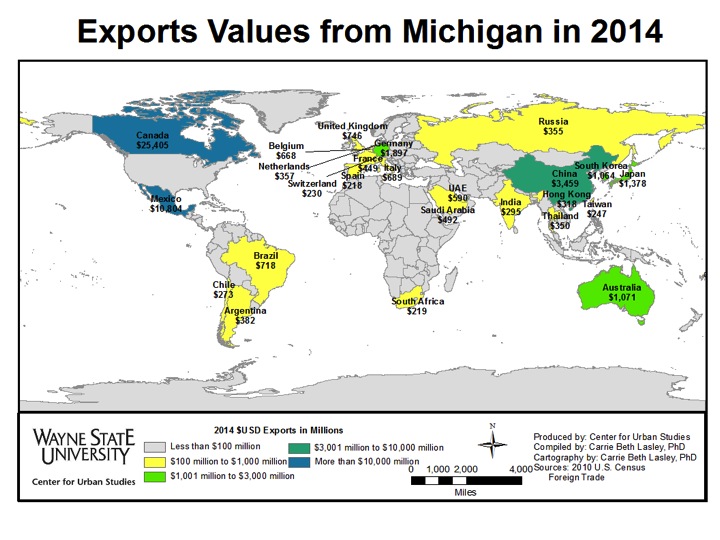
The map above shows the top 25 export recipients receiving goods originating in Michigan in 2014. In 2014, Michigan exports accounted for 3.4 percent of the national export total, by value. Among the top 25 export recipients are countries on six of seven continents. The strongest partnership is with neighboring Canada at more than $25,405 million. Fellow North American Free Trade Agreement (NAFTA) partner Mexico follows Canada, but is well behind at $10,804 million.

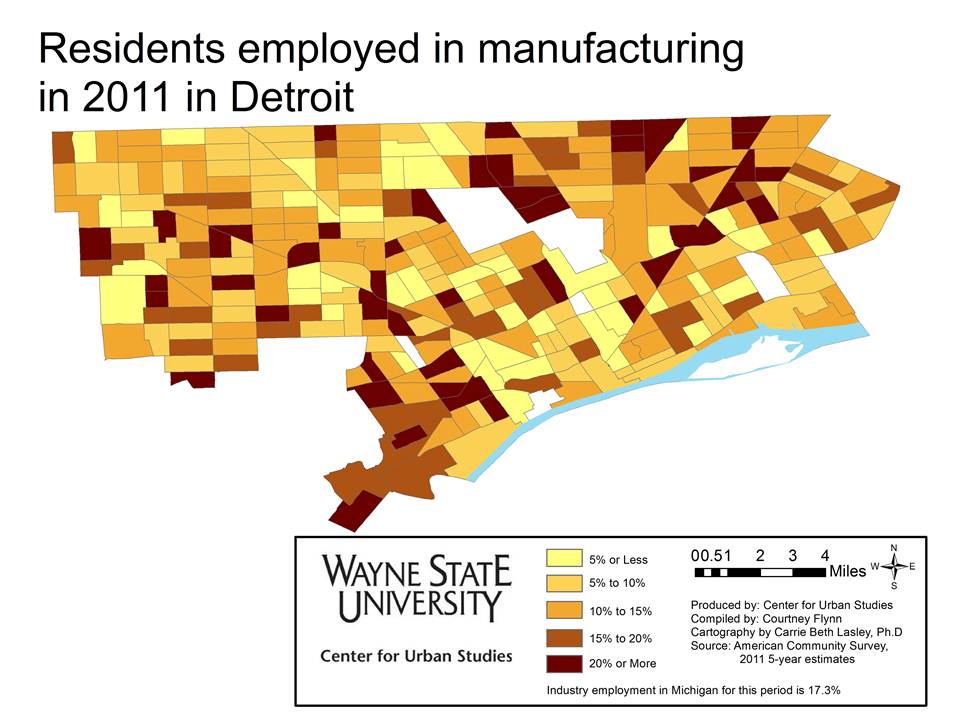
Export statistics support Michigan’s case as a leader in automotive manufacturing, and this is driven by Detroit. Of the top 25 products being exported, 21 were automotive parts or vehicles; they comprised 45.4 percent of all exports from the state of Michigan in 2014, and grew by 2.9 percent, on average, between 2013 and 2014. Exported products that were not directly related to the automotive industry were aircraft parts, natural gas, iron ore and medicines. These products represented just 6.6 percent of all exports, by value, and saw an average growth of just 2.7 percent from 2013 to 2014.

In 2013 Wayne County produced the lion’s share of exports by value in the region ($31 billion), more than double the second-highest exporting county (Oakland at $14.5 billion), according to the International Trade Administration (ITA), a division of the U.S. Department of Commerce, using Census data from 2013.

The ITA also indicates that exports were not predominantly the Big 3 automakers exporting finished products, but small producers of automotive parts. In 2011, 7,215 different businesses exported out of metropolitan region, with 90 percent of exports coming from firms employing fewer than 500 employees, according to the ITA.

The next two maps look specifically at the Ports of Detroit (this includes two ports, Detroit Metropolitan Airport and the Port of Detroit – a container port). These maps show export partners by value and by weight for 2010, the last year for which the Census Bureau has port-specific data publicly available. When examined by value, Detroit sent a great deal of export value in 2014 ($USD) to Canada and Western Europe. No country outside these two regions received more than $25 million in exports from Detroit. Nations with robust automotive industries of their own – Germany, the United Kingdom and France – are among some of the largest recipients of Detroit products.

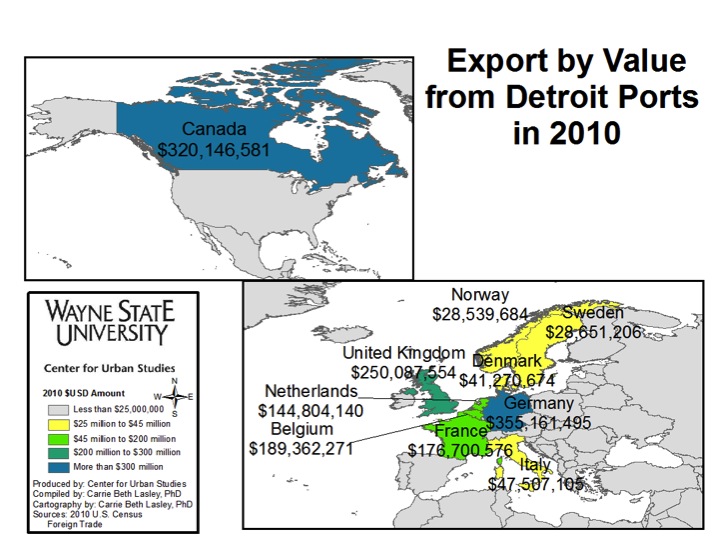
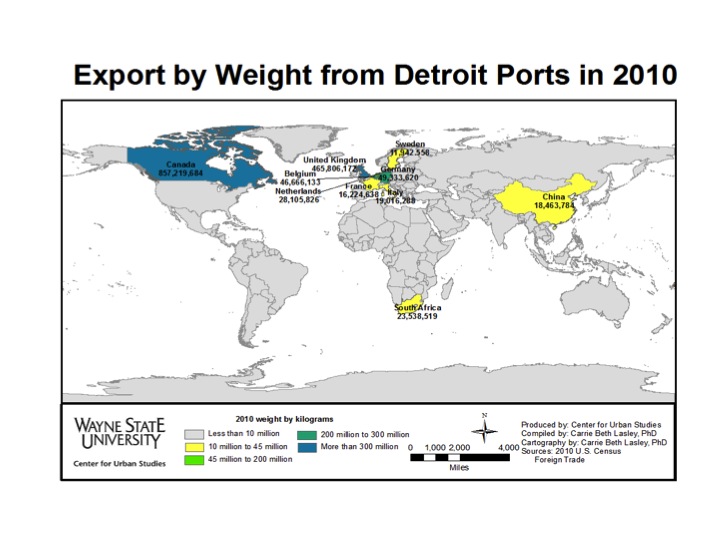
When examined by weight, a more broad trade geography emerges. Including this measure allows us to see more clearly where finished vehicles and iron ores are going. While Canada, Germany and the United Kingdom still lead among export recipients when considered by weight, South Africa and China emerge as significant trade partners.

The ITA indicates that since 2010 Michigan has seen a noteworthy increase in trade (by value) with Mexico, Saudi Arabia, China and the United Arab Emirates, which have overtaken many of the European nations to join Canada among the top five recipients of Detroit-area exports.


Opting-Out limits manufacturing employment opportunities for the transit dependent

James Robertson, has been coined Detroit’s “walking man” because of his tenacity in earning a perfect attendance mark at his suburban factory job all while walking nearly 21 miles round trip from Detroit to Rochester Hills. Without a car, Robertson must hobble together a defunct set of bus routes, leaving him no choice but to walk most of the distance into the Detroit suburbs. This story is surely one of many in the Metro-Detroit are, begging the question: Why is the public transit system in the Detroit area far less than mediocre?

Drawing Detroit sets out to illustrate the issue and to discuss how allowing communities to opt out of transit service can limit employment opportunities and create a situation of economic injustice.

Below is a map showing the number of manufacturing employees reported to the 2012 Economic Census of the U.S. Census Bureau in 2012 along with the transit status of communities in Wayne and Oakland counties. Aside from the Detroit Department of Transportation, the only existing transit system that is close being considered somewhat regional is Suburban Mobility Authority for Regional Transit (SMART). SMART has bus lines that run throughout Wayne, Oakland and Macomb counties. In Wayne and Oakland counties municipalities have the option to either opt-in or opt-out supporting SMART, and therefor having it run through their community. In Oakland, the majority of communities-55 percent of 33 of 60- have opted out. In Macomb County, all municipalities support SMART; they do not have the option to opt-out. Because of this, they are irrelevant to the discussion.

Some critics of the Free-Press article on Robertson indicated that there has been little need for low-skill workers in Detroit and other poorer communities to travel into these opt-out communities for employment or otherwise, characterizing these suburbs as bedroom communities with limited job prospects for transit-dependent workers. A quick examination of the map below indicates this is a fallacy. Many manufacturing jobs have moved to the suburbs, following its workforce and also seeking out new facilities and campuses in unsettled areas. Opt-out communities including Oxford Township, Novi and Canton have in excess of 2,000 manufacturing jobs located in their boundaries; Livonia had 9,447 manufacturing jobs in 2012.

In total, 38,461 manufacturing jobs were located in opt-out communities in these two counties, representing 34.1 percent of all manufacturing jobs in the two-county area. Broken down by county, it is 29.6 percent (19,484 manufacturing jobs) of Wayne County’s manufacturing employment and 40.6 percent (18,977 manufacturing jobs) of Oakland’s manufacturing employment.

Most Detroit residents employed in health care, educational services, and social assistance industries

This post is an extension of last week’s (link here), in that we are showing which industries draw the most about of Detroit residents, ages 16 and older, for employment. Here  we examine the types of jobs by percentage of the working population in the City of Detroit in 2011, according to the five-year American Community Survey. To learn more about the specific occupations included in the different industries described  in this post please click here.

In reviewing the maps, a pattern similar to the region is reflected. The structure of the local economy is based around health care, educational services, social assistance, manufacturing, arts, entertainment, and food service industries.

According to the map, in the health care, educational services, and social assistance industries there were about 20 Census tracts that had 41 percent or more of the population employed in these services. There were also about 75 Census tracts where between 30 and 40 percent of the population was employed in these industries in 2011.The other top industries in which Detroit residents were employed in for the year 2011 were the arts, entertainment and recreation, accommodation, and food service industries. There were about 40 Census tracts in the city were 20 percent or more of the residents were employed in these industries. Manufacturing also had a large employment draw in the city; there were about 35 Census tracts within Detroit where 20 percent or more of the 16 years and older population was employed in the manufacturing industry.

Agriculture was the industry with the least amount of Detroit residents employed in it. All but five of the Census tracts had 5 percent or less of the population employed in the industry. The information and construction industries also had low draws. There was a pocket in southwest Detroit though where there was about 15 Census tracts in 2011 with 15 percent or more of the population employed in construction.

Jobs in healthcare on the rise

A look at the information presented below shows the numbers of healthcare related jobs becoming available are on the rise. As this industry is expected to grow in the Detroit area (Lapeer, Monroe, Macomb, Oakland, St. Clair and Wayne counties) job loss in the manufacturing industry is expected to continue through 2018. Overall in the area there is expected to be about 112,000 more jobs added to the Detroit area labor market through 2018; this is a 5.5 percent growth.

All of the information presented on job growth and decline spans over 10 years, from 2008 to 2018.

Of the industry and occupation forecasts examined in this post, the industry forecasts are produced by the Michigan Department of Management, Technology and Budget.  The industry forecasts are based on historical job trends in the specific industry and the expected short-term, or long-term demand, in those sectors. These demands are determined by industry experts and the Michigan Department of Management, Technology and Budget. Once the industry projections are produced, information on occupational staffing patterns and the shifting trends in such occupational patterns are examined. The examination of these patterns is then used to generate the occupational forecasts.

According to the Michigan Department of Management, Technology and Budget, since a specific occupation is often found in many industries, the relative concentration of an occupation in high demand or low demand industries impacts the overall expected growth rate.  Technology factors are also used because the impact of technological change can decrease or increase future jobs in specific occupations.

growth1

growth2

The above charts show the top 10 jobs the Michigan Department of Technology, Management and Budget predicts will experience the highest percent of growth from 2008-2018 in the Detroit area. While the percentage of growth for the above occupations range from 48 to 26 percent, the raw numbers show the growth will not be that significant. For example, there is a projected 36.3 percent growth in the financial examiner occupation in the Detroit area through 2018. However, when looking at the raw numbers it shows that 36 percent growth is equivalent to 65 jobs over a 10 year span.

Occupations are defined as a set of activities or tasks that persons are paid to perform. Someone can have the same occupation as another person and not be employed in the same industry.

growth3

The above chart shows the expected top 10 growing occupations in the Detroit area through 2018, based on raw or absolute numbers. While three health related occupations are on the top 10 list based on percent of growth, they did not make this top 10 list on raw numbers. According to the Michigan Department of Technology, Management and Budget, healthcare practitioners and technical related occupations will experience the most growth with an expected 18,911 increase in jobs through 2018. There are four healthcare related occupations that are expected to add about 92,000 jobs in the Detroit area in the coming years. The two computer and technology occupations on the list are expected to add about 19,000 jobs.

growth4

growth5

While health and computer related fields are among the occupations suggested to experience growth through 2018, it is the manual labor based jobs that are suggested to decline, according to the Michigan Department of Technology, Management and Budget. The above two charts show the top 10 declining occupations in the Detroit area based on percent of decline. Drilling and boring occupations are expected to decline the most by percent through 2018. However, when looking at the raw numbers of the 10 occupations shown above, postal service sorters and processors are expected lose the most number of jobs.

growth6

When examining the top 10 occupations expected to experience the most job loss through 2018 based on raw numbers, most are related to manufacturing processes.  There is only one listed in the top 10 declining occupations based on percent decline. This occupation is the postal service sorters and processors. The Michigan Department of Technology, Management and Budget expects there to be a loss of 1,006 positions in this occupation through 2018. The production occupation is expected to experience the largest decline in jobs, based on raw numbers from 2008 to 2018. There is an estimated loss of 16,818 jobs.

growth8

growth9

Of the top 10 growing industries in the Detroit area, based on percent growth, three are healthcare related and one is technology related. When examining the raw numbers of the top 10 growing industries based on percent growth the healthcare and social assistance industry is expected to grow the most, by 47,421 jobs in the 10 year period.

An industry is a group of establishments that produces similar goods and services.

growth10

When just examining the raw numbers of expected job increases of the top growing industries in the Detroit area, the healthcare and social assistance industry is expected to experience the most amount of growth. This industry is expected to produce an additional 47,421 jobs through 2018.

Slide18

Slide19

When looking at the raw numbers of the industries presented in the above two charts, fabricated metal product manufacturing is expected to experience the largest decline with a loss of 4,144 jobs. Machine manufacturing came in closely behind with an expected loss of 3,836 jobs.

Slide21

When examining declining industries in the Detroit area, six of the top 10 declining industries, based on percent of decline, match those on the top 10 declining list based on just the raw numbers.  Of those six that match both lists, four industries are manufacturing based. Overall, the Michigan Department of Technology, Management and Budget is expecting a loss of 40,332 manufacturing related industry jobs in the Detroit area through 2018.

For further information on Michigan’s “Hot 50” jobs visit here.