Eastpointe: Property Taxes Decrease, Number of Special Assessments Increase

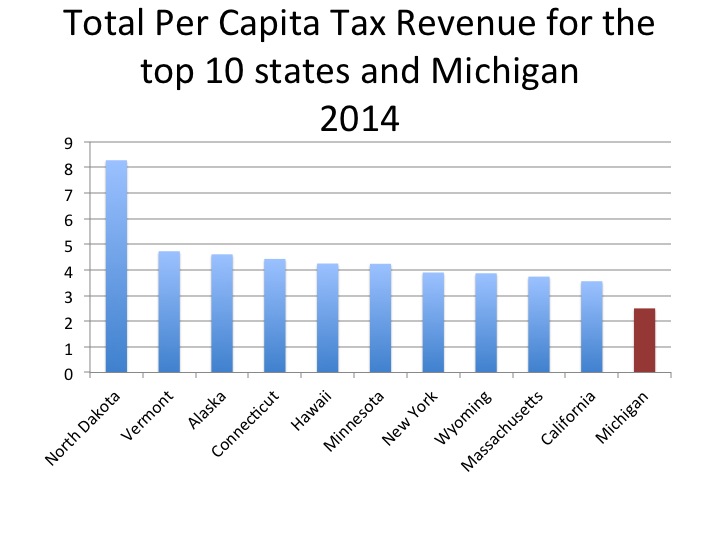
For our cities to function effectively, taxes must be levied to support services vital to their survival. Here we examine the same hypothetical Eastpointe property discussed last week to portray what additional taxes—beyond general school, city and county operating millages—are levied to provide services to this city’s residents.

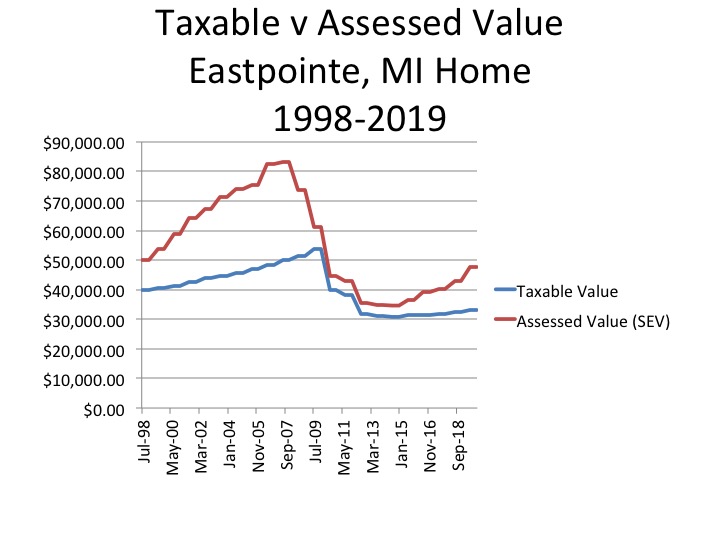
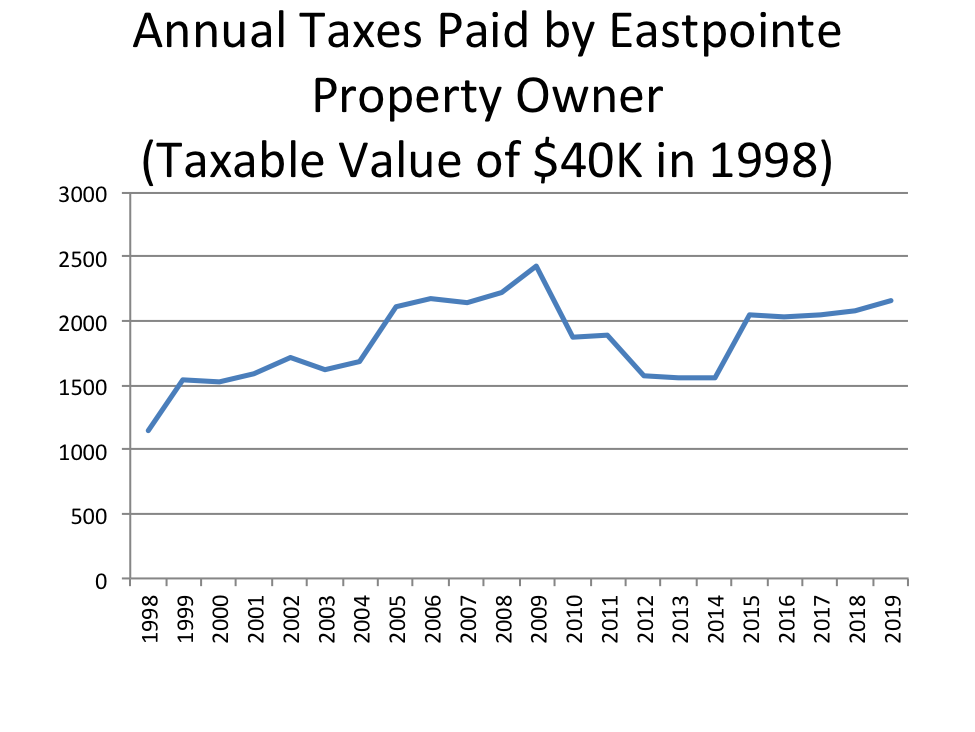
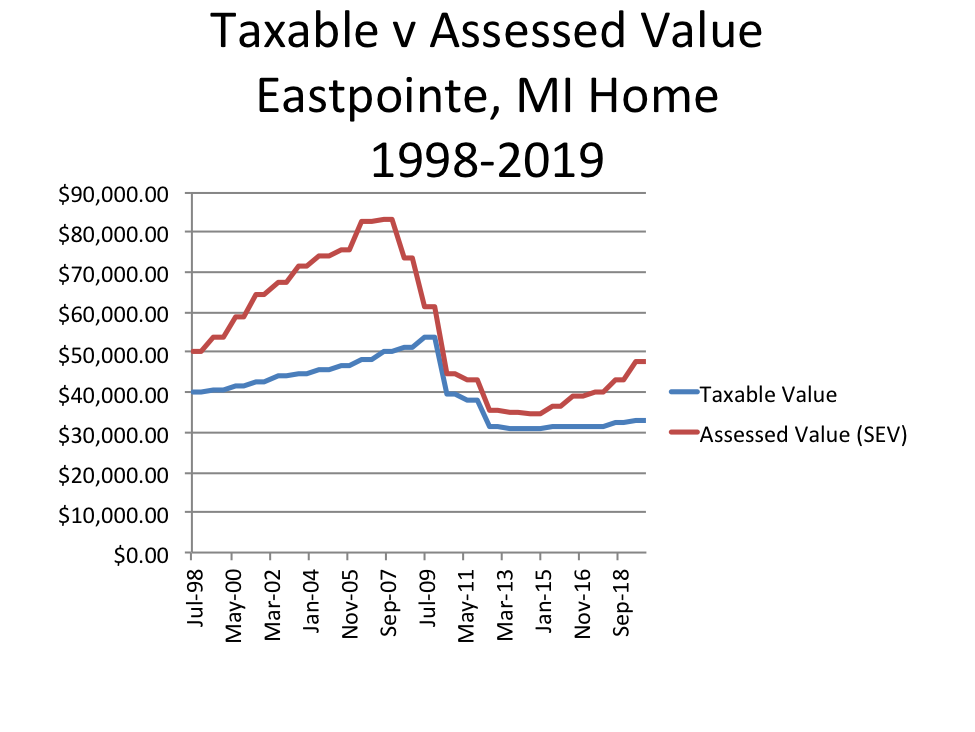
The first chart below shows that from 1998 to 2009, the total dollar amount this hypothetical property owner was paying in taxes gradually increased. This can be attributed to two factors. First, both the assessed and taxable value of the property (shown in Chart 3) gradually increased during that time, meaning more property tax revenue for local governments. Second, voters approved at least one new major tax levy during that time. This major tax was approved in 2005 and allowed the city to collect a special levy of up to 7 mills for public safety. For this hypothetical household, that levy equaled $327.94 in 2005. In contrast, a decade later, that same special levy brought in $219.08. The decline was due to the fact that the taxable value of the property plummeted, along with the assessed value, in the wake of the Great Recession.

As shown in Chart 1, the amount of taxes this hypothetical property owner paid peaked in 2009 ($2,432.30), which corresponded with the peak taxable value of this home ($53,599). The subsequent decline in tax bills occurred despite new service assessments approved by Macomb County voters. For example, it was in December of 2008 when the regional millage for the Detroit Zoo began to appear on the tax bills for this property, which by then had a taxable value of $51,340.41, costing the homeowner $5.13. Tax data from the City of Eastpointe also shows that this new assessment was much lower than existing county assessments such as the Huron-Clinton Metroparks millage, costing this hypothetical property owner $11.01 in 2009,and the Suburban Mobility Authority for Regional Transit (SMART) millage, which cost the homeowner $30.29 that year. Chart 2 below presents a timeline of the changes in county-wide and city millages that affected Eastpointe taxpayers.

Chart 1

**(Note-all taxes on the Eastpointe tax bill are included in the graph above)

Chart 2: Timeline of Eastpointe, Macomb County Millages and Increased Millage Renewals

1995

  • Suburban Mobility Area Transit Authority (SMART): 1 mill (quadrennial countywide renewals approved at varying rates; the most recent was narrowly approved in 2018)

2005

  • Eastpointe Public Safety: 7 mills (part of general city operating millage starting in 2016)

2008

  • Detroit Zoo: 0.1 mill (2008-present; renewal approved in 2016)
  • Macomb County Veteran Millage: 0.4 mills (2008-present; increase approved in 2016)

2011

  • Recreation Authority of Roseville and Eastpointe: 1 millage  (2011-Present)

2012

  • Detroit Institute of Arts: 0.2 mills (2012-2022; renewal question on March 2020 ballot)

2015

  • South Macomb Oakland Regional Services Authority (SMORSA): 14 mills (2015-present)

**The Huron Clinton Metropark Authority millage has been levied since the 1940s***

Chart 3

The trend of decreased property values and the addition of special assessments to tax bills continued in the wake of the Great Recession. In 2011, residents in Eastpointe and Roseville approved a 1-mill levy to fund the newly created Recreational Authority of Roseville and Eastpointe (RARE). Later, voters in Macomb, Oakland and Wayne counties approved a 10-year, 1 mill tax for the Detroit Institute of Arts (DIA), which appeared on tax bills in December of 2012. The largest increase came in 2015, when Eastpointe and Hazel Park voters approved the creation of the South Macomb Oakland Regional Services Authority (SMORSA), to provide a new revenue source for public safety services in both cities; this regional authority levies 14 mills annually. Macomb County voters also approved a 0.069 mill veterans millage in 2016, a slight increase from an earlier 0.04 millage rate.  In addition, residents of Eastpointe have regularly renewed a millage to support their local library.

Between 1998 and 2019, the timeline for the data in this post, the amount in taxes paid reached a high in 2009 at $2,432.30 (when the taxable value of the property was at its highest) and a low in 2014 at $1,563.50 (when the taxable value was at its lowest). Due to the limitations of Michigan’s Proposal A, which only allows annual taxable value increases of 5 percent or the rate of inflation (unless the property is sold), the taxable value of this hypothetical property rose only about 7.4 percent over the next five years (2015-19). However, due to these new assessments, the hypothetical property owner paid about 38 percent more in total property tax during that timeframe—roughly equal to the rate of the home’s assessed value increase.

Eastpointe’s case reveals that local governments have had some success in combating the fiscal consequences of the decline of general operating tax revenue with voter-approved special assessments for the county-level service authorities, and especially with SMORSA. Voter support for these services has been there in recent years, but it remains to be seen whether it will persist in the coming years.

This year, property owners across Macomb County may see some additional changes to their tax bills. In March, the DIA will ask voters to renew a 10 year, 1 mill tax renewal; if voted down in any particular county, the DIA assessment in that county will fall off the tax rolls in 2022. Voters will also be asked to approve a 1.9, 10-year millage on the March ballot to support classroom operations through the Macomb Intermediate School District (MISD); this proposed millage is different from the general operating millages currently levied by the MISD and local school districts.  Later, in August, Macomb County voters will also be asked to approve a millage for a yet to be determined amount and length to support either building a new county jail or renovating the current one. The Regional Transit Authority (RTA) may also be considering a millage proposal in 2020; although at this time it appears Macomb County voters will not be asked to support the proposal to support this.

Eastpointe: Property Values Rise as Taxable Values Inch Up

This post is the first of many that will demonstrate the difference between the taxable and assessed values in communities throughout Southeastern Michigan and explain the various taxes levied in these communities and their use. We will highlight at least one community in each county in the region and this post discusses Eastpointe in Macomb County. Eastpointe, formerly known as East Detroit, has a population of about 32,000, a median income of about $46,000 and a median home value of $64,700, according to the U.S. Census Bureau.

The chart below shows the taxable value and assessed value of a hypothetical Eastpointe home, beginning in July of 1998 through December of 2019. The taxable value is the value used to calculate a property’s taxes, and each year it can only increase by 5 percent or the rate of inflation, whichever is less. This number may be equal to the property’s state equalized, or assessed value, but not more than those values. Such limits on tax growth, or lack thereof, is a result of Proposal A, a state constitutional amendment approved by voter referendum in 1994. The assessed value of a property, or the state equalized valued (SEV), is usually about half of a property’s true cash value, and the true cash value is the fair market value of the property.

In 1998 the taxable value of the Eastpointe property examined was $40,000 and the assessed value was $50,000. In July of 2007 the assessed value of the property peaked at $83,252 but the taxable value was only at $50,186. By 2008 the Great Recession hit Southeastern Michigan and both the assessed values and taxable values of properties began to decline. Between July of 2007 and July of 2010 the assessed value decreased from $83,252 to $40,700, or more than 50 percent ($40,000). The annual declines continued after the recession, and the assessed value of the property reached its lowest point in July of 2014 at $34,641, a nearly 60% decline from its peak. Since July of 2014 the assessed value of the property has increased to $47,840.

As noted, the taxable value of the property was $40,000 in July of 1998, but it did not increase nearly as much as the assessed value did, because it cannot rise more than the rate of inflation or 5 percent from year-to-year. As a result, the taxable value of the property did not peak until July of 2009 ($53,599). A year later though, in July of 2010, the taxable value plummeted to $39,749. A property’s taxable value can decrease in such a way if there is a physical loss to the property and/or if the property is sold in the previous tax year. The Great Recession began in 2008 and by 2010 the taxable value of properties were on the decline, ultimately affecting governmental budgets, and services. In July of 2013 the taxable value of this Eastpointe property reached its low point at $30,804. Since then the taxable value of the property has only increased to $33,095.

Due to economic trends and the way taxable values and assessed values are calculated under Proposal A of, the assessed value of a property is nearly always higher than the taxable value. For this specific property, the only time the taxable value and assessed value were nearly the same was in July of 2009, when the taxable value was $39,749 and the assessed value was $40,700. In addition, while the gap between the two values has not been nearly as large as it was prior to the recession, since 2016 that gap has been widening.

As noted earlier, our various forms of government rely on property taxes to function, primarily our local governments (municipalities and school districts). The chart above shows that just because the local economy is recovering since the Great Recession, the budgets of local governments are not necessarily reaping the benefits. According to a recent report by the Michigan Municipal League, 173 cities in Michigan have experienced a 2 percent or less revenue growth in the last 15 years and an additional 52 have experienced a budget growth of 3 percent or more. For Eastpointe, according to the a recent report released by the Michigan Municipal League, the total revenue for the city in 2002 was $22.3 million, and in 2017 it was $25.8 million. While the total revenue for Eastpointe has increased by 16 percent the revenue generated by property and income taxes declined by 23 percent. However, while the effects of limited property tax have negatively affected municipalities across the state, the slow growth of such taxes has benefitted for the property owners. According to a September 2018 Detroit Free Press article while income growth in the state has increased since the last recession, household incomes prior to the recession have not yet been recouped. Since incomes are also recovering at a slower rate, it can be viewed that the slow growth rate of property tax revenue is allowing property owners to better stay afloat economically.

It should be noted though that a, at least in Southeastern Michigan, local tax bills have become gradually more complicated as voters approve additional tax levies, to help make up for the loss in revenue as a result of the recession, and the loss in revenue due to the limited growth of taxable values. Next week we will examine the various taxes levied for this hypothetical Eastpointe property, including what they are for, what additional ones have been added over time and how the overall tax amount for the property has either increased, or decreased, over time.

DIA Seeks Millage Renewal

Throughout the Metro-Detroit region there are multiple millages being levied to support regional entities, most of which were born out of Detroit’s bankruptcy and the economic downturn. When some of these millages were originally levied, the initial intentions expressed to the public were that they were for only a specific amount of time, such as with the Detroit Institute of Authority (DIA). However, the Detroit Zoo for example passed a 0.1 millage in 2008, and then came back to voters in 2016, two years before the 10 year millage was set to expire, and asked for a renewal. The 0.1 millage renewal passed, and this public support for the Detroit Zoo continues to be levied; the cost of the Zoo millage for a home valued at $100,000 ($50,000 taxable value), is $5. We have also seen the Suburban Mobility Authority for Regional Transportation (SMART) continuously seek millage renewals and increases, the most recent being a 1 mill renewal for four years that was approved by voters in 2018.

Now, as the end of 2019 nears, the Detroit Institute of Arts (DIA) recently announced it is up against the clock to put millage renewal language on the March 2020 ballot. The 10-year millage was originally approved by voters in Macomb, Oakland and Wayne counties in 2012, and it was stated at that time that it was a one time request, allowing the museum time to build up its endowment for long-term financial support of operations, according to news articles of 2012 and present. Now seven years into the one-time millage, DIA officials have announced a 10-year renewal is necessary to continue offering the services the public has come to expect. In order to do this the three Art Authorities in Macomb, Oakland and Wayne counties (which were born out of articles of incorporation crafted and approved by the corresponding Board of Commissioners) must approve the ballot language. Just last week the Wayne County Art Authority approved putting the 0.2 mill renewal on the ballot, Oakland County is expected to debate the potential millage renewal later this month and the Macomb Art Authority will do so on Dec. 3.

As discussions again begin to ramp up over whether another regional millage renewal is necessary, it is important to consider what benefits the current tax dollars levied for the DIA may have created the region. In addition to free general admission for Macomb, Oakland and Wayne residents additional benefits can be covered under three main areas: investment in schools (free field trips with bussing, teacher professional development, and curriculum development), investment in the senior population (free group visits for older adults on Thursdays with free transportation and special programs), and investment in community partnerships (Inside/Out program, partnerships with area non-profits).

The first chart below shows the amount of money invested into the schools in the region by county and by year. In total, between 2013 and 2018 392,231 students in the tri-county region have had access to the school programs now offered by the DIA, with that investment totaling about $4.3 million. Of the three counties the most amount of money has been invested into the Wayne County schools, with that total being about $2.2 million. Wayne County has the highest population of the three counties.  It should also be noted though that investment into these various programs in the counties requires participation from the residents.

When looking at the amount invested in the senior programs since 2013 that total is about $1.7 million with the total number of seniors being reached by these special programs being 32,422. The largest investment with the senior programs since the millage has been in Oakland County with a total of  $725,362 being invested into the senior population.

Finally, the area where the most investment has been made is in the community partnerships area. Between 2013 and 2018 about $5.3 million was invested. The largest investment was in Oakland County at about $2 million. In Wayne County $1.9 million was invested, and in Macomb County about $1.3 million was invested.

It appears a new trend is emerging where millages will be needed to support regional entities and interests (the Zoo, the DIA, transit) along with day-to-day services in some cities and counties. For example, in Detroit there are currently discussions about a March ballot proposal to levy additional funds to move blight removal in the city along at a much faster pace. In Macomb County residents will asked to decide if they want to pay additional taxes in order to build a new jail. So it may be even more important for taxpayers to understand what additional taxes are appearing on their tax bill and what their priorities are. In the coming weeks we will look at the additional taxes residents pay in certain communities throughout the region to shed further light on what tax bills are now looking like.

Michigan ranked 31 nationwide for amount of taxes per capita

The chart above compares the taxes per capita in Michigan, which is $2.50, to the 10 states with the highest taxes per capita. Michigan ranked 31 out of 50 and North Dakota came in at number 1 with its taxes per capita at $8.28.

Other states in the Great Lakes region with higher taxes per capita than Michigan were: Minnesota ($4.24), New York ($3.90), Illinois ($3.04), Wisconsin ($2.85) and Indiana ($2.55).

Nationwide, New Hampshire had the lowest taxes per capita in 2014 at $1.72.

As seen in the graph below, the State of Michigan’s tax revenues come from four primary categories: Sales and Gross Receipt Taxes, Income Taxes, Property Taxes, and License Taxes. All other taxes, which include death and Gift Taxes, Documentary and Stock Transfer Taxes, and Severance Taxes, fall into the “Other” category. This category accounted for only 1 percent of the state’s tax revenue in 2014 while sales and gross receipt taxes accounted for 50 percent, or about $12 billion, of the state’s tax revenue.

The information for this post was taken from the 2014 Annual Survey of State Government Tax Collections.

As noted, half of Michigan’s tax revenue generated in 2014 was from sales and gross receipt taxes, a category that is made up of more than just general sales and gross receipt taxes. General sales and gross receipt taxes accounted for 68 percent of the overall sales and gross receipts of $12 billion brought in 2014 while about 8 percent of those monies were earned through the motor fuel tax.

Michigan also relies on income tax monies to fund state operations; 35 percent of Michigan’s tax revenue generated in 2014 (about $8.7 billion) came from income taxes. Of that, 89 percent came from personal income taxes and the remainder was generated from corporation net income taxes.

Overall, according to the National Conference of State Legislatures, states earn about a third of their tax base through income taxes. Though this varies substantially as discussed below.

The majority of Oregon’s tax base (74%) was earned through its income tax in 2014, while Michigan only derived 35 percent of its tax base from income tax. Oregon’s income tax is divided into four brackets depending on a person/family’s earning. In addition, Oregonians are able to subtract what they pay in federal taxes from their state taxable income results, according to an article from The Oregonian.

Michigan has a flat income tax. In Michigan the income tax rate is 4.25 percent, however Republicans in the State Legislature have been working to reduce it to 3.9 percent, according to the Michigan League for Public Policy (MLPP). Such action, according to the MLPP, would reduce revenue flow to areas such as education and infrastructure. Michigan also has an Earned Income Tax Credit that allows lower income workers to retain more of their income. The State Legislature intends to eliminate this credit and instead push those funds into Michigan’s roads.

In addition to the Earned Income Tax Credit that exists in Michigan, and 23 other states (including Oregon), there is also a federal one, according to the National Center for Children in Poverty.

The importance of income taxes has grown since reliance on property tax values has declined in recent years, according to the National Conference of State Legislatures.

With Michigan’s sales and gross receipt taxes making up 50 percent of the state’s tax generated revenue in 2014, it ranked 19th for percent of sales tax making up a state’s tax base. Texas ranked first with 83 percent of its tax base being made up of sales taxes. Texas is one of the 17 states in the U.S. that does not levy property taxes at the state level, though it does have property taxes at the municipal and county level. Other states that do not levy property taxes (at the state level) and are among the 10 states with the highest percentage of revenue derived from sales taxes include: Florida (2), South Dakota (3), Tennessee (6) and Hawaii (7). Indiana was the only Midwestern state of the 10 states with the largest portion of their tax base being made up of sales taxes. In 2014, 62 percent of Indiana’s tax revenue was earned through sales taxes.

Out of the 33 states in the U.S. that levy property taxes, Michigan ranked seventh for the percent of tax revenues derived from property taxes. In total, about 8 percent of the state of Michigan’s tax revenues, or $1.8 billion, came from property taxes. Vermont ranked at the top, with 33 percent of its state tax revenues comprised of property taxes.