DIA Seeks Millage Renewal

Throughout the Metro-Detroit region there are multiple millages being levied to support regional entities, most of which were born out of Detroit’s bankruptcy and the economic downturn. When some of these millages were originally levied, the initial intentions expressed to the public were that they were for only a specific amount of time, such as with the Detroit Institute of Authority (DIA). However, the Detroit Zoo for example passed a 0.1 millage in 2008, and then came back to voters in 2016, two years before the 10 year millage was set to expire, and asked for a renewal. The 0.1 millage renewal passed, and this public support for the Detroit Zoo continues to be levied; the cost of the Zoo millage for a home valued at $100,000 ($50,000 taxable value), is $5. We have also seen the Suburban Mobility Authority for Regional Transportation (SMART) continuously seek millage renewals and increases, the most recent being a 1 mill renewal for four years that was approved by voters in 2018.

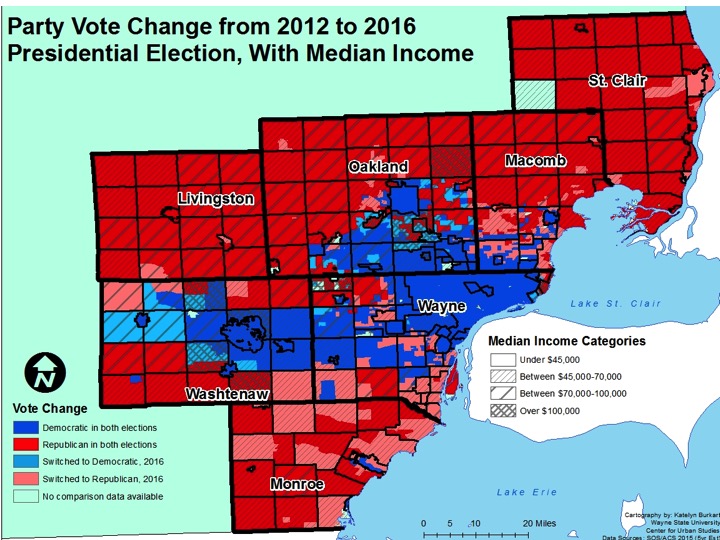
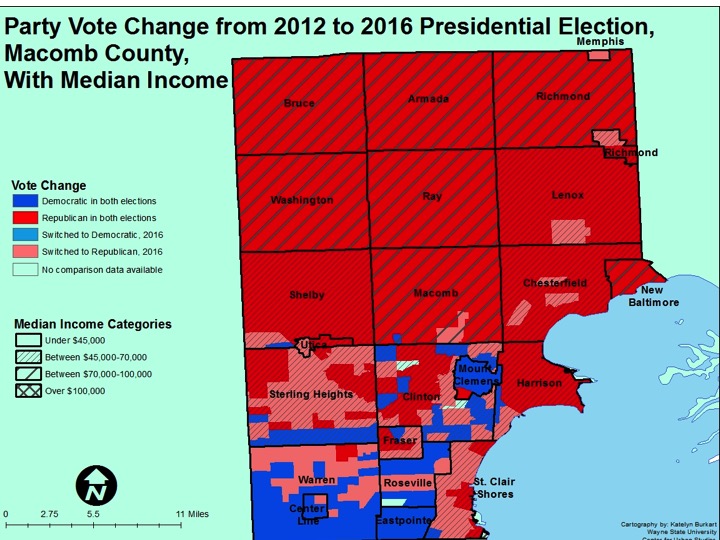
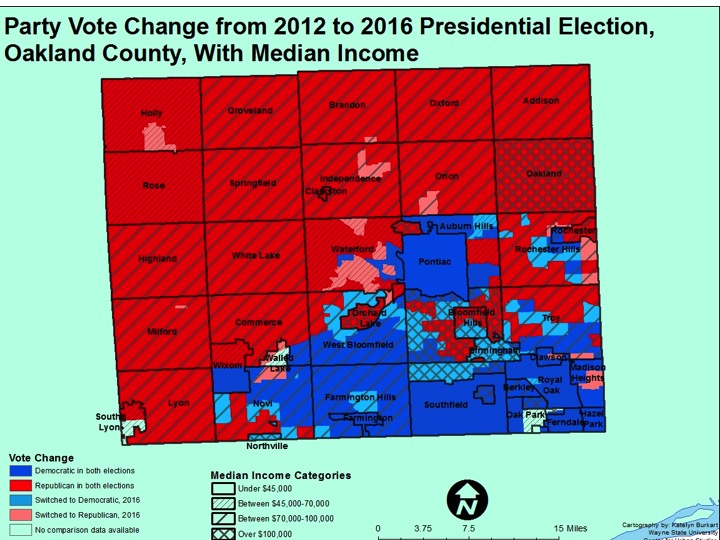
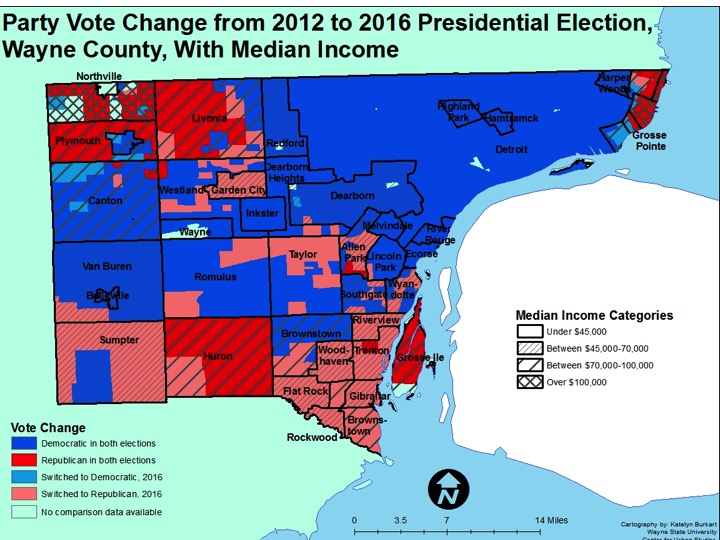
Now, as the end of 2019 nears, the Detroit Institute of Arts (DIA) recently announced it is up against the clock to put millage renewal language on the March 2020 ballot. The 10-year millage was originally approved by voters in Macomb, Oakland and Wayne counties in 2012, and it was stated at that time that it was a one time request, allowing the museum time to build up its endowment for long-term financial support of operations, according to news articles of 2012 and present. Now seven years into the one-time millage, DIA officials have announced a 10-year renewal is necessary to continue offering the services the public has come to expect. In order to do this the three Art Authorities in Macomb, Oakland and Wayne counties (which were born out of articles of incorporation crafted and approved by the corresponding Board of Commissioners) must approve the ballot language. Just last week the Wayne County Art Authority approved putting the 0.2 mill renewal on the ballot, Oakland County is expected to debate the potential millage renewal later this month and the Macomb Art Authority will do so on Dec. 3.

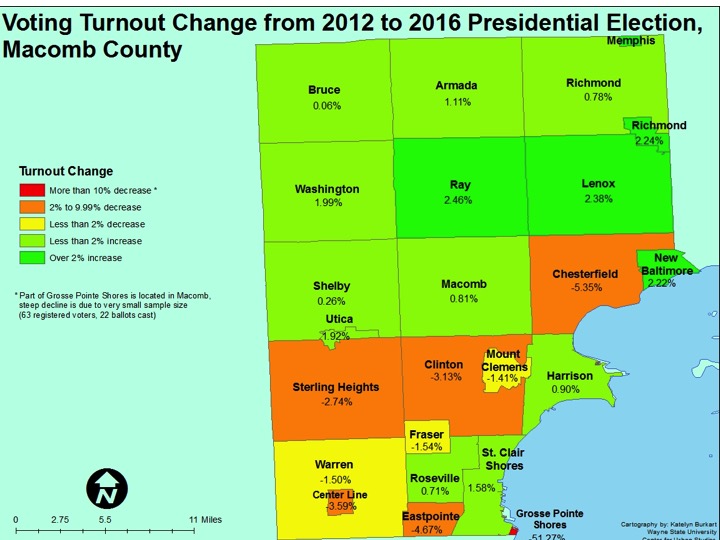
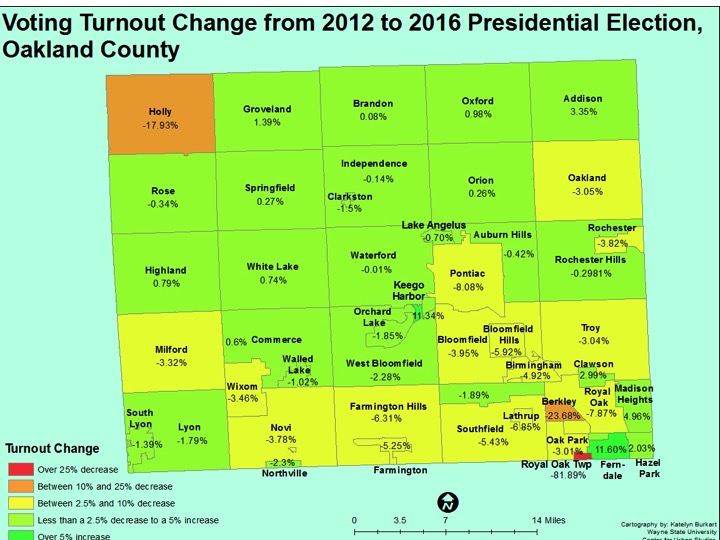
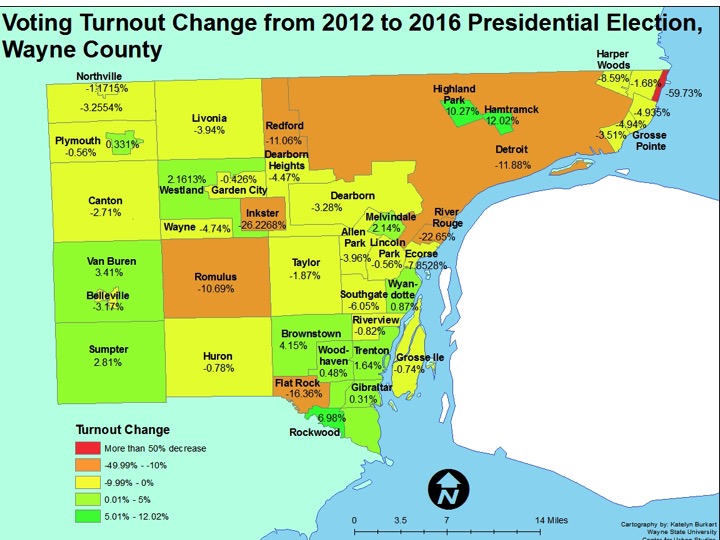
As discussions again begin to ramp up over whether another regional millage renewal is necessary, it is important to consider what benefits the current tax dollars levied for the DIA may have created the region. In addition to free general admission for Macomb, Oakland and Wayne residents additional benefits can be covered under three main areas: investment in schools (free field trips with bussing, teacher professional development, and curriculum development), investment in the senior population (free group visits for older adults on Thursdays with free transportation and special programs), and investment in community partnerships (Inside/Out program, partnerships with area non-profits).

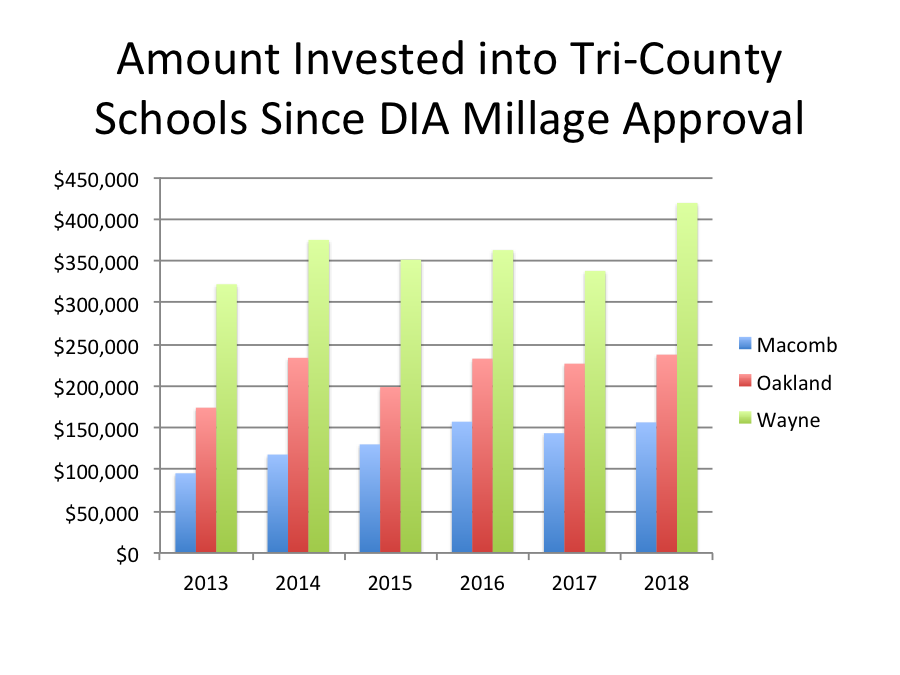
The first chart below shows the amount of money invested into the schools in the region by county and by year. In total, between 2013 and 2018 392,231 students in the tri-county region have had access to the school programs now offered by the DIA, with that investment totaling about $4.3 million. Of the three counties the most amount of money has been invested into the Wayne County schools, with that total being about $2.2 million. Wayne County has the highest population of the three counties.  It should also be noted though that investment into these various programs in the counties requires participation from the residents.

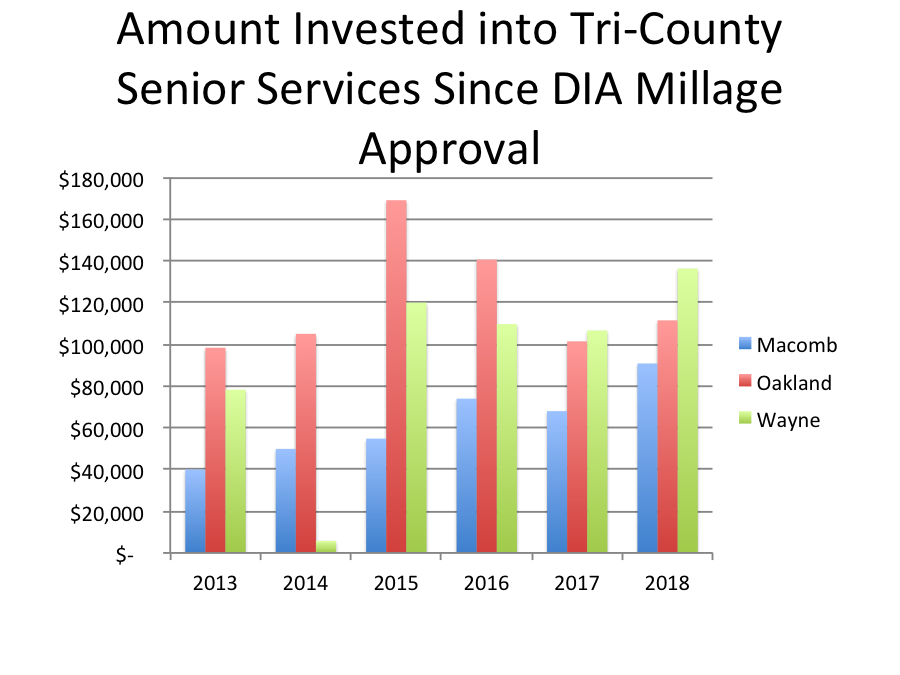
When looking at the amount invested in the senior programs since 2013 that total is about $1.7 million with the total number of seniors being reached by these special programs being 32,422. The largest investment with the senior programs since the millage has been in Oakland County with a total of  $725,362 being invested into the senior population.

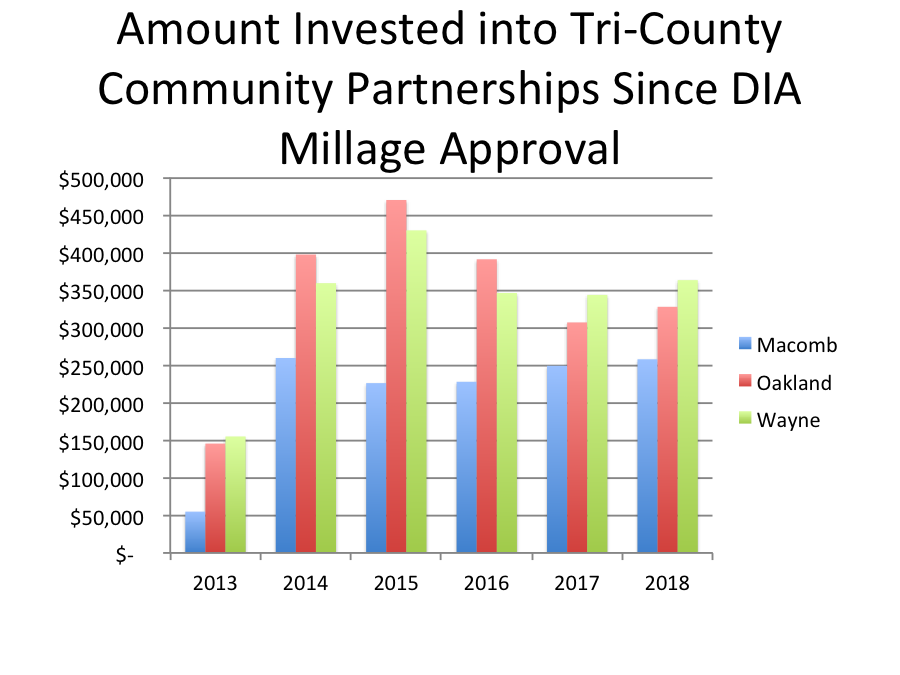
Finally, the area where the most investment has been made is in the community partnerships area. Between 2013 and 2018 about $5.3 million was invested. The largest investment was in Oakland County at about $2 million. In Wayne County $1.9 million was invested, and in Macomb County about $1.3 million was invested.

It appears a new trend is emerging where millages will be needed to support regional entities and interests (the Zoo, the DIA, transit) along with day-to-day services in some cities and counties. For example, in Detroit there are currently discussions about a March ballot proposal to levy additional funds to move blight removal in the city along at a much faster pace. In Macomb County residents will asked to decide if they want to pay additional taxes in order to build a new jail. So it may be even more important for taxpayers to understand what additional taxes are appearing on their tax bill and what their priorities are. In the coming weeks we will look at the additional taxes residents pay in certain communities throughout the region to shed further light on what tax bills are now looking like.

Communities Continue to Opt Out of Michigan Recreational Marijuana

In November of 2018 the State of Michigan legalized recreational marijuana. And, while recreational marijuana facilities have not made their way into any municipality yet (the state has until November 2019 to work out logistics to allow such facilities to operate), several municipalities have already opted out of allowing them. Under the Michigan Regulation and Taxation of Marihuana Act, every municipality is considered to be “in,” or to allow medical marijuana facilities, unless the elected body of a municipality votes to opt out through an ordinance or resolution (an ordinance is preferred for legal matters). According to the Michigan Department of Legal and Regulatory Affairs, 48 municipalities in Southeastern Michigan have opted out, with the city of Monroe being the first in the state. Even though almost 50 municipalities in Southeastern Michigan, more than 60 in the state of Michigan, have opted out of allowing recreational marijuana, the ordinances that allowed them to opt out can be changed, allowing them to opt back in. As the map below shows, the highest concentration of opt out communities in Southeastern Michigan is in northern Macomb and St. Clair counties. In that area alone there are 12 communities that have already opted out of allowing recreational marijuana facilities. Wayne County has the highest total number of opt out communities at the county level at 13; Macomb County has the second highest number at 10.

Reasons why municipalities have opted out include wanting to wait to see how the state will regulate recreational marijuana facilities, wanting to further amend their own zoning regulations for such facilities and not wanting such facilities within the boundaries of their municipality at all.


Turkeys, Chickens and Ducks

As Thanksgiving approaches it is worth noting that our state has had a great success in expanding wild turkey populations across the state from near extinction in 1900 to over 200,000 birds across the state nowadays. All but the most densely populated areas of Southeastern Michigan have wild turkeys. And now they will find many cities are allowing their domesticated cousins—chickens. And at least one has added ducks.

Across Southeastern Michigan there are 30 communities that allow for residents to house chickens on their property, according to recent research conducted by the Detroit Free Press. These communities have various ways of allowing residents to have the chickens on their property. For example, in the City of Warren residents are allowed to have three hens and pay a $10 registration fee to have the chickens. In the City of Berkley though restrictions are bit tighter, with only five permits available for residents to have backyard chickens.

It is within the purview of each community as to whether or not they want to allow backyard chickens and to what extent they will be allowed. This local control comes from a rule the Michigan Agriculture Commission adopted in 2014 that essentially states not everyone can claim rights under the Right to Farm Act. The rule is intended to protect the overall goal of the Right to Farm Act, which is to protect industrial sized farmers in rural communities. The local control aspect of backyard livestock and poultry allows more suburban and urban communities to decide what is best for their community and residents. As noted above some communities only allow a certain number of permits to be distributed, while others require a fee to be paid, and only a certain number of hens to be owned by an individual. While there are 30 communities in Southeastern Michigan that allow residents to own chickens, there are 21 that have banned them. Ann Arbor recently added ducks to the list of animals backyard farmers can cultivate.

Reasons individuals want to house chickens in their backyard typically links back to wanting the chicken’s eggs. Hens can lay up to five eggs per week. Reasons communities cite for wanting to ban them include the allegation that the chickens, and their feed, may attract rats and that the hens themselves may be a noise nuisance.

Southeastern Michigan Communities Working to Fund Pension Systems

In 2017 the Protecting Local Government Retirement and Benefits Act was passed, with the goal of identifying the systems that are underfunded. According to the State of Michigan, a retirement fund is underfunded if less than 60 percent of the fund is funded, and there is an annual required contribution that is over 10 percent of governmental fund revenues. While 60 percent is the current threshold, there are discussions that eventually that number will continue to increase to 100 percent to more accurately reflect the funded status of a retirement plan. There are also thresholds that determine if a local government entity has an underfunded retiree health care system, an issue we will explore next week.

Currently, in the State of Michigan local government entities are facing, in total, over $18 billion in unfunded liabilities for retirement and retiree healthcare funds, according to the Reason Foundation. This foundation worked with the State of Michigan to develop the Protecting Local Government Retirement and Benefits Act and the reporting system that goes along with it.

The maps below provide details on what local government retirement plans are preliminary funded or underfunded in Southeastern Michigan, as determined by the Michigan Department of Treasury through implementation of the Protecting Local Government Retirement and Benefits Act. These are deemed preliminary due to the fact the new oversight body for determining funded, unfunded and waiver status must still review information submitted. Note, information is not displayed for all local government units in the region because not all units had provided their funding as of June 9, 2018. Additionally, some local government units beyond cities and townships are included in the data provided by the State, such as public safety retirement funds.

Of the 183 local government entities (this includes multiple funds for one municipality) that submitted their retirement funding information to the State for the Southeastern Michigan region, 37 of them were reported as having an underfunded status, or less than 60 percent of the retirement fund being funded. Of those that were reported as being underfunded, the majority of them had 45 percent or more the entity’s retirement system funded. However, there were five entities with 25 percent or less of the retirement system funded. These entities were:

  • Capac (St. Clair County): 24.2%
  • Highland Park General Employee fund: 2%
  • Highland Park Public Safety Fund: 3.7%
  • Highland Park Police and Fire Fund: 6.8%
  • Taylor City Housing Commission Authority: 0%

It should be noted that while the City of Taylor’s Housing Commission Authority retirement fund is underfunded, the City of Taylor’s general employee and police and fire retirement funds met State guidelines to be determined funded.

As part of the newly adopted State legislation related to retirement and retiree health care plans a Municipal Stability Board was created to review the corrective plans that underfunded entities must create and submit to the State. This board is housed under the Michigan Department of Treasury is made up of three individuals appointed by the governor. Corrective plans must be developed and submitted within 180 days of the State determining an entity’s retirement system is underfunded.


On the opposite side of the spectrum, while there were far more local government entities that were determined have funded retirement systems, than not, there were several that were more than 100 percent funded. The entities with the highest percentage of funding for their retirement funds were:

  • City of Ferndale (General Employees): 253%
  • City of Dearborn (Chapter 24): 239%
  • City of Pontiac (General Employees); 176%
  • City of Ypsilanti (General Employees) 126%
  • City of Grosse Pointe: 119%
  • City of Troy: 117%
  • Lima Township: 112%
  • City of Grosse Pointe Farms: 111%
  • City of Gibraltar (General Employees): 106%
  • City of Dearborn (General Employees): 104.3%
  • City of Mt. Clemens: 103%
  • Oakland County: 103%
  • City of Gibraltar (Public Safety): 102%
  • Groveland Township: 101%

Funding of retirement plans is vital for all local government entities as underfunded plans can lead to long-term financial troubles for a government entity, not excluding bankruptcy. Additionally, underfunded plans can also affect recruitment and retention of employees.

Majority of Medical Marijuana Shops Close Throughout Detroit

More than 200 medical marijuana caregiver centers have closed throughout the State of Michigan in the last several weeks, the majority of those being located in Detroit. According to data provided by the City of Detroit, as of March 23, 194 medical marijuana caregiver centers have closed in the City in 2018. Of these, 159 of medical marijuana caregiver centers closed between March 15 and March 29; these centers closed following cease and desist letters sent by the Michigan Department of Licensing and Regulatory Affairs (LARA) due to the fact they didn’t apply for licensing through the state. Centers had been allowed to stay open through an emergency rule that was issued in December stating, if the business had approval from the municipality it was located in and applied for the required LARA license. According to multiple media sources, the letters sent by LARA to the 200 plus medical marijuana caregiver centers stated if the centers did not close they would be at risk of not being able to obtain future licensing and/or face consequences from law enforcement.

Currently in Detroit there is a moratorium on new medical marijuana caregiver facilities opening; it went into affect on Feb. 13 and will last for at least six months. Despite the moratorium and closings there are still medical marijuana caregiver centers in Detroit. The first map below shows where all the medical marijuana caregiver centers in Detroit (368) are or were located, including those that have been closed in 2018, and those that are still operating and/or seeking licensing (57 still operating and/or seeking approval and 98 simply seeking approval). While the centers are spread out throughout the City, there were certainly areas with higher concentrations of the centers. For example, right along the northern border of Detroit, 8 Mile Road, there were about 55 medical marijuana caregiver centers. Gratiot Avenue is also heavily lined with medical marijuana caregivers. While majority of centers, both open and closed, are located north of Detroit’s downtown, there are a handful in Detroit’s inner core.

The second map shows the 194 medical marijuana centers that have been closed in 2018. As stated, that is 194 out of 368 in the City (the 368 includes those that are operating, those that are seeking approval and those that are closed). The centers that have closed in the City are not concentrated in specific neighborhood.

There are 13 medical caregiver facilities in the City (shown in the map below) that are operating the closest to compliance as possible, within the expectations of local and state laws, because they have received zoning approval from the City of Detroit and have applied for the emergency licensing described above. According to two initiatives passed on Nov. 7, 2017 in Detroit the Zoning Board of Appeals does not have the authority to review dispensary applications and allows these businesses within 500 feet of several organizations, including religious institutions and other dispensaries. The City has since challenged these initiatives, further confusing the legal operation of medical marijuana caregiver facilities in the City, and the zoning regulations related to them.

In addition to Michigan Medical Cannabis Commission medical marijuana caregiver facilities and those that have closed, there are also the ones that are in the approval process and ones that are in the approval process and still operating. The first map below shows that there are 57 medical marijuana caregiver facilities and/or currently operating in the City of Detroit. While the City of Detroit doesn’t detail what “and/or still operating means,” it is likely related to the facilities that applied for emergency licensing to remain open during the time their new licensing through the state was being reviewed. In addition to the 57 facilities that are seeking licensing and/or still operating, there are an additional 98 medical marijuana caregiver facilities (second map below) seeking approval from the City and the State that are not operating.

In traversing through this issue for this post, it is evident there is still plenty of work to be done at the local and state level to eliminate confusion and allow medical marijuana caregiver facilities to operate legitimately. Like Detroit, other local governments are also trying to navigate through state and local regulations. For example, in Ann Arbor new zoning regulations were approved by the City Council in February. Zoning for four dispensaries in Ann Arbor was then approved, while decisions on two others were delayed. Local officials there too are still learning how to adjust.

Number of Robots Increasing, But Not Unemployment Rates

The data we’ve presented on robots in Michigan are clear. Their numbers are increasing. And the interpretation of those numbers by some economists are also clear. A recent Detroit Free Press article, on a Brookings study says that M.I.T and Boston University researchers currently estimate that the addition of one robot per 1,000 workers leads to the unemployment of up to six workers. So, unemployment might be going up as robots increase? But no.

While the number of industrial robots in use has increased throughout the State of Michigan between 2010 and 2015 the unemployment rates for the affected Metropolitan Statistical Area’s (MSA) have not. For example, in the Battle Creek MSA the Brookings Institute Analysis of International Federation of Robotics Data found there were about 17 industrial robots per 1,000 workers in 2015, this equated to a total of about 840 industrial robots in use in the Battle Creek area in 2015. Also, in 2015 the unemployment rate for the Battle Creek MSA was 5.1 and in 2010 the unemployment rate for that area was 11.7. A substantial decrease.

In the Detroit Metropolitan area, the number of industrial robots in use has nearly tripled since from 5,752 in 2010 to 15,115 in 2015. If each robot is worth more than one job as the economist projects, then that would mean a lot of unemployed people. But the unemployment rate fell from 13.9 in 2010 to 5.9 in 2015. According to the Michigan Department of Management, Technology and Budget none of the State’s 14
MSA’s experienced an increase in the unemployment rates between 2010 and 2015. So, more robots, but a decrease in unemployment? Well, maybe, but some might say we’re mixing up a macro trend—the overall
expansion of the economy since the 2008 recession—with a more micro process—the increase in the number of robots, which would not have so large an effect as to decrease overall unemployment. There still might be an effect, but at a lower level. And it might be consistent with recent findings from University of
Michigan economists who are indicating that the expansion has brought back only about 73 percent of the jobs lost in the recession.

Where are the other 27 percent? Robots and offshore, perhaps?


Crimes Rate for Detroit Among Highest in the Region

The Federal Bureau of Investigation recently released data on known criminal offenses for the year 2016. For this post, these criminal offenses have been turned into rates per 100,000 residents to accurately show how reported crimes differ between the some of the most well known cities in each county in Southeastern Michigan.

The cities featured in this post are

  • Ann Arbor: Washtenaw County
  • Detroit: Wayne County
  • Howell: Livingston County
  • Pontiac: Oakland County
  • Port Huron: St. Clair County
  • Warren: Macomb County

*Note: Information on cities in Monroe County were not part of the report.

Of the nine crimes featured, Detroit had the highest rate of the eight featured crimes for all but one. Conversely, of the nine featured crimes, Howell had the lowest rates for six of them.

Overall, property crimes had the overall highest rates of the crimes discussed in this post while murder and non-negligent manslaughter had the lowest. Property crime rates also had the largest difference between the city with the highest rate (Detroit) and the city with the lowest rate (Howell).

According to the FBI, Detroit had the highest murder and non-negligent manslaughter rates in 2016 of the six cities examined in this post. This rate was calculated to be 44 per 100,000 residents; this was equivalent to 303 murders for a population of about 680,000. Between 2015 and 2016 the murder rate remained the same because the population numbers and the number of reported murders and non-negligent manslaughter crimes (295 reported in 2015) didn’t vary much from year-to-year.

Howell was the only one of the six cities with zero reported murders in 2016, and therefore had a murder rate of zero.

According to the FBI forcible rape is defined as “the carnal knowledge of a female forcibly and against her will.  Attempts or assaults to commit rape by force or threat of force are also included; however, statutory rape (without force) and other sex offenses are excluded.”

In 2016, of the cities highlighted in this post, Port Huron had the highest reported rape rate per 100,000 residents at 163; this was equivalent 48 reported rapes reported to law enforcement for a population of about 60,000. In 2015, the reported rape rate in Port Huron was 104.

Ann Arbor had the lowest rate at 37, which was equivalent to 44 total rapes known to law enforcement. Detroit’s forcible rape rate per 100,000 residents was 85 in 2016, or 579 total rapes known to law enforcement.


According to the FBI robbery is defined as “the taking or attempting to take anything of value from the care, custody, or control of a person or persons by force or threat of force or violence and/or by putting the victim in fear.”

Of the featured cities, Detroit had the highest robbery rate per 100,000 at 430, a decrease from the 2015 rate of 510. According to the data, the number of reported robberies in 2016 were 2,941 in Detroit.

Pontiac had the second highest robbery rate in 2016 at 202 and Howell had the lowest rate at 0.

According to the FBI, aggravated assault is defined as “an unlawful attack by one person upon another for the purpose of inflicting severe or aggravated bodily injury.”

In 2016 Detroit had the highest aggravated assault rate of the cities featured in this post. Detroit’s 2016 rate was about 1,446 per 100,000 residents, a rate that was about 320 points higher than the 2015 rate. In 2016, Pontiac had the second highest rate at 913, which was about the same rate for the city in 2015. Ann Arbor had the lowest aggravated assault rate of the six cities featured at 106.

According to the FBI, property crime “includes the offenses of burglary, larceny-theft, motor vehicle theft, and arson.  The object of the theft-type offenses is the taking of money or property, but there is no force or threat of force against the victims.”

Detroit had the highest property crime rate of the six cities featured at 4,628 per 100,000 residents in 2016; this was an increase from the 4,092 rate Detroit had in 2015. The city with the second highest property crime rate was Warren at 2,607 per 100,000. Howell had the lowest rate of the featured cities at 1,304; this rate decreased by about 200 from the year before. There was a 3,324 point difference between Howell and Detroit, making this the largest rate difference of the featured cities.

According to the FBI burglary is defined as, “the unlawful entry of a structure to commit a felony or theft.  To classify an offense as a burglary, the use of force to gain entry need not have occurred.”

Detroit’s burglary rate per 100,000 residents in 2016 was 1,286, making it the highest of the featured cities. Additionally, similar to what the data was shown for the other categories in this post, Detroit experienced rate increase for burglary from 2015 to 2016. In 2015 the burglary rate for Detroit was 1,164 and in 2016 it increased to 1,286.

Howell again had the lowest rate of the cities at 189. Although Howell’s rate was significantly lower than the City of Detroit’s, Howell also experienced a burglary rate increase between 2015 and 2016.

According to the FBI, larceny theft is defined as “the unlawful taking, carrying, leading, or riding away of property from the possession or constructive possession of another.”

Detroit had the highest larceny-theft rates of the featured cities in 2016 at 2,039 and Port Huron came in second at 1,735.

Detroit’s rate was equivalent to 13,938 reported crimes for a population of about 680,000 while Port Huron’s rate was equivalent to 510 reported crimes for a population of about 29,000. Howell again had the lowest rate at 1,104; this was equivalent to 105 reported crimes for a population about about 9,600.

According to the FBI, motor vehicle theft is defined as “the theft or attempted theft of a motor vehicle.”

The highest motor vehicle theft rate of the featured cities was 1,303 per 100,000 residents for the City of Detroit, nearly a 530 point rate increase from 2015. This rate was equivalent to 8,905 motor vehicle thefts for a population about 680,000. The city with the second highest motor vehicle theft rate was Warren with a rate of 379. In 2016 Warren had 512 reported motor vehicle thefts for a population of about 135,000. Ann Arbor had the lowest motor vehicle theft rate of 95 per 100,000 residents in 2016 of the featured cities.

According to the FBI, arson is “any willful or malicious burning or attempting to burn, with or without intent to defraud, a dwelling house, public building, motor vehicle or aircraft, personal property of another, etc.”

Detroit had 554 reported arsons in 2016, giving it the highest rate at 81, while Ann Arbor had 10 reported arsons for a rate of 8.


Where Did the Vote Break in Southeastern Michigan?

Republican areas saw marginally increased turnout between the 2012 and 2016 Presidential elections increased. The focus of that increase was southern Macomb County and the Downriver area in Wayne County. Conversely, the traditionally Democratic areas in Wayne County experienced some of the largest voter turnout decreases. Detroit saw especially large decreases.

Slide03

In Macomb County, eight of the communities experienced a voter turnout decrease between the 2012 and 2016 Presidential elections. It was Chesterfield Township that experienced the largest decrease in the county at 5.35 percent while Ray Township experienced the largest increase at 2.46 percent. Although Warren and Sterling Heights have been noted for having several precincts flip from Democratic to Republican between the two Presidential elections, both cities had areas that remained Democratic in 2016. Sterling Heights experienced a 2.7 percent voter turnout decrease in 2016 and Warren experienced a 1.5 percent decrease. St. Clair Shores is another city in southern Macomb County that flipped from Democratic to Republican and here voter turnout increased by 1.6 percent.

While the changes are complicated, it appears that areas in the county to the south that shifted to the GOP are also areas where turnout declined. Likely Democrats would have benefitted by a better Get Out The Vote (GOTV) campaign.

Slide06

In Oakland County we have highlighted how higher income communities like Bloomfield Hills and Birmingham flipped from being Republican in the 2012 presidential election to Democratic in the 2016 election. These communities though experienced a voter turnout decrease between the two elections, as did majority of the Oakland County communities that went Democratic in 2016. With the exceptions of Ferndale, Madison Heights and Clawson, all of the Democratic communities experienced a voter turnout decrease in 2016. Ferndale had the largest voter turnout increase in the county at 11.6 percent while Berkley had the largest decrease at 23.7 percent.

Republican communities in Oakland County weren’t exempt from experiencing a voter turnout decrease in 2016, however the decreases weren’t as widespread or large.

Slide08

Wayne County communities experienced some of the largest decreases in voter turnout in 2016, with Inkster experiencing a 26 percent decrease, River Rouge experiencing a 23 percent decrease and Redford and Detroit experiencing 11 percent decreases, each. Again, these communities all went Democratic in the 2016 election; they also went Democratic in the 2012 election.

Throughout much of Downriver though, an area that flipped from Democratic to Republican, an increase in voter turnout occurred. In that area, Rockwood had the largest increase at 7 percent. The city of Flat Rock did flip from Democratic to Republican between the two elections, but experienced a 16.36 percent voter turnout decrease.

Hamtramck and Highland Park experienced the largest voter turnout increases in Wayne County; Hamtramck had a 12 percent increase and Highland Park had an 11 percent increase. Both cities went Democratic in the 2012 and 2016 elections.

Slide10

In Washtenaw County, Ann Arbor Township had the highest voter turnout increase at 3.37 percent; this community went Democratic in both elections. The only Washtenaw County community that went Democratic in the 2016 election and experienced a voter turnout increase was Sylvan Township; it had a 0.37 percent increase. There were several Republican communities in Washtenaw County too though that experienced voter turnout increases. For example, Northfield Township experienced a 19.6 percent voter turnout decrease.

Slide12

Overall, the data shows that there were very few communities in Southeastern Michigan that experienced large voter turnout increases (above 10 percent). The marginal increases though occurred in areas that went Republican in the 2016 Presidential election, particularly in northern Macomb County, St. Clair County and the Downriver area in Wayne County.

Majority of Metro-Detroit’s Communities that Flipped Republican have Middle Class Incomes

In our last post regarding the 2016 Presidential election we highlighted what areas in Southeastern Michigan flipped from Democratic to Republican, or Republican to Democratic. The most notable switch occurred in Macomb County where, much of the southern portion of the County went from voting Democratic in 2012 to Republican in 2016. This switch was also noticeably evident in the Downriver area of Wayne County.

In the 2016, Detroit and its inner-ring suburbs (Ferndale, Royal Oak, parts of Warren, etc.), along with Ann Arbor and its surrounding cities to the east and west, had Democratic Candidate Hillary Clinton as the winning candidate. However, a large share of the region went to now President Donald Trump, including all of Livingston and St. Clair counties and majority of Macomb and nearly all of Monroe counties.

To shine additional light on the 2016 Presidential election, we will now be looking at the socioeconomic characteristics of the region, alongside which Presidential candidate won where. For this post, we will be discussing median income, particularly of the areas that flipped between the 2012 and 2016 elections.

When examining the region overall, the map below shows that majority of the areas in Southeastern Michigan that flipped from Democratic to Republican have a mid-range ($45,000-$70,000) median income. As we get further into the details of the region, we see this to be a defining factor for this group of precincts. Of the areas that have remained Republican, median incomes range from between $45,000 and to over $100,000. Of the areas that remained Democratic the median incomes range from about $17,000 to $100,000.

Slide03

A deeper look at Macomb County shows that majority of the areas that switched from voting Democratic in 2012 to Republican in 2016 have a median income between $45,000 and $70,000. This is true for St. Clair Shores, Sterling Heights and parts of Chesterfield, Lenox, Harrison and Clinton townships, all of which had at least one precinct flip. In the northern part of Macomb County, which voted Republican in 2012 and 2016, the median income is above $70,000.

While portions of Warren also flipped from Democratic to Republican, it is categorized as having a median income below $45,000. But, as noted earlier, the city’s median income is $44,000.

Slide05

In Oakland County, there were some high income areas-Bloomfield Township, Bloomfield Hills and Birmingham-that flipped to Democratic. However, we see that majority of the County went Republican in 2012 and 2016, and majority of these communities have median incomes above $70,000. The communities in the southeastern portion of Oakland County (Ferndale, Royal Oak, Oak Park) have remained Democratic communities for both elections and their median incomes top out at $70,000. Pleasant Ridge and Huntington Woods are two higher income (above $70,000) communities in that portion of the County that have traditionally gone Democratic.

Slide07

As noted earlier, it was the Downriver portion of Wayne County that flipped from Democratic to Republican for the 2016 election. In this portion of the County (Trenton, Woodhaven, Riverview, Flatrock, Gibraltar, Rockwood, etc.) 10 of the communities have a median income between $45,000 and $70,000. Parts of Taylor (median income below $45,000) and Brownstown (median income between $70,000 and $100,000) also switched.

Throughout Wayne County, median incomes vary greatly, with communities located on the County’s north eastside (Detroit, Hamtramck, Highland Park and Ecorse, etc.) having a median incomes below $45,000 and communities on the northwest side (Northville, Canton, Livonia) having median incomes above $70,000. Communities with median incomes between the two extremes are also scattered throughout the county. In Wayne County, of the 14 communities with median incomes above $70,000, 10 had a large Republican turnout. Of that 10, four showed precincts that flipped from Democratic to Republican, while the rest remained Republican between 2012 and 2016.

Slide09

In Washtenaw County, there are no communities that have a median income less than $45,000. Of the four that had precincts flip from Democratic to Republican between the two elections, the median incomes range between $67,000 (Northfield) and $94,000 (Dexter).

Of the communities that with precincts that flipped from Republican to Democratic, five had median incomes above $70,000 and one had a median income at $69,000.

Slide11

By examining the election data alongside median income data, we are able to determine there were 32 communities with median incomes between $45,000 and $70,000 with at least one precinct that flipped from Democratic to Republican between the 2012 and 2016 elections. When the opposite occurred-an area flipped from Republican to Democratic-the median income of that area was above $70,000.

Next week we will look at the election outcomes while also looking at the racial makeup of Southeastern Michigan’s communities.

Where Did the RTA Fail in Southeastern Michigan?

In November 2016 the concept of regional transportation in Southeastern Michigan lost again. On the Nov. 8 ballot was a question asking residents of Macomb, Oakland Wayne (including Detroit) and Washtenaw counties if they would fund a 1.2 mill tax (about $120 a year for a homes with a taxable value of $100,000) for 20 years.

If passed, the millage would have created main transportation routes along Woodward, Gratiot and Michigan avenues (some of which would have eventually used Bus Rapid Transit), along with connector lines going east to west throughout Wayne, Oakland, Macomb and Washtenaw counties. However, only Wayne and Washtenaw counties supported the millage overall. In Oakland County the millage fell short of approval by 1,109 votes (50.1 percent of voters voted against it) and in Macomb County the measure failed with 60 percent of voters voting against it.

Slide2

Currently in Southeastern Michigan, public transportation is fragmented, at best. Parts of Wayne, Oakland and Macomb counties are serviced by the Suburban Mobility Authority of Regional Transit (SMART), a transportation system that was created in 1967. However, in Oakland and Wayne counties communities can opt-out of the system, meaning they do not need to support its funding or have routes accessible in their community. Macomb County, through legislation passed by the County Board of Commissioners, is an entirely opt-in community. This means either the majority of the county supports SMART funding when it goes up for renewal and/or increases or it doesn’t; the county as a whole has historically supported SMART.

RTA Vote - Municipality Level - SMART Communities_Borders&Labels_JPEG

Despite Macomb County being completely opt-in for SMART, only one municipality supported the RTA millage in November; it was Mount Clemens-the county seat. According to the Macomb County Clerk’s Department 55 percent of voters in Mount Clemens supported the millage and 45 percent voted against it.

In Oakland County, 23 of the 51 municipalities in the region supported the RTA millage, with the inner-ring suburbs like Ferndale (72% yes), Pleasant Ridge (74% yes) and Huntington Woods (76% percent yes) showing the highest support. Unlike Macomb County, Oakland County is not an entirely “opt-in” community for SMART, meaning individual municipalities decide whether they want to fund/participate in the region’s current form of public transportation. Ferndale, Pleasant Ridge and Huntington Woods all opt-into SMART, as do some of the Oakland County communities that were just above 50 percent of voters supporting the RTA millage; these communities include Bloomfield Township and Birmingham. Troy and Bloomfield Hills are two communities in Oakland County though that participate in SMART but did not approve the RTA millage.

In Wayne County, where there are SMART routes and where the Detroit Department of Transportation (DDOT) operates, communities like Detroit, Hamtramck, Highland Park, Dearborn and Redford Township (which all participate in SMART) voted to approve the RTA millage. However, communities on the western side of the county and a majority of the downriver communities (despite some participating in SMART-like Trenton) did not approve of the transportation millage. Overall, 53 percent of Wayne County voters voted to approve the RTA millage.

Washtenaw County does not participate in SMART (the transit system is limited to Macomb, Oakland and Wayne counties) but it does have the Ann Arbor Transit Authority (AATA). Of those who voted on this measure, 53 percent supported the millage in the county. Overall, eight of the 27 communities in the county supported the millage. However, those with the highest populations (Ann Arbor and Ypsilanti) showed high support for the regional transportation tax.

Despite not having a long-term funding mechanism, the RTA currently operates RefleX, which is a supplemental ride system along Woodward and Gratiot avenues; these services did not eliminate any SMART or DDOT stops/lines. However, the RTA is only funded by the State through Sept. 30, 2017. After that though, its future is uncertain. With the regional transportation millage failing, the RTA is left without a solid funding source and cannot go to the voters with another tax proposal until 2018. According to Public Act 387 of 2012 (which created the RTA), the RTA can receive money through voter approved millage funding and/or an additional fee that may accompany state driver registration fees. Ballot initiatives can only be placed on ballots during presidential or gubernatorial elections.

Members of the RTA Board of Directors or Executive Staff have not publicly stated their future plans or ideas for funding mechanisms. While funding mechanisms would need to be identified, negotiating interlocal agreements between communities that want transit might be an incremental means of supplementing the fragmented systems currently in place. For example, there are no direct public transportation routes between Ann Arbor and Detroit[1] even though Ann Arbor, Detroit and DTW are the most desired routes, according to surveys. Both Wayne and Washtenaw Counties voted for the RTA, so it seems feasible that enterprising public officials in those two counties could negotiate an agreement to move forward on creating services, knowing both that their residents voted for services and that they want those routes.

[1] It might be possible for an ambitious soul to take a bus from Ann Arbor to the Detroit Metropolitan Airport (DTW) and then shift to a SMART bus and transfer to a DDOT bus into Detroit.
[1] It might be possible for an ambitious soul to take a bus from Ann Arbor to the Detroit Metropolitan Airport (DTW) and then shift to a SMART bus and transfer to a DDOT bus into Detroit.