Southeastern Michigan Poverty Levels Drop Slightly

Throughout Southeastern Michigan, majority of the communities in the region experienced a decrease in the percentage of residents living below the poverty level between 2015 to 2016, according to data from the U.S. Census Bureau. In 2016, a family of four was considered to be living at the poverty level with an annual income of $24,250, according to the U.S. Department of Health and Human Services; this was the same for 2015.

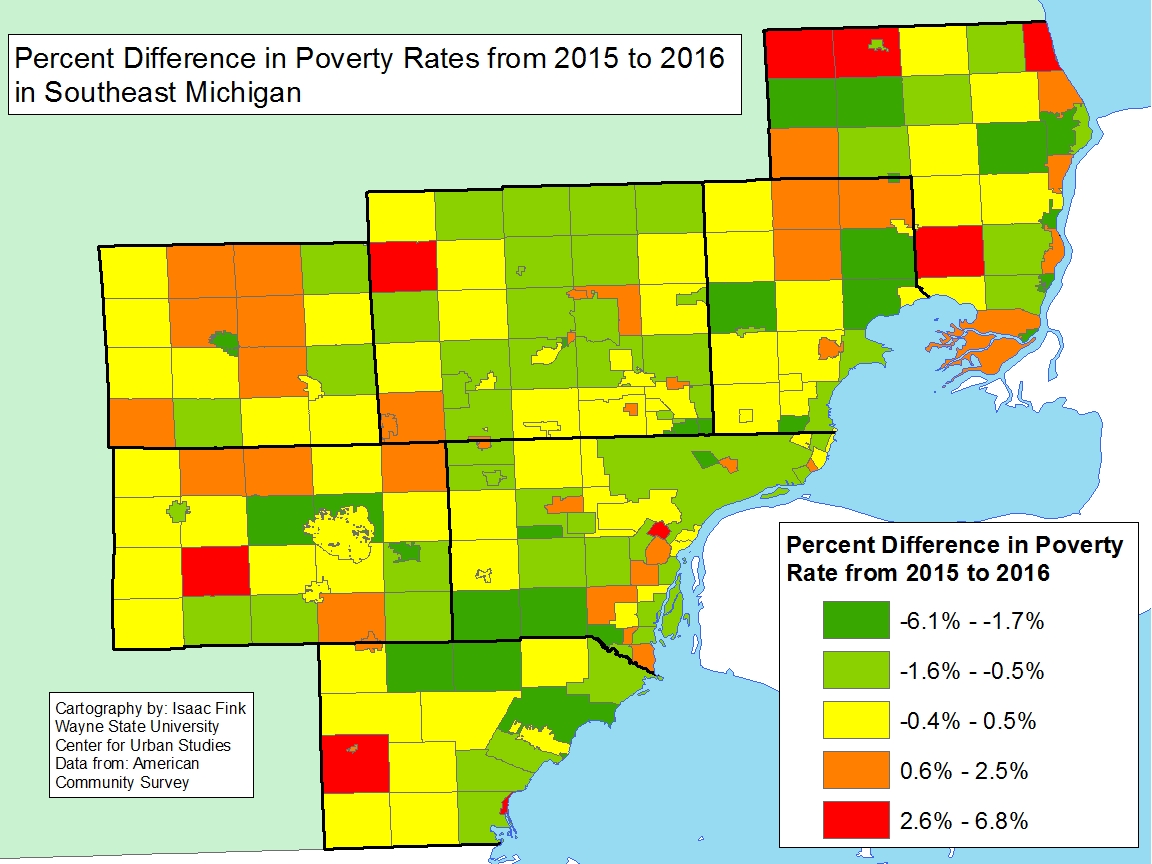
Southeastern Michigan was -0.2 percent. However, Summerfield Township in Monroe County experienced a 7 percent increase in the percentage of residents living below the poverty level between 2015 and 2016. In 2015, 9 percent of residents in Summerfield Township lived below the poverty level and in 2016, 16 percent of residents lived below the poverty level. Of the 28 municipalities (out of 213 in Southeastern Michigan) where there was a 1 percent or higher increase in the poverty level between 2015 and 2016, the majority were located in the rural suburbs of the region.


The municipality with the largest percentage decrease in residents living in poverty was Port Huron Township in St. Clair County at -5 percent. In 2015, 23 percent of the residents in Port Huron Township lived below the poverty level and by 2016 that decreased to 18 percent.

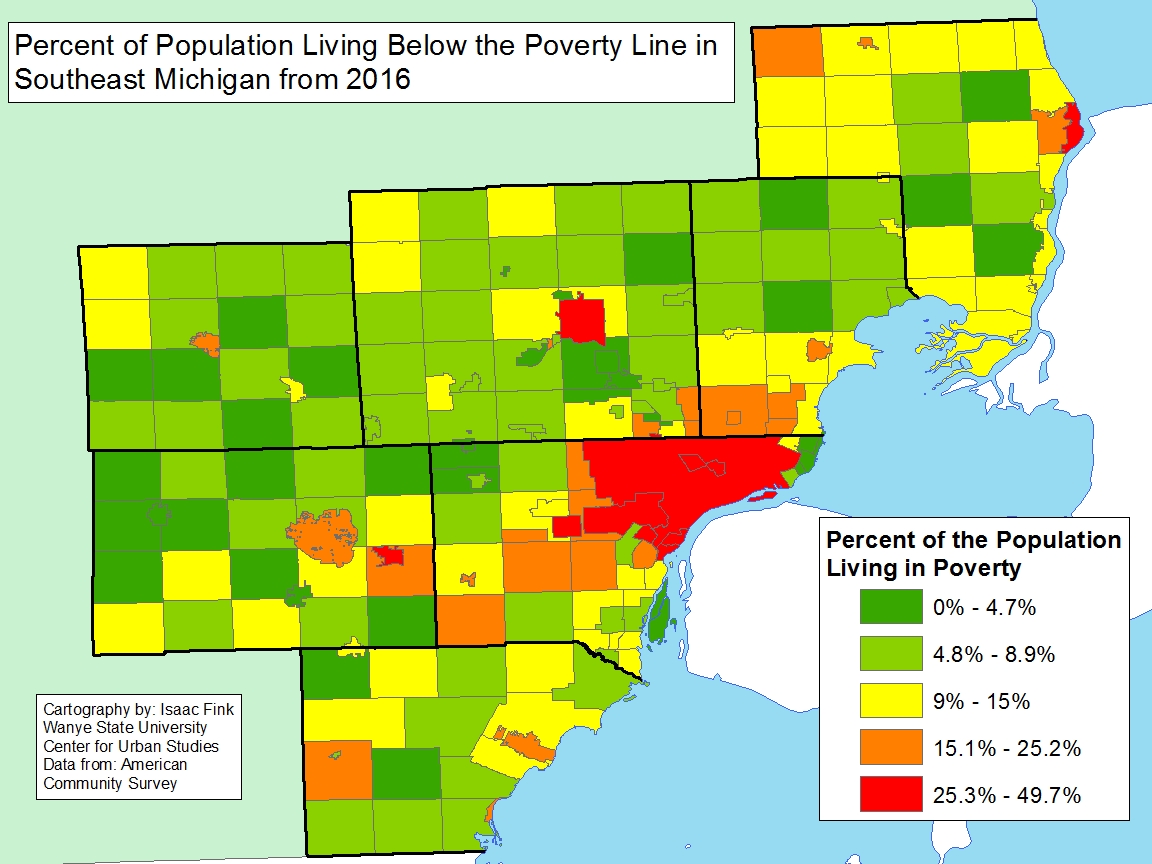
While there was an overall average decrease in the percentage of residents living in poverty between 2015 to 2016, the two cities with the highest overall percentage of residents living below the poverty level experienced an increase. In 2016, about 50 percent of the residents in Hamtramck lived below the poverty level; this was a 2.4 percent increase from 2015. In 2016, Highland Park had about 47 percent of its residents living below the poverty level, which was an increase of 2.5 percent.


Detroit

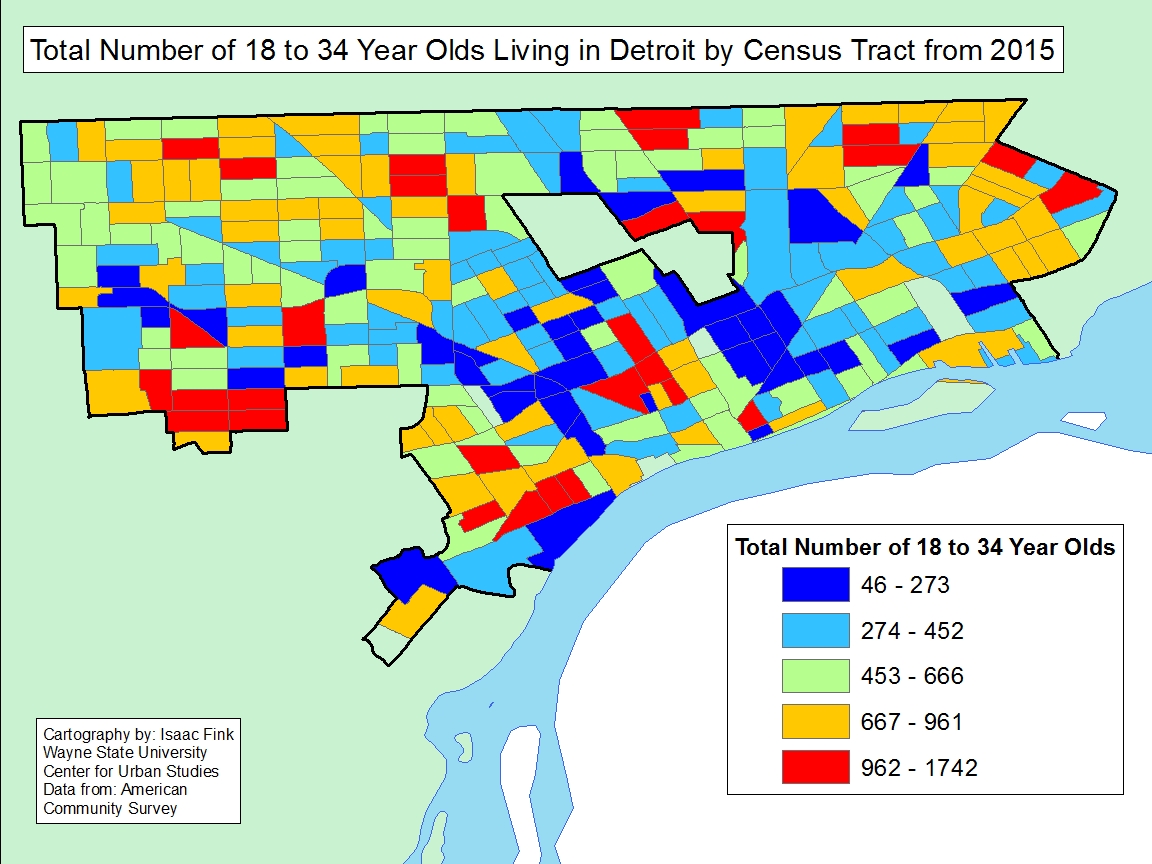
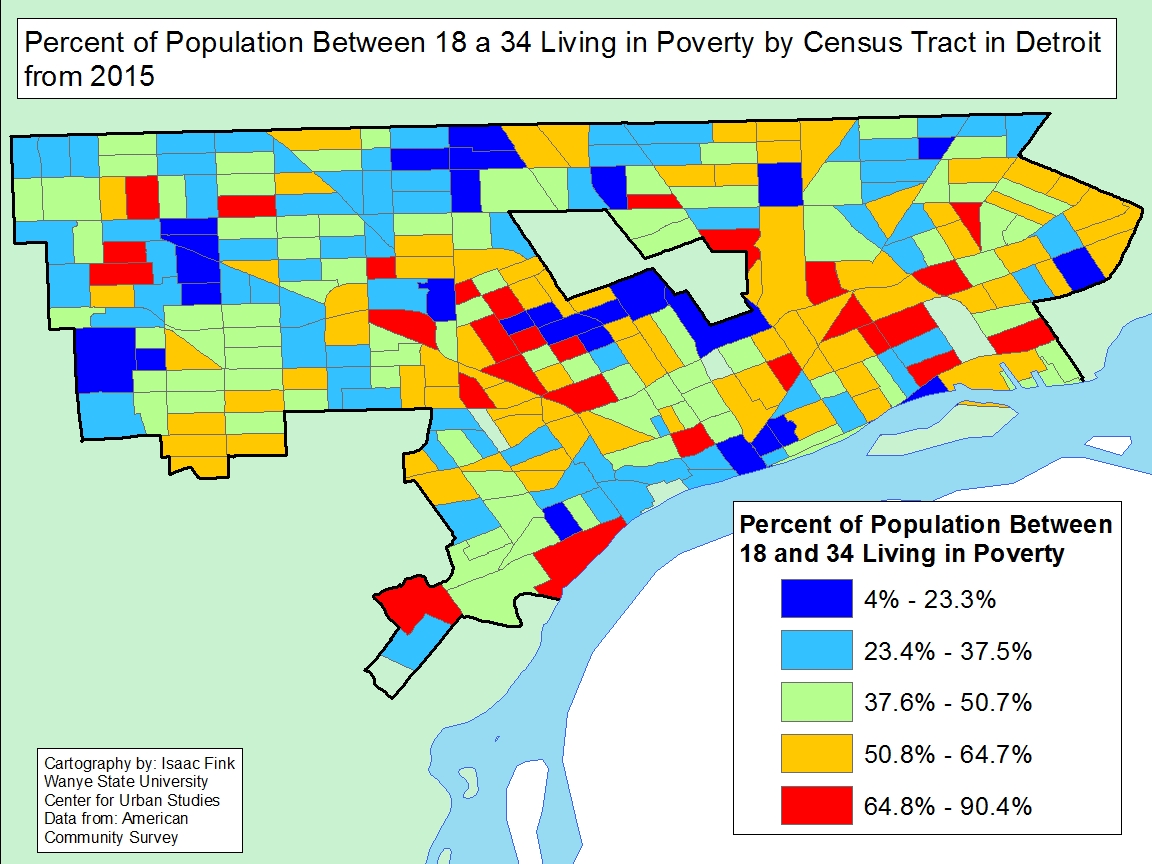
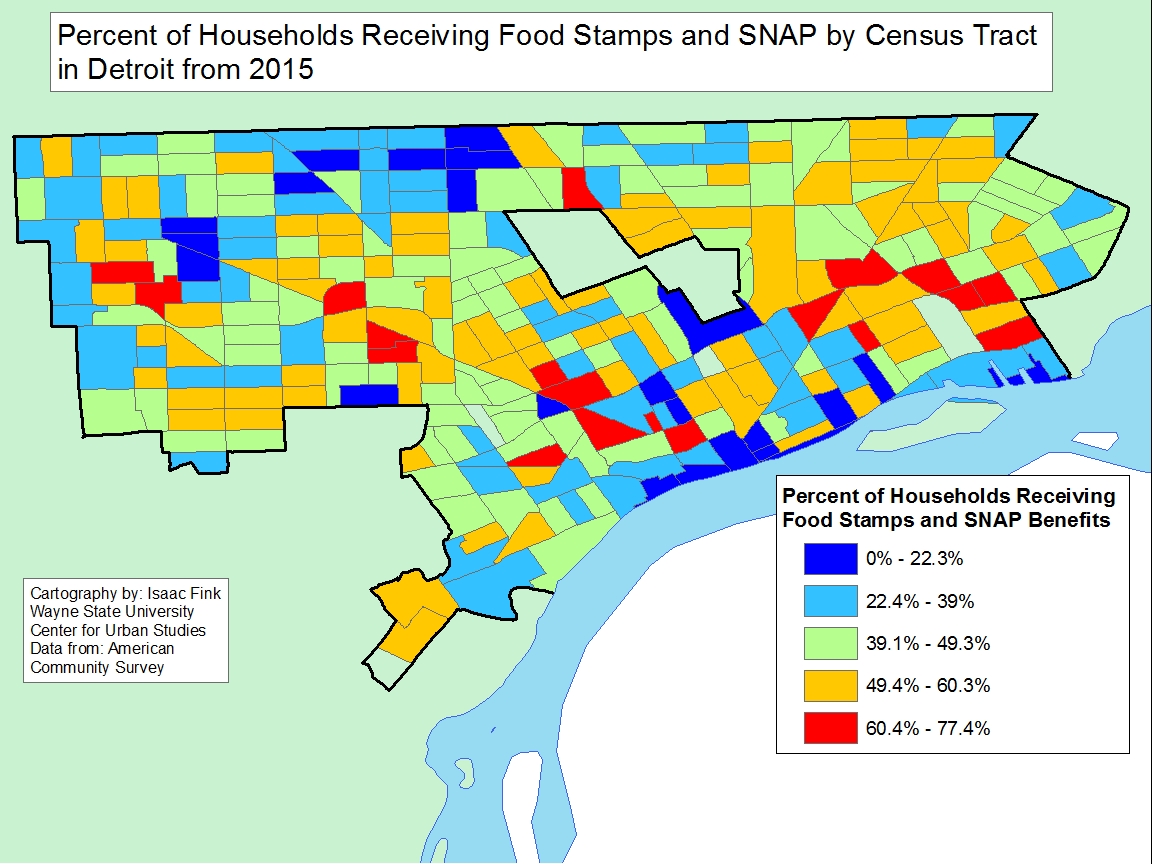
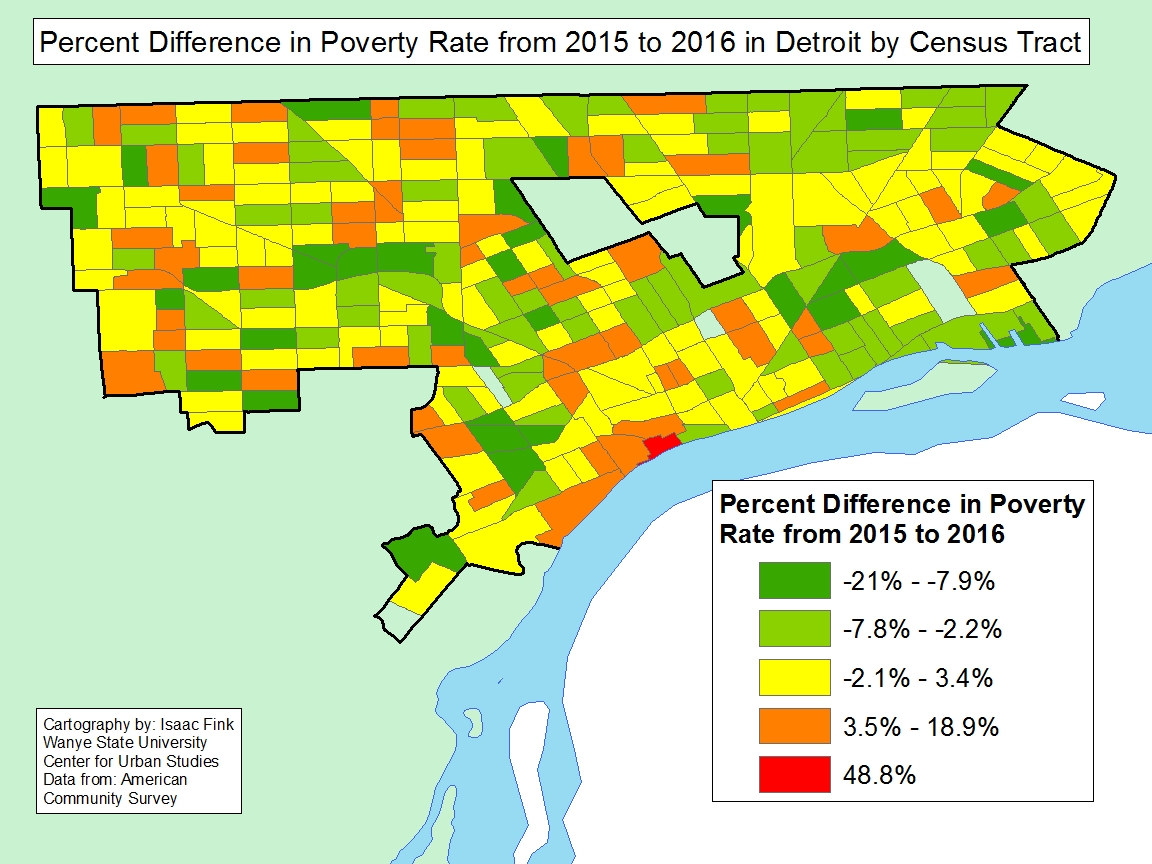
In 2016, about 39 percent of residents in Detroit lived below the poverty level, which was a decrease of 1 percent from 2015. A closer look at the Census tracts in Detroit though show that poverty levels did not decrease across the board. One Census tract specifically, which is located along the Detroit River in Southwest Detroit, experienced a 49 percent increase in the percentage of residents living below the poverty level. In addition to that Census tract, several others surrounding it also experienced poverty level increases up to 19 percent.

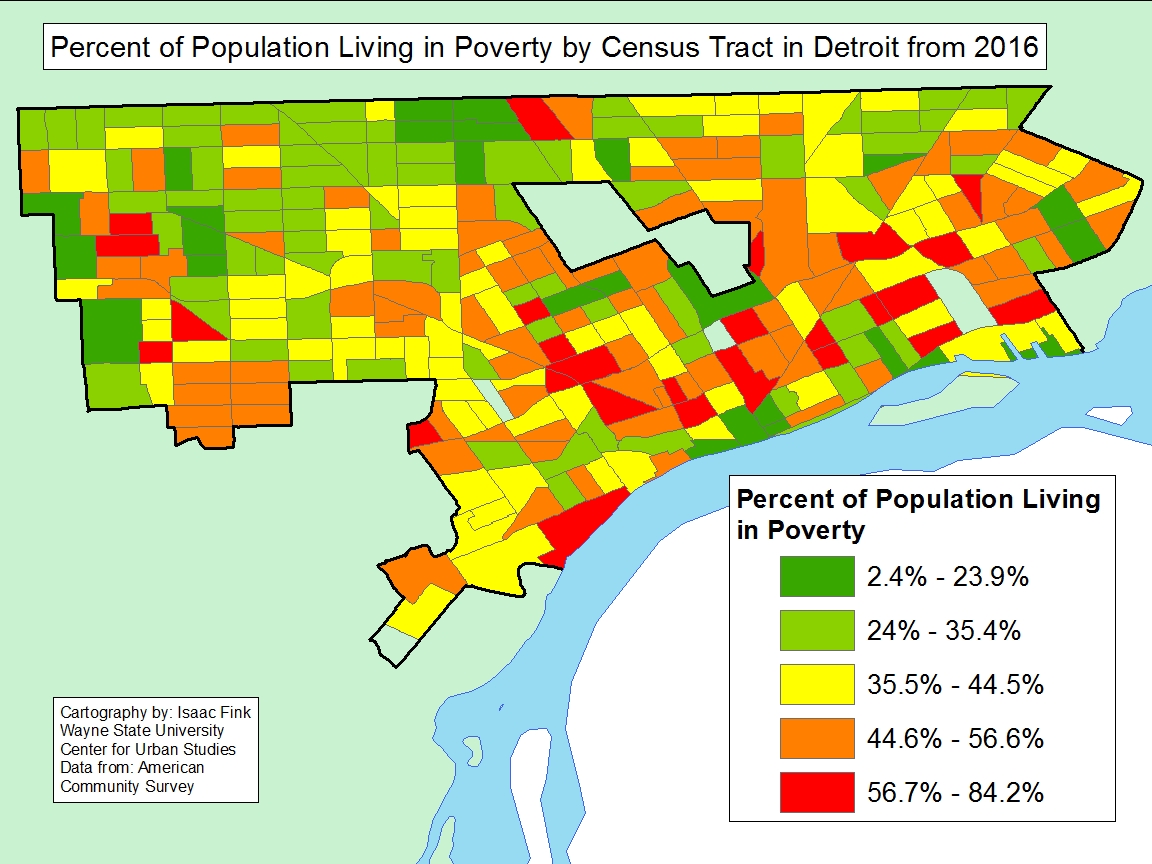
When looking at the Census tracts east of Hamtramck, with the exception of seven, all experienced a decrease in the percentage of residents living below the poverty level. It was this area of the City of Detroit that had the fewest number of Census tracts with percentage increases in the poverty level but also had among the highest poverty levels in 2016. It was just west of Highland Park though that had the most number of Census tracts with poverty levels below 35 percent in 2016.

Overall, the most recent poverty data released by the U.S. Census Bureau does show that poverty levels are decreasing, but not a rapid rate. The data also shows that there were 19 municipalities in the region with 20 percent or more of residents living below the poverty level. While this was a decrease from the 23 municipalities with the same statistic in 2015, the numbers still tell a story that Southeastern Michigan isn’t climbing out of poverty rapidly. We will need many years of broad based economic growth to reduce poverty levels substantially.

Poverty, Unemployment Rates Higher for Young Adults in Detroit than City’s Overall Rates

In the City of Detroit the percentage of young adults (categorized as 16 to 34-year-olds in this post) living at or below the poverty level in 2015 was 42 percent, with the labor force participation rate for that same age group being 64 percent and the unemployment rate being 35 percent. Two out of three of these rates were above those for the City of Detroit overall. In 2015 the percent of all Detroit residents (including children) living below the poverty level was 40 percent, the labor force participation rate was 63 percent and the unemployment rate was 13.2 percent.

While the trend for these above mentioned rates for the young adult population was to be above the overall rates for the City, a deeper look at the rates showed they varied across Census Tracts in the City. For example, Census Tracts with the highest percentage of young adults living in poverty were along Grand River on the West Side and along Gratiot on the east side of the City. On the east side of the City, majority of the Census Tracts had between 50 and 90 percent of young adults living at or below the poverty level. Fortunately some of these same Census Tracts had among the lowest populations of young adults living there, with several having between 46 and 452 young adult residents residing in each Census Tract.

In the northeastern portion of the City, there were about a dozen Census Tracts with among the highest number of young adults living there, with numbers ranging between 667 and 1,742. These Census Tracts also had some of the highest labor force participation rates, as did a pocket in the western portion of the City of Detroit, along with several other pockets throughout the City. The tracts with the low labor force participation rates (29-48 percent) were frequently the same ones that had the highest percentage of young adults living at or below the poverty level; these Census Tracts are just east of Hamtramck. An individual is considered part of the labor force if they have a job or are actively seeking one. The labor force participation rate is the percentage of adults who are members of the labor force.

Two of these Census Tracts just east of Hamtramck also had among the highest unemployment rates for young adults, ranging between 59 and 89 percent. Overall in the City there were only 20 Census Tracts where between 59 and 89 percent of young adults were unemployed. Again, some of the tracts arrayed along Grand River on the west and Gratiot on the east had very high unemployment rates.

There are some tracts where high poverty, labor participation and unemployment rates overlap, but this is not the case for a majority of the Census tracts. At the same time the data tend to indicate a larger percentage of young adults are unemployed and, thus, living in poverty than the overall Detroit population. Clearly, getting more young adults employed must be a very high priority, and given that the national rate of unemployment is approaching 4 percent, there should be opportunities to connect these young adults to the labor market. Clearly it should be a priority to target job development and training programs to areas near Central High School along Grand River, as well as along Gratiot and in the Osborn and Demby areas.

Distribution of Public Assistance Benefits Often Overlaps in Detroit

In examining Census data from 2015 we see that households throughout Detroit receive various forms of public assistance, in addition to incomes such as retirement, social security, and/or supplemental social security. The data presented in this post shows that, often, Census tracts with a higher percentage of households that received a retirement income had lower percentages of households that received public cash assistance and/or food stamps.

When examining the retirement income map the data shows that the Census tracts with the highest percentage of households that received retirement income were in the northern and western portions of the City. In addition, there was a handful of Census tracts east of Woodward Avenue with upwards of 34 percent of households earning a retirement income. Conversely, there were more than 80 Census tracts, primarily located southwest of Highland Park and Hamtramck, where less than 17 percent of the households receive a retirement income.

There were 29 Census tracts in Detroit where 44.9 percent or more of households relied on Social Security as part of their income and, on the opposite side of the spectrum there were about 40 Census tracts where 22.9 percent of those households, or less, relied on Social Security as part of their income. There was often an overlap in Census tracts with the highest percentages of households receiving retirement income and the highest share of households on on Social Security. But, there were differences across these maps as well. For example, many parts of Southwest and Midtown had both large percentages of residents receiving both retirement income and Social Security.

There was less of an overlap on Census tracts with the highest percentage of households receiving Social Security and tracts where many residents received Supplement Social Security benefits. In order to be eligible for Supplemental Social Security an individual must be: age 65 or older, blind or disabled and have a limited income and resources. Additionally, there was an overall higher percentage of households receiving Social Security benefits than Supplemental Social Security benefits. The Census tract with the highest percentage of households receiving Supplemental Social Security had 36.2 percent of households receiving Supplemental Social Security, while the highest tract for Social Security was  54.8.

The areas in which there was the overlap for the highest percentages of households receiving a certain income or benefit was in the Census tracts where for households receiving public cash assistance and food stamps. For example, there was a cluster of Census tracts along and to the east of Gratiot where up to 20.7 percent of households received cash assistance and up to 77.4 percent of households received food stamps. The data indicate that in 19 tracts between 60.4 and 77.4 percent of the households receive food stamps, and in over 80 tracts between 49.4 and 60.3 percent of residents receive food stamps. To be eligible for food stamps a family of four cannot earn more than $31,240 a year. In order to be eligible for public cash assistance an individual must have a child, have under $3,000 in cash assets and under $25,000 in property assets. The thresholds that households must meet to receive both types of these forms of government assistance, showcases how, particularly in the red colored Census tracts, incomes are among the lowest.

Overall, this post highlights how households in the City of Detroit rely on various forms of benefits and incomes. Clearly there are many retired households living on either retirement income or social security. These households are often, though not always in the same general neighborhoods. People that rely on food stamps and public assistance sometimes overlap with these neighborhoods, but they often concentrate in other areas. There are also areas—often including Downtown,  Midtown, East Jefferson and the far west neighborhoods–where far fewer households rely on any form of retirement income or public benefits.


Wayne County Home to Region’s Oldest Homes

The majority of Southeastern Michigan’s oldest homes are located in Wayne County, with six of the communities in the county having more of than 50 percent of the housing stock built prior to 1950. These communities are: Detroit, Highland Park, Hamtramck, Grosse Pointe Farms, Grosse Pointe Park and Wyandotte. Of those communities, and regionally, Grosse Point Park had the highest percentage of homes built before 1950 at 77 percent, followed by Hamtramck at 70.4 percent. In Detroit, about 58 percent of the city’s housing stock was built before 1950. Majority of the homes in Detroit built before 1950 are located in Southwest Detroit, with pockets near the Highland Park and Hamtramck borders, or the central area of the city. Conversely, the area long Belle Isle/the West Village and the most northwest corner of Detroit have the lowest percentage of homes built prior to 1950.

Regionally, about 22 percent of Southeastern Michigan’s housing stock was built prior to 1950. Looking a decade ahead, Census data shows that about 41 percent of the region’s housing stock was built before 1960. In examining this map below, we see that the communities with the highest percentage of homes built before 1960 mainly grew around the city of Detroit into the southern borders of Macomb and Oakland counties, and just east of Detroit. Southern Macomb County experienced some of the largest growth between 1950 and 1959, according to the Census Data. During that time frame Eastpointe grew its housing stock by 48 percent, bringing the total percentage of homes built prior to 1960 to about 78 percent. The City of St. Clair Shores grew its housing stock by 51 percent between 1950 and 1959; the total percentage of this city’s housing stock built prior to 1960 is 66 percent. In Oakland County, the City of Oak Park grew its housing stock by 51.2 percent between 1950 and 1959, growing the percentage of its housing stock built prior to 1960 to 67 percent.

While the inner-ring Detroit suburbs began to grow during this time, the peak percentage of homes being built after 1950 was for cities like Detroit, Hamtramck and Grosse Pointe Farms. For the city of Hamtramck, majority of its housing stock was built before 1939; the same is true for the city of Grosse Pointe Farms.

In Detroit, 22.9 percent of its housing stock was built between 1950 and 1959, making about 80 percent of its housing stock being built before 1960. The decade in which plurality of Detroit’s housing stock was built was between 1940 and 1949; about 24 percent of the housing stock was built during the 1940s.

As noted, the percentage of homes built outside the city of Detroit truly began to ramp up after 1950; the Detroit map below shows a similar trend was also occurring in the city. In the 1950 Detroit map above the Census data shows that majority of the housing built in Detroit prior to 1950 was located in the southwest portion area of the city and the more central area. The 1960 map shows that the percentage of housing built in Detroit between 1950 and 1959 largely grew in the northern and northwestern parts of the City.

This post highlights that Detroit and its inner-ring suburbs have a large stock of aging homes that will require investments and stronger laws to remain safe and habitable. One recent example of this is how the Detroit City Council approved updating its property maintenance code. This code amendment now requires landlords to remove lead hazards from homes that they rent. Such actions are particularly important because, because homes built prior 1978 are particularly susceptible to hazards related to lead-based paint given that a ban didn’t exist until then.

Lead Poisoning in Detroit, 2016

Lead poisoning has long been a serious problem for Detroit’s children, producing a lifetime of reduced cognitive capacity and many other consequences. In 1998, 17,015 Detroit children under 6 years old were lead poisoned at or above the 5 micrograms of lead per deciliter of blood (ug/dl) level. For over a decade lead poisoning has been declining yeay-by-year, but in 2016, the number rose by over 400 children to 2,073 (Figure 1). This was over 27 percent increase in one year (Figure 3).

It is likely that the proximal cause of this rise was an increase in testing of children. As shown below (Figure 2), testing had been declining in Detroit in recent years through 2015. In 2016, testing of children shot up by 9.5 percent (Figure 3). Over 2,000 more children were tested during this time. This was for two clear reasons. First, the Flint crisis surrounding lead in drinking water triggered more parents to have their children tested. Second, the City of Detroit, emerging from bankruptcy, was rebuilding its Health Department, and that agency began to actively test for lead and to encourage others to do so as well.

While, the percentage of children with lead poisoning has recently increased, the numbers are not evenly distributed across Detroit (Figure 4 below). Rather, children with lead poisoning are concentrated in zip codes where there are many older houses, mostly built well before the 1940s when lead paint was used frequently in homes. Second, these zip codes have low medium incomes (recall that poverty has increased in Detroit), and residents cannot afford to maintain their homes or landlords choose not to do so. Third, there are still many children in these zip codes.

So, many children are exposed to fraying homes where lead paint was heavily used historically. In one of these zip codes, 48214, preliminary data from a sample of over 500 homes indicates that as many as 87.9 percent of the homes assessed have some lead present on windows, walls, floors or porches. In this same zip code, tests show that about 17 percent of children have lead poisoning. The zip code with the highest percentage of children with lead poisoning is 48206 at 22.3 percent.

So, what can be done? Three important strategies are being executed by the City and others.

  • First, the Health Department attempts to case manage lead poisoned children, making sure that their home gets assessed and parents are trained to protect the child. Early intervention may reduce the long term effects of poisoning.
  • Second, where feasible, the homes of these children are referred for lead abatement, a procedure where lead hazards are removed from the home using public dollars, where the household cannot afford to pay. This can be very expensive, ranging from $5,000 to over $20,000. Still this costs a lot less than the lifetime cost of lead poisoning for a child.
  • Third, the City recently passed amendments to its property maintenance code that requires landlords to remove lead hazards from homes that they rent. In effect, this requires them to remove lead hazards. The City will be ramping this strategy up over the next few years, and this is expected to help the over 50 percent of Detroit residents who now rent.

Two more strategies are emerging as well:

  • First, ClearCorps and The Wayne State Center for Urban Studies are piloting an effort to identify homes with lead where children reside. Through this process an abatement of early lead hazards will take place, removing the hazard of a child being lead poisoned. The challenge for this approach is whether enough abatement funds and contractors to do the work can be made available for these homes.
  • Second, another possibility is to help families, who might choose to do so, to relocate to areas where homes have little or no lead paint. As Figure 4 above shows, several of the northern and western zip codes of Detroit have relatively low levels of lead poisoning of children. Figure 5, below, shows the percentage of tested children identified as lead poisoned for all of Wayne County. Figure 6 shows Oakland County. Figure 7 shows Macomb County. Many of these zip codes have no reported lead poisoning cases, but some of the housing may be prohibitively expensive for current Detroit residents.

Poverty, Labor Force Participation Moderately Correlated in Southeastern Michigan

As discussed throughout our most recent series, data about labor force participation highlights decreasing percentage of individuals who are not active participants in the work force. To further explore the recent labor force and poverty rate discussions, this post delves into the correlation between the 2015 labor force participation rate and the 2015 poverty levels across the Southeastern Michigan area.

A correlation is statistical technique that can be used to describe the relationship between two variables. The correlation coefficient, often expressed as ‘r’, is a numerical value that is always between +1 and -1. When r is closer to +1, it implies a positive correlation; as one variable increases, the other does as well. When r is closer to -1, it implies an inverse correlation; as one variable increases the other decreases. When the value of r is closer to 0 the implication is that there is no relationship between the two sets of data.

Looking across the region we find that labor force participation with poverty at a level of -0.46, a moderate correlation. (Note that we are using municipalities as the unit of analysis here.) This correlation tends to indicate that as labor force participation declines, poverty increases, all other factors being equal. This helps to explain why we are seeing increasing poverty in areas, including many suburban areas, where labor force participation was hit hard by the Great Recession.


We also examined the variation in this correlation across the counties in the region.


Correlation Coefficients for Southeastern Michigan Counties: Labor Force Participation and Poverty

  • Livingston County: -.4
  • Macomb County: -.24
  • Monroe County: -.18
  • Oakland County: -.28
  • St. Clair County: -.18
  • Washtenaw County: .08
  • Wayne County: -.84

These results present correlations calculated across municipalities within counties. We found that, aside from Washtenaw County, every other county in Southeastern Michigan had a negative correlation, meaning that as labor force participation declined, poverty increased. Of those six counties, Wayne County was the only one to have a strong negative correlation—(-0.84). This implies that municipalities in Wayne County with lower labor participation are very likely to have higher levels of poverty.


The correlations for five other counties–Macomb, Livingston, St. Clair, Monroe and Oakland–were negative but weak or moderate, meaning that there was still a tendency for poverty to increase with a lower labor participation rate, but it was weaker.


Washtenaw County was the only county in the region to have a correlation coefficient above 0, the value being +0.08, indicating a very low positive association between poverty and labor force participation.


Overall, these analyses show that six of the seven counties had weak to moderate correlation between their labor participation rates and their adult poverty rates. Wayne County was the exception to this, with a strong correlation coefficient of -0.84. Previous posts have shown that Wayne County communities also experienced some of the largest decreases in its labor force participation rates since 2010 and had some of the highest overall adult poverty rates. For example, in 2015 Highland Park had the lowest adult labor force participation at 54 percent, while the poverty rate is 49.3 percent.


In the suburbs, particularly those located nearer to Detroit (with some notable exceptions), there have been overall declines in labor force participation rates. At the same time data clearly shows that the percentage of adults in poverty has been increasing for many of the suburbs in Southeastern Michigan in recent years.

Strong Correlations Exist For High Education Levels and High Incomes Throughout Most of Southeastern Michigan

In our last post we showed there is an area of overlapping high median incomes and high educational attainment running through Washtenaw County, western Wayne County, southern Oakland County and western Macomb County with nearly the opposite—lower median income and lower educational attainment–south of that in the region. In this post, we discuss explicitly the correlation between the levels of education examined in the last post (less than high school education, high school education, associate’s degree or some college education, bachelor’s degree, and graduate/professional degrees) and median incomes. The correlations are calculated for medians and percentages of municipalities across the region.

A correlation is statistical technique that can be used to describe the relationship between two variables. The correlation coefficient, often expressed as ‘r,’ is a numerical value that is always between +1 and -1. When r is closer to +1, it implies a positive correlation; as one variable increases, the other does as well. When r is closer to -1, it implies an inverse correlation; as one variable increases the other decreases. When the value of r is closer to 0 the implication is that there is no relationship between the two sets of data.

Educational Attainment Correlation Value
Achieved less than a high school diploma -0.74
Achieved only a high school diploma -0.71
Achieved some college or an associate’s degree -0.57
Achieved only a bachelor’s degree 0.75
Achieved a graduate or professional degree 0.77


Looking first across the region incomes tend to be lower for those municipalities with a higher percentage of people who do not have a high school degree, with a correlation of -0.74. This tends to indicate that less education leads to lower incomes. At the same time, it could mean that people with lower incomes have less of chance of completing their education. For those with a high school diploma the effect was slightly smaller, with a correlation of -0.71, and similarly for those with some college or an associate’s degree the correlation was -0.57.

For those at the upper end of education distribution the opposite holds true—there is a positive correlation between higher educational levels and higher incomes. Across Southeast Michigan for the municipalities with a higher percentage of people with a bachelor’s degree, incomes tend to be higher, with a correlation of 0.75. The relationship between income and educational attainment is even stronger for those who have attained graduate or professional degree, with a correlation of 0.77.

Next we examined these relationships at the county level—for all municipalities in a county. Of the seven counties in the region, Wayne County had the strongest correlations of (0.91) in relation to those with bachelor’s degrees and the median income. For those with graduate or professional degrees in Wayne County the correlation was 0.90 percent.  Monroe County had the weakest correlation value between those with bachelor’s degrees and the median income, with a correlation value of 0.22; it also had the weakest correlation between income and those with graduate or /professional degrees, with a correlation value of at -0.13 percent. Such values for Monroe County indicate that the relationship between higher levels of education attainment and higher median incomes are weakened or reversed in that largely rural setting. For several of the other counties, the correlation between these variables was much greater. In addition to Monroe County having a weak relationship between median income and those with a bachelor’s degree, there was also a weak relationship between those same two variables for St. Clair and, surprisingly, Washtenaw counties. For Washtenaw, it may occur because there are many students with higher education who are still pursuing degrees and have relatively lower incomes.

At the other end of the education spectrum, there exist a strong tendency for lower incomes to be associated with lower levels of education. Each county has either a moderate to strong correlation between incomes and lower levels of education. Monroe County again had the lowest correlations between median income and educational attainment for attainment, this time for less than a high school education and up to a high school education.

Overall, these analyses show a range of correlations across counties between higher median incomes and higher levels of educational attainment, some high and positive, others weak. Monroe County stands out as the only county one where there was a weak correlation between median income and all levels of educational attainment. It could be speculated this is because it is a more rural county and much of the work there relates to agriculture, work that is often learned at home within families.  In southeastern Michigan as a whole, there are relatively strong positive and inverse correlations between incomes and education attainment. There is a positive correlation between those who have achieved a graduate or professional degree and incomes–people with higher education tend to have higher incomes.  There is an inverse relationship between those who have not achieved a high school diploma and incomes–those with less education tend to have lower incomes.

Median Income, Educational Attainment Highlight Segregated Classes in Southeastern Michigan

Using Census data, this post examines the visual correspondence between income and educational attainment across the region. It clearly portrays the continuing association between these two critical variables with one region of high income and high educational achievement arching across the region from Washtenaw County, through Western Wayne County and up through Oakland County and western Macomb County. South of this is a region of lower income and educational attainment with a few islands of higher income and achievement. In all, this represents a strong and largely consolidated portrait of segregated classes in this region.

In Southeastern Michigan the City of Highland Park had the lowest median income at $17,250, with 33 percent of the adult population only having a high school diploma. In terms of educational attainment in Highland Park, those who had some college education or an associate’s degree represented the highest percentage of residents, as opposed to the other categories (less than high school, high school education, bachelor’s degree, graduate or professional degree). On the opposite end of the spectrum, the City of Bloomfield Hills had the highest median income at about $173,000, with the largest percent of its adult population having a graduate or professional degree (38%). Such trends are not unique to Highland Park or Bloomfield Hills.

Above the maps show what the median income of each community is with an overlay that shows what the percentage of educational attainment is at five different levels. These levels are: graduate degree, bachelor’s degree, associate’s degree or some college, high school diploma or an equivalency and less than a high school diploma. The overall purpose of each map is to present an image on how educational attainment and at each level may, or may not, relate to the median income.

When looking at the maps above we see that the communities that have more than 18 percent of its adult population with graduate or professional degrees tend have median incomes above $77,000. In total, there were only 10 communities, out of 46, where more than 18 percent of its adult population had graduate or professional degrees but the median income was below $77,000. Of those 10 communities, the City of Ypsilanti had the lowest median income at about $31,000 and 18 percent of its adult population had a graduate or professional degree. The community with the highest percentage of adult residents with a graduate or professional degree  is Ann Arbor, where both the University of Michigan and the University of Michigan Hospital are located. The median income for Ann Arbor in 2015 was $103,000. There was no community in Southeastern Michigan where more than 30 percent of the adults had a graduate or professional degree and had a median income below $95,000.

On the opposite side of the spectrum, there are 154 communities in Southeastern Michigan where 10 percent or more of the adult population had less than a high school education in 2015. The City of Hamtramck had the highest percentage of adults without a high school education at about 31 percent; the City’s median income was about $23,000. There are nine communities in the region where 20 percent or more of the population had less than a high school education. Of those nine communities, with the exception of Lincoln Park, none had a median income above $33,000. The median income in Lincoln Park was $41,000 in 2015. The City of Detroit is included in that list of nine communities, with a median income of about $26,000 and about 22 percent of its adult population having less than a high school education. Additionally, in Detroit, about 32 percent of the adult population had a high school education, and about 32 percent had some college education or an associate’s degree.

The percentage of Detroit residents with a bachelor’s degree was far lower than any of the statistics mentioned above. In Detroit, about 8 percent of residents had a bachelor’s degree in 2015. In terms of the percentage of residents throughout Southeastern Michigan with a bachelor’s degree, the average percentage was 18 percent and the median income was about $66,000.

Regionally, the community with the highest percentage of residents with a bachelor’s degree was the Village of Grosse Point at about 62 percent; the city had a median income of about $139,000. The City of River Rouge had the lowest percentage of adults with a bachelor’s degree at about 4 percent; it had a median income of approximately $26,000. In total, there were 46 communities in Southeastern Michigan where less than 10 percent of the population had a bachelor’s degree. Exeter Township, located in Livingston County, had the highest median income of the 46 communities that had less than 10 percent of its adult residents with a bachelor’s degree. The median income in Exeter Township was about $68,000.

Overall, this post shows that there is a correlation between median incomes and educational attainment, a deeper conversation that we will dive into next week. The maps and the data show that it is the communities with the higher percentage of residents with a bachelor’s degree and/or a graduate degree that have amongst the highest median incomes.

Higher Percentage of Children in Poverty in Southeastern Michigan than Adults

In Southeastern Michigan there is a greater percentage of children under the age of 18 living in poverty in several communities than there is adults living in the same circumstances. Not only is this the case in the region, but also, the percentage of children living in poverty has increased at a more rapid rate since 2000 than it has for those between the ages of 18-64 and for those above the age of 65. This is sad state of affairs.

All data presented here is provided by the U.S. Census Bureau and according to the U.S. Department of Health and Human Services, the poverty threshold for an individual in 2015 was an annual earning of $11,770 and for a family of four it was $24,250.  In 2010 the poverty threshold for an individual was $10,830 and for a family of four it was $22,050. In 2000 the poverty threshold for an individual was $8,350 for a family of four was $17,050.

In the year 2000 the following five municipalities had the highest percentage of children under the age of 18 living in poverty:

  • Highland Park: 45 percent
  • Hamtramck: 36.4 percent
  • Ecorse: 34.9 percent
  • Detroit: 33.9 percent
  • River Rouge: 30.9 percent

In 2010 the municipalities with the highest percentage of children population living in poverty shifted to the following:

  • Highland Park: 58.5 percent
  • Hamtramck: 58.5 percent
  • Ecorse: 51.9 percent
  • Detroit: 46.9 percent
  • Memphis: 46 percent

By 2015 the percentage of children living in poverty had increased still further throughout the region, as can particularly be seen by the top five communities with the highest percentage of children living in poverty. These communities were:

  • Highland Park: 63.8 percent
  • Hamtramck: 62. Percent
  • Detroit: 57.1 percent
  • Inkster: 56.7 percent
  • River Rouge: 54.4 percent


Percent in Poverty Level Changes 2000-2010

Between 2000 and 2010 the LaSalle Township experienced the highest percentage increase of children residing in poverty at 28.4 percent. LaSalle, being a more rural suburban community in Southeastern Michigan, was not the only community with such characteristics to find itself atop the list with the highest percentage increases. Of the 46 communities that experienced more than a 10 percent increases in the percentage of children living in poverty between 2000 and 2010, 11 were inner-ring suburbs.  Detroit experienced a 13 percent increase in the percentage of children living in poverty between 2000 and 2010; Highland Park experienced a 12.8 percent increase and Hamtramck experienced a 22 percent increase. Overall, there were only 39 communities that experienced either no increase in the percentage of children residing in poverty or a decline in the percentage.

When comparing the increase in the percentage of children living in poverty between 2000 and 2010 we see that for both adults between the ages of 18-64 and those over the age of 65, neither group experienced an increase above 17 percent. For children under the age of 18, there were 12 communities where the increase in the percentage of children living in poverty was above 17 percent.

Percent in Poverty Level Changes 2010-2015

Between 2010 and 2015 there were 32 communities in Southeastern Michigan where there was more than a 10 percent increase in percentage of children living in poverty. Of these communities, the top five were nearly all more rural, suburban communities. These communities were:

  • Richmond (city): 35.2 percent
  • Belleville: 24 percent
  • St. Clair: 23.3 percent
  • Melvindale: 23.2 percent
  • Sumpter Township: 21.7 percent

Percent in Poverty Level Changes 2000-2015

Between 2000 and 2015 there were 64 communities in Southeastern Michigan that experienced over a 10 percent increase in the percentage of children living in poverty since 2000 and 173 communities that experienced an increase above 0.01 percent. The top five communities with the largest increases were:

  • Richmond (city): 31.6 percent
  • Inkster: 28.6 percent
  • Royal Oak Township: 28 percent
  • Sumpter Township: 27.6 percent
  • Eastpointe: 26 percent

During this time span we do see that there is a greater number of inner-ring suburbs that experienced increases above 10 percent than there were during the 2000 to 2010 time frame. However, as the map shows above, the suburbs were not protected from the, in some cases drastic, increases in the percentage of children living in poverty.  And, just as the increases were drastic for several communities throughout Southeastern Michigan, they were also far greater than the percentage increases of adults between the ages of 18-64 and those above 65 living poverty during the same time period. For those between the ages of 18-64 the highest percentage increase of those living in poverty was River Rouge at 21 percent. For those above the age of 65 the City of Hamtramck experienced the largest increase at 13.5 percent.

Overall, the data presented in this post conveys two strong messages: Southeastern Michigan has a greater percentage of children living in poverty than adults and the elderly, and the percentage of children living in poverty has been increasing at a faster rate than the adults living in the region. Additionally, the data presented in this post again shows the theme that poverty levels aren’t only increasing in the region’s urban areas, but also in the suburbs and more rural areas.

Southeastern Michigan Suburbs Experience Highest Poverty Increases for Elderly

Since the year 2000 several municipalities in Southeastern Michigan have had consistently the highest percentages of residents over the age of 65 living at or below the poverty level–Highland Park, Hamtramck, Detroit. Remarkably, however, as this post demonstrates the biggest increases in poverty among older adults were in suburbs.

At the same time, the percentage of elderly residents living below the poverty line in Southeastern Michigan municipalities is below that of those between the ages of 18-64 living in poverty. Regionally, in 2015 about 10.3 percent of residents between the ages of 18-64 lived in poverty and about 6.5 percent of residents over the age of 65 and older lived in poverty.

All this poverty data is provided by the U.S. Census Bureau while the U.S. Department of Health and Human Services tell us the poverty threshold for an individual in 2015 was an annual earning of $11,770 and for a family of four it was $24,250. In 2010 the poverty threshold for an individual was $10,830 and for a family of four it was $22,050. In 2000 the poverty threshold for an individual was $8,350 for a family of four was $17,050.

In the year 2000 the following five municipalities had the highest percentage of residents over the age of 65 living in poverty:


  • Royal Oak Charter Township: 32.1%
  • Highland Park: 28.8%
  • Memphis: 19.4%
  • Detroit: 17.9%
  • Hamtramck: 17.4%


In 2010 the municipalities with the highest percentage of elderly living in poverty shifted to the following:


  • Hamtramck: 28.6%
  • Highland Park: 26.1%
  • Oak Park: 23.1%
  • Hazel Park; 22.6%
  • Center Line: 21.9%

Most recently, in 2015, we again saw several of the same municipalities in Southeastern Michigan having the highest percentage of elderly living at or below the poverty line. By this time the percentage of elderly in poverty had continued to increase for several of the municipalities.

  • Highland Park: 38.6%
  • Hamtramck: 30.7%
  • Detroit: 20.4%
  • Melvindale: 19.5%
  • Madison Heights: 17.2%

Percent in Poverty Level Changes 2000-2010

Between 2000 and 2010 the only inner-ring suburb that ranked in the top five for Southeastern Michigan municipalities with the highest increase in the percentage of elderly living at or below the poverty line was Hamtramck. The top five municipalities that experienced the highest change in those 10 years were:

  • Yale (St. Clair County): 15.6%
  • Hazel Park (Wayne County): 15.1%
  • Brighton (Livingston County): 13.9%
  • Marion (Livingston County): 13.1%
  • Lynn Township (Livingston County) 12%

From 2000 through 2010 for the 213 municipalities for which comparable data was available through the American Community Survey, 84 experienced a decrease in the percentage of residents over the age of 65 living in poverty. On the opposite side of the spectrum, about 20 of the communities that experienced an increase in the percentage of elderly living in poverty were direct suburbs of Detroit. However, between 2000 and 2010, Detroit experienced only a 0.7 increase in the percentage of elderly living in poverty. Highland Park, which has typically ranked at the top for the percentage of residents living in poverty and for percentage increases, experienced a 2.7 percent decrease in the percentage of elderly residents living in poverty between 2000 and 2010.

Percent in Poverty Level Changes 2000-2015

Between the years 2000 and 2015, the increase in poverty among older residents was on par with the increases experienced for several municipalities between the years 2000 and 2010. During this time period, the City of Hamtramck experienced the largest increase at 13.5 percent, followed by Berlin Township (St. Clair County) and Melvindale. These were the only three communities in Southeastern Michigan that experienced increases above 10 percent in the percentage of elderly residents living in poverty. Additionally, there was an overall increase in the number of communities between 2000 and 2015 that experienced a decrease in the percentage of residents over the age of 65 living in poverty. Of the 213 municipalities for which comparable data was available, 94 experienced a decrease. However, Highland Park experienced about 9 percent increase in the percentage of older residents residing in poverty between 2000 and 2015, and Detroit experienced about a 2.5 percent increase. Still the remarkable trend was the tendency for poverty among older adults to increase in the suburbs.

Percent in Poverty Level Changes 2010-2015

Between 2010 and 2015, Highland Park experienced the largest increase in the percentage of residents over the age of 65 living in poverty. During this time frame, Highland Park experienced an increase of about 12.5 percent; Berlin Township followed with an increase at about 10.8 percent. These two communities were the only ones in the region that experienced increases for the percentage of residents over the age of 65 living in poverty above 10 percent between 2010 and 2015.

Additionally, between 2010 and 2015, the number of communities that experienced a decrease in the percentage of elderly residents living in poverty decreased. In total, of the 213 communities for which data was available for, 102 experienced a decrease in the percentage of residents living in poverty.

Overall, this post shows that currently, and overtime, there is a smaller percentage of resident over the age of 65 living in poverty. Compared to last week’s post, which focused on those between the ages of 18-64 (typically those of working age) we see that there is a higher percentage of residents between the ages of 18-64 living in poverty and that those percentages across the region have increased for those in that age bracket. For the elderly population though, the percentage of residents residing in poverty has increased overtime for a number of municipalities, but majority of the region experienced a decrease.