Southeastern Michigan’s Poverty Levels Have Increased Since 2000

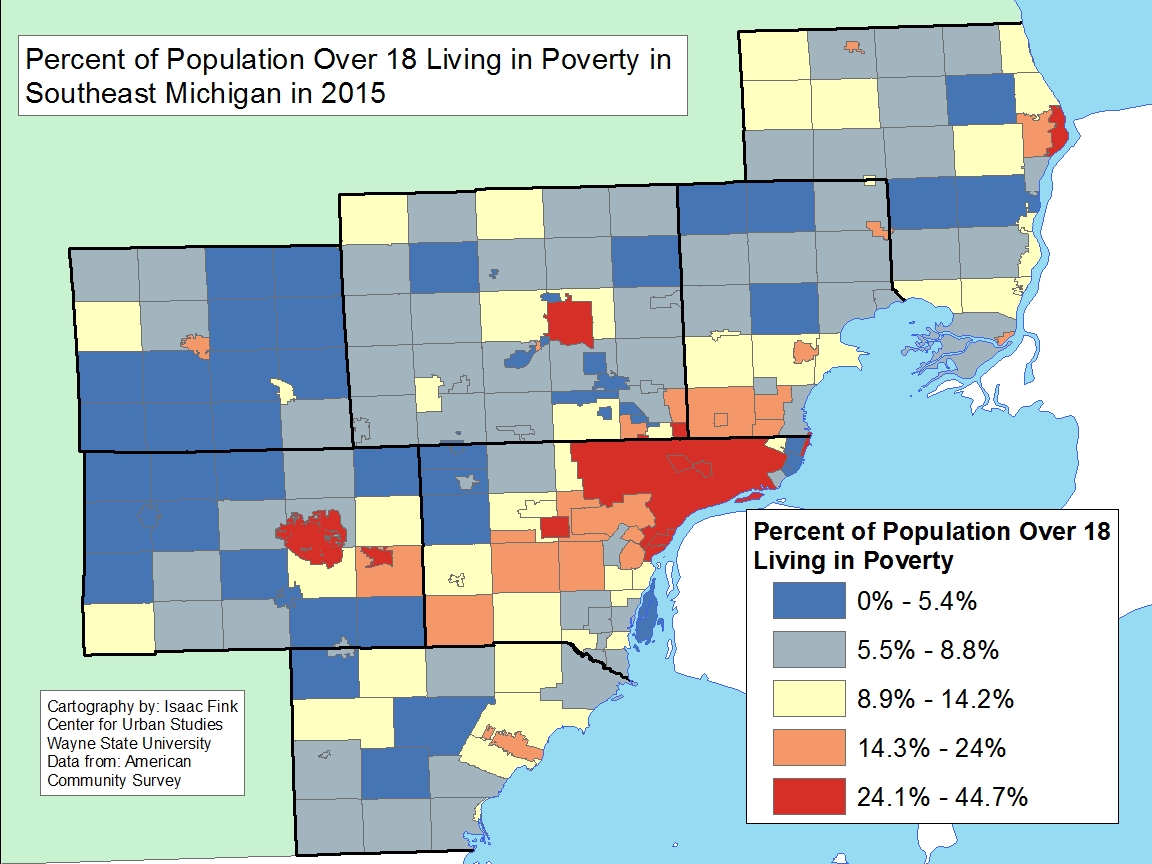
This post explores how the percentage of residents between the ages of 18-64 living in poverty has increased throughout Southeastern Michigan since 2000 and 2015. The bottom line here is that the substantial majority of communities saw increases, some of them substantial, in poverty over the years 2000 through 2015. Only 10 saw decreases.

All data is provided by the U.S. Census Bureau and the U.S. Department of Health and Human Services. In 2000 the poverty threshold for an individual was $8,350, and for a family of four it was $17,050. In 2010 the poverty threshold for an individual was $10,830, and for a family of four it was $22,050. The poverty threshold for an individual in 2015 was an annual earning of $11,770, and for a family of four it was $24,250.

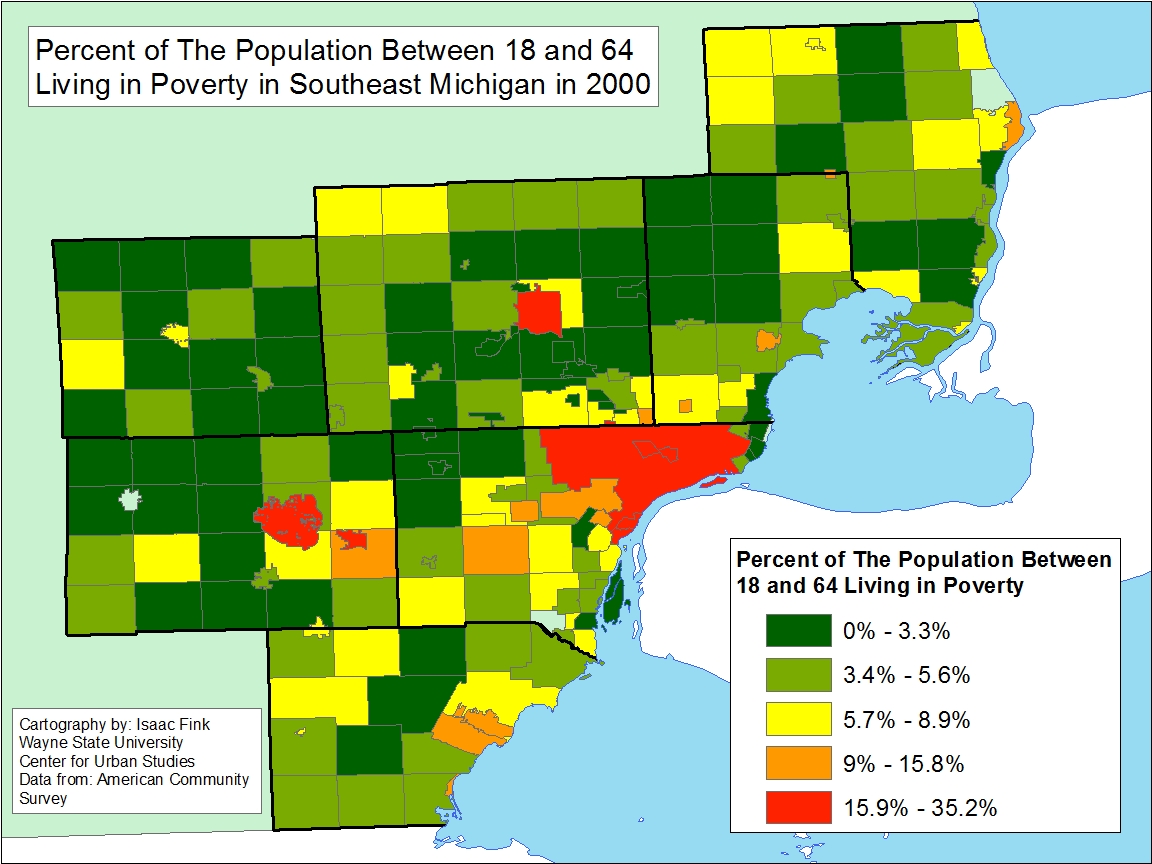
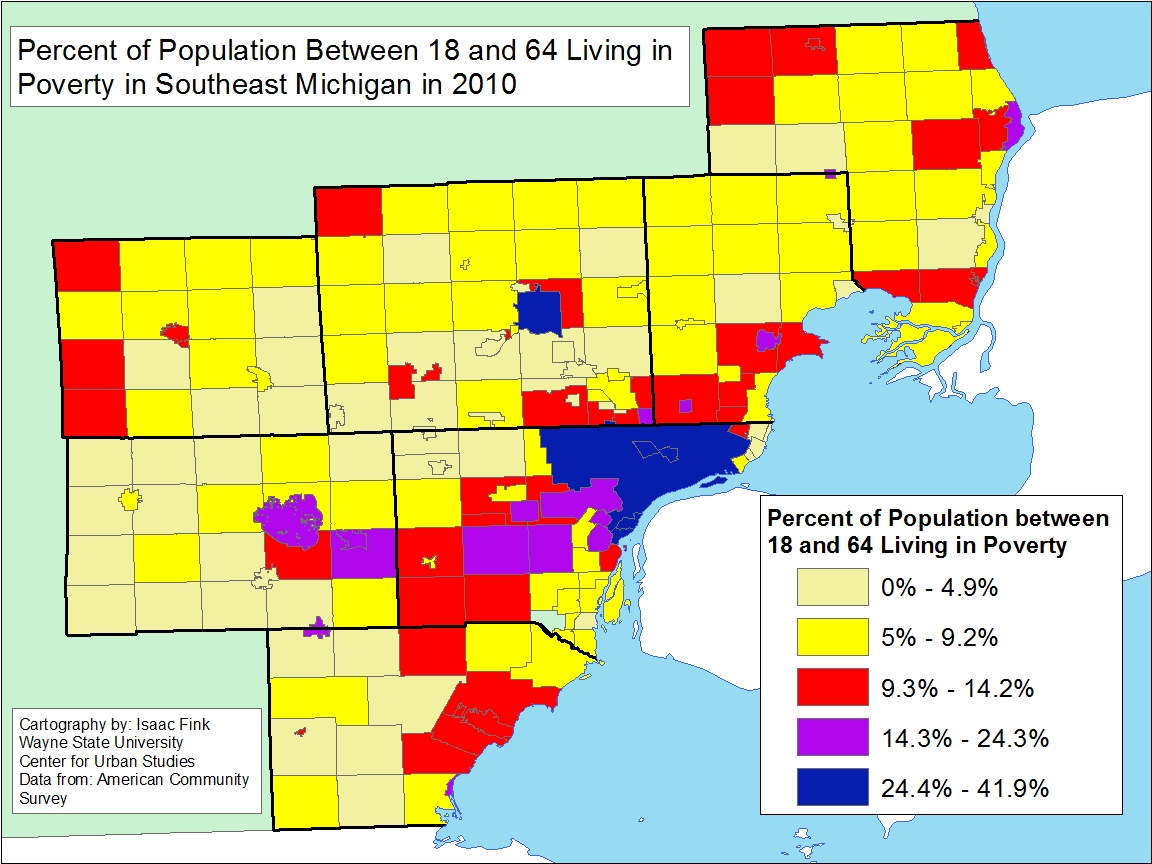
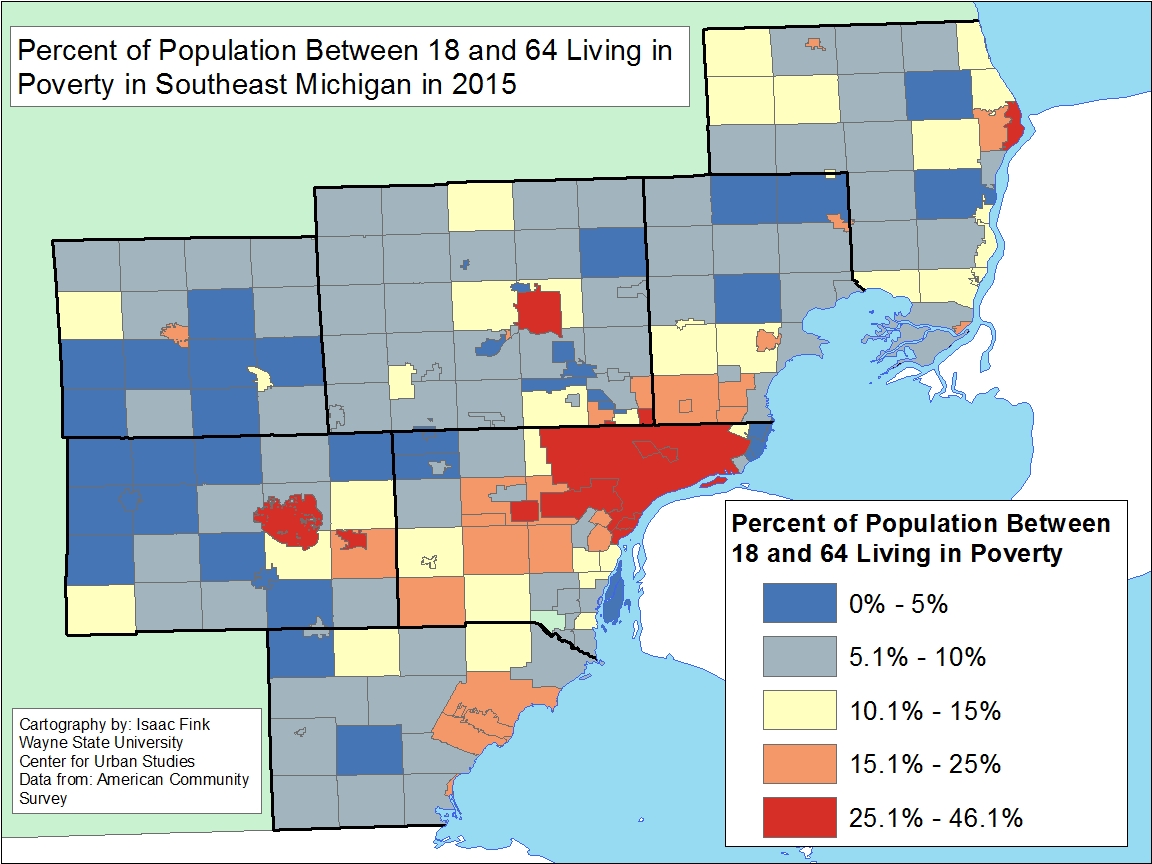
According to data from the U.S. Census Bureau, the City of Highland Park had the highest percentage of individuals between the ages of 18-64 living in poverty in the years 2000, 2010 and 2015. Between each of the years the percentage has continued to grow. In 2000, the Census reported that 35 percent of the adult population between the ages of 18-64 was living in poverty in Highland Park. In 2010 that number increased to 42 percent and by 2015, 46.1 percent of the adult population between the ages of 18-64 in Highland Park was living in poverty. Just as Highland Park remained at the top of the list for the percentage of individuals between the ages of 18-64 living in poverty, the top five Southeastern Michigan communities with the highest poverty levels didn’t shift much from year-to-year. The data are displayed below.

2000

  • Highland Park: 35%
  • Detroit : 23%
  • Hamtramck: 23%
  • Ypsilanti: 20%
  • River Rouge: 20%

2010:

  • Highland Park: 42%
  • River Rouge: 36%
  • Hamtramck: 35%
  • Detroit: 31%
  • Royal Oak Township: 28%

2015:

  • Highland Park: 46%
  • Hamtramck: 41%
  • River Rouge: 41%
  • Detroit: 38%
  • Ypsilanti: 34%

Percent in Poverty Level Changes 2000-2010

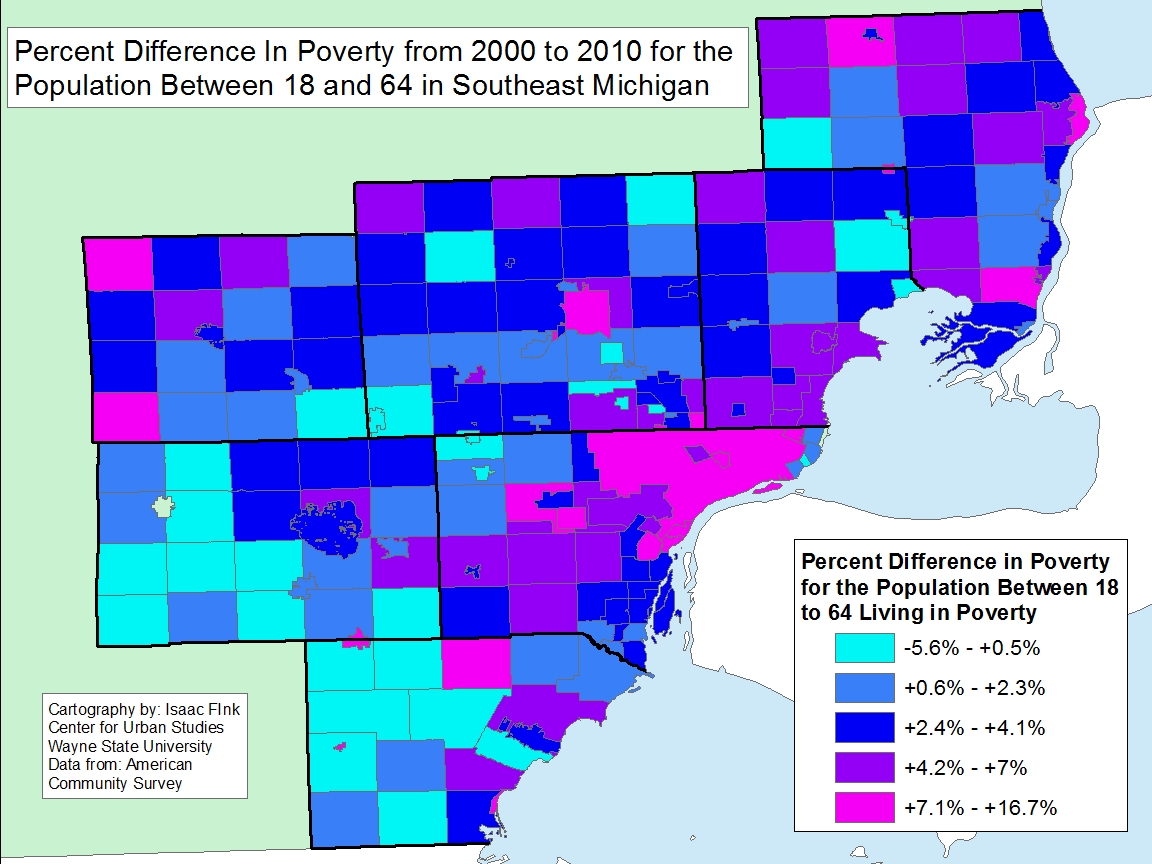
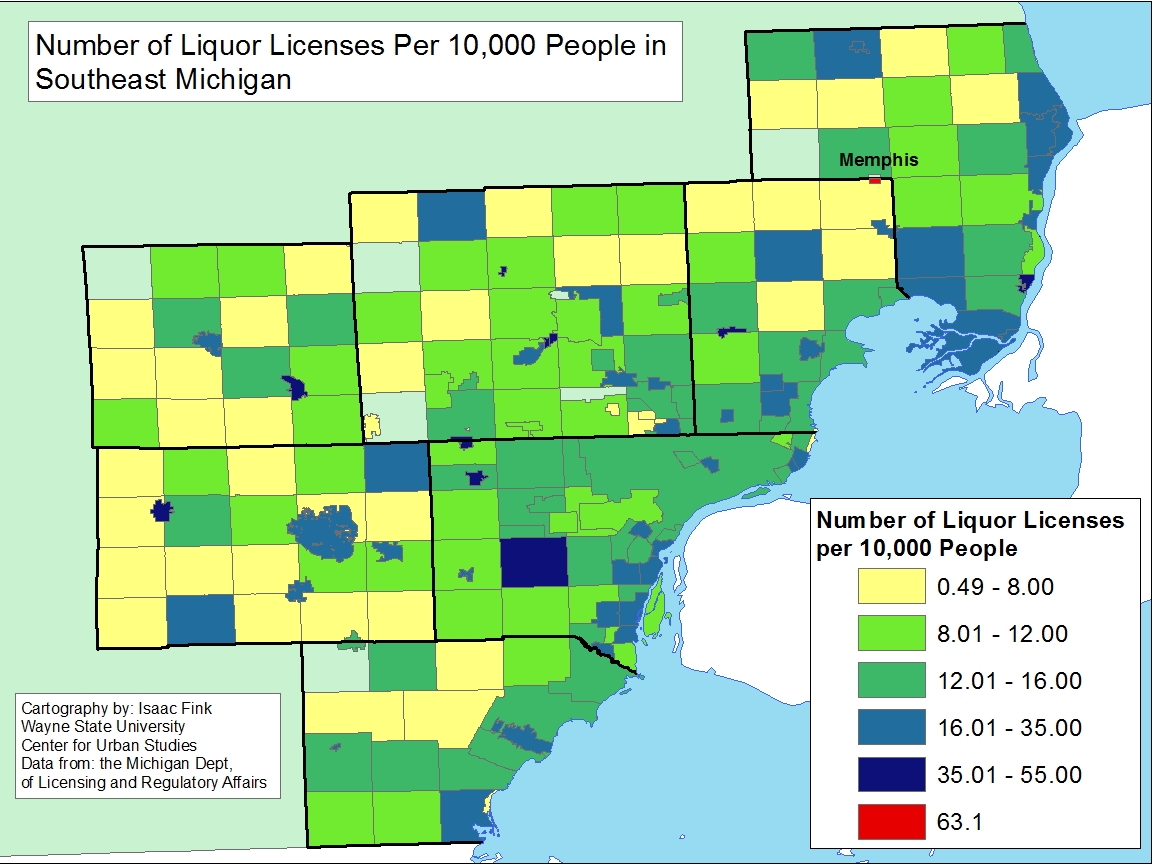
When viewing how poverty levels have increased over time, the data shows that between the years 2000 and 2010 the City of Memphis (on the border of St. Clair and Macomb Counties) had the highest percentage increase of individuals between the ages of 18-64 living in poverty at about 17 percent. River Rouge and Hamtramck followed in the number two and three spots with percentage increases at 16 and 12, respectively. Highland Park experienced an increase at 7 percent while Detroit experienced an 8 percent increase.

Percent in Poverty Level Changes 2000-2015

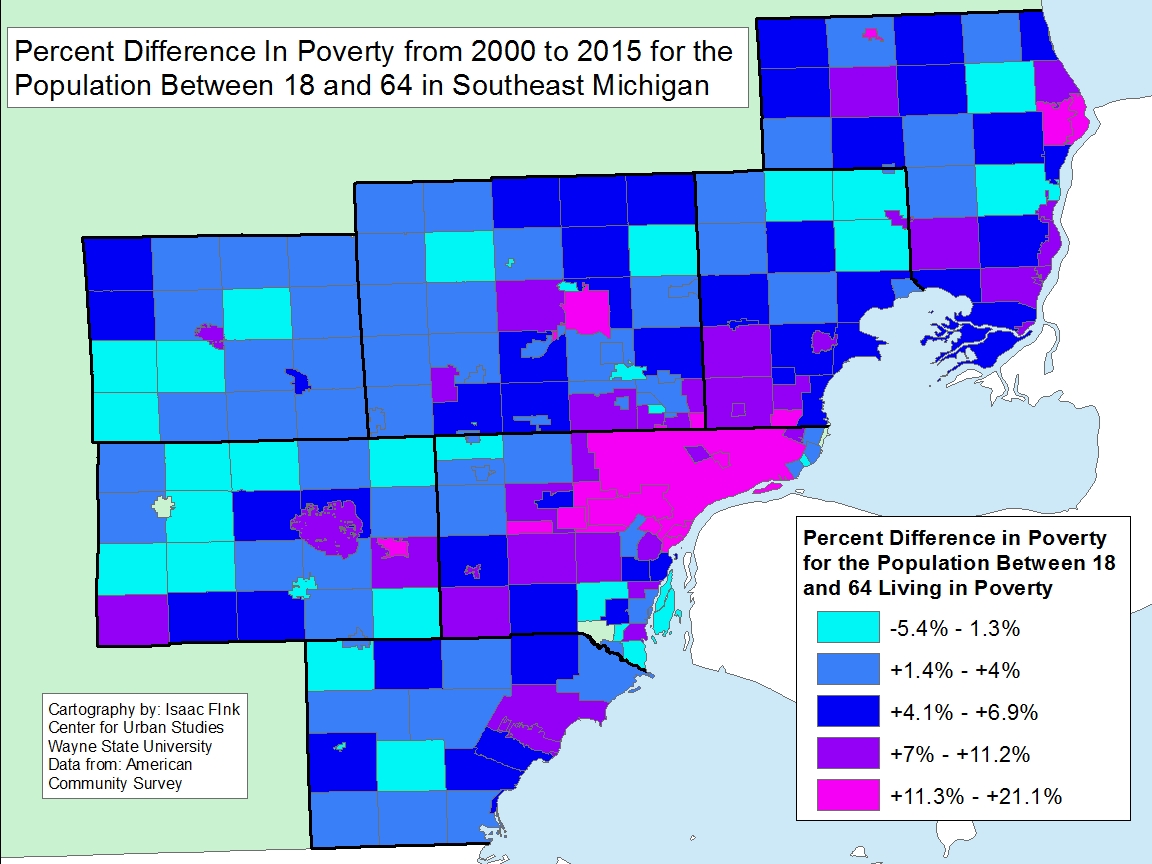
Expanding the range of dates from 2000 through 2015, River Rouge, Hamtramck and Port Huron Township had the highest increases in the percentage of individuals between the ages of 18-64 in poverty between 2000 and 2015. For River Rouge that increase was 21 percent; Hamtramck had a 19 percent increase, and Port Huron Township had a 19 percent increase. In Detroit the percentage increase for individuals in poverty between the ages of 18-64 was 15 percent, and in Highland Park it was 11 percent.

In total, of the 213 communities in Southeastern Michigan for which long-term poverty data was available there were only 10 that experienced a decrease in the percentage of individuals between the ages of 18-64 living in poverty between 2000 and 2015. On the opposite side of the spectrum, there were 27 communities where the percentage increase of individuals in poverty was at 10 percent or above; less than 10 of those communities were outside the direct Detroit suburbs.

Percent in Poverty Level Changes 2010-2015

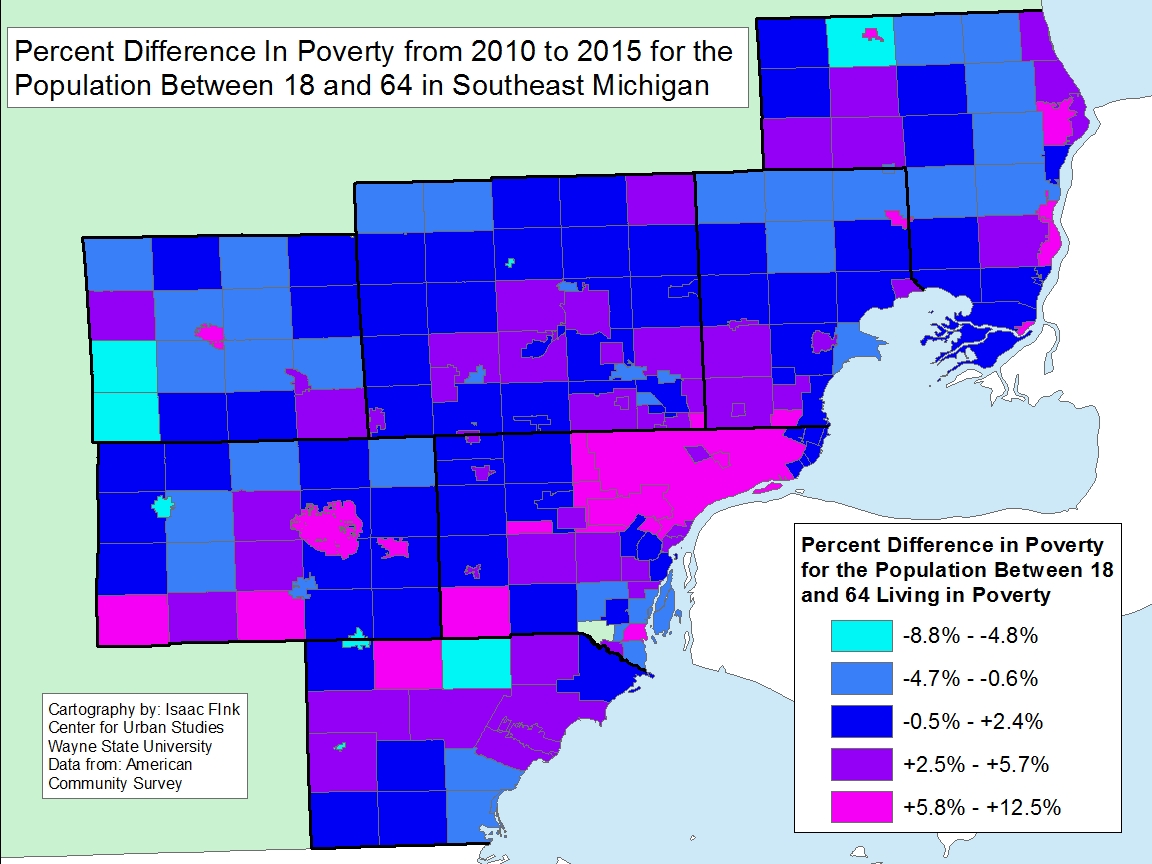
Finally, we examine the change in the percentage of individuals between the ages of 18-64 in poverty between the years 2010 and 2015 the data shows that the highest increases occurred in the more rural areas of the region. For individuals between the ages of 18 and 64 the city of Richmond had the highest percentage increase of residents living in poverty at 13 percent. Ypsilanti and the City of Yale both had 12 percent increases. London Township and Port Huron Township were the only other two communities in Southeastern Michigan where the percentage increase of the individuals between the ages of 18-64 was above 10 percent. The City of Detroit experienced a 7 percent increase and Highland Park experienced a 3 percent increase in the percentage of individuals between the ages of 18-64 who lived in poverty between the years 2010 and 2015.

Between 2010 and 2015 there were 58 communities in Southeastern Michigan where the percentage of individuals living in poverty decreased. The City of Unadilla had the largest decrease at 9 percent. None of the communities that experienced a decrease in the percentage of individuals between the ages of 18-64 were an inner-ring suburb of Detroit. The communities with decreases in poverty levels around 5 percent and above were located on the more outer edges of the region.

While the data shows that poverty levels have continued to increase for majority of the communities across the region, there are signs that the growth of poverty levels are decreasing. Between 2010 and 2015 there was a smaller number of communities who experienced an increase in poverty levels than between 2000-2010 or 2000 to 2015. The data comparing 2010 and 2015 levels also shows the percentage of poverty levels decreasing above 6 percent in certain communities, a statistic that was not achieved in the 2000 to 2010 comparisons and the 2000 to 2015 comparisons. However, the data does indicate that long-term poverty level growth appears to have been primarily concentrated in Detroit and its inner-suburbs. The more recent poverty data though (2010-15) shows that higher poverty levels are also being seen in the more rural areas.

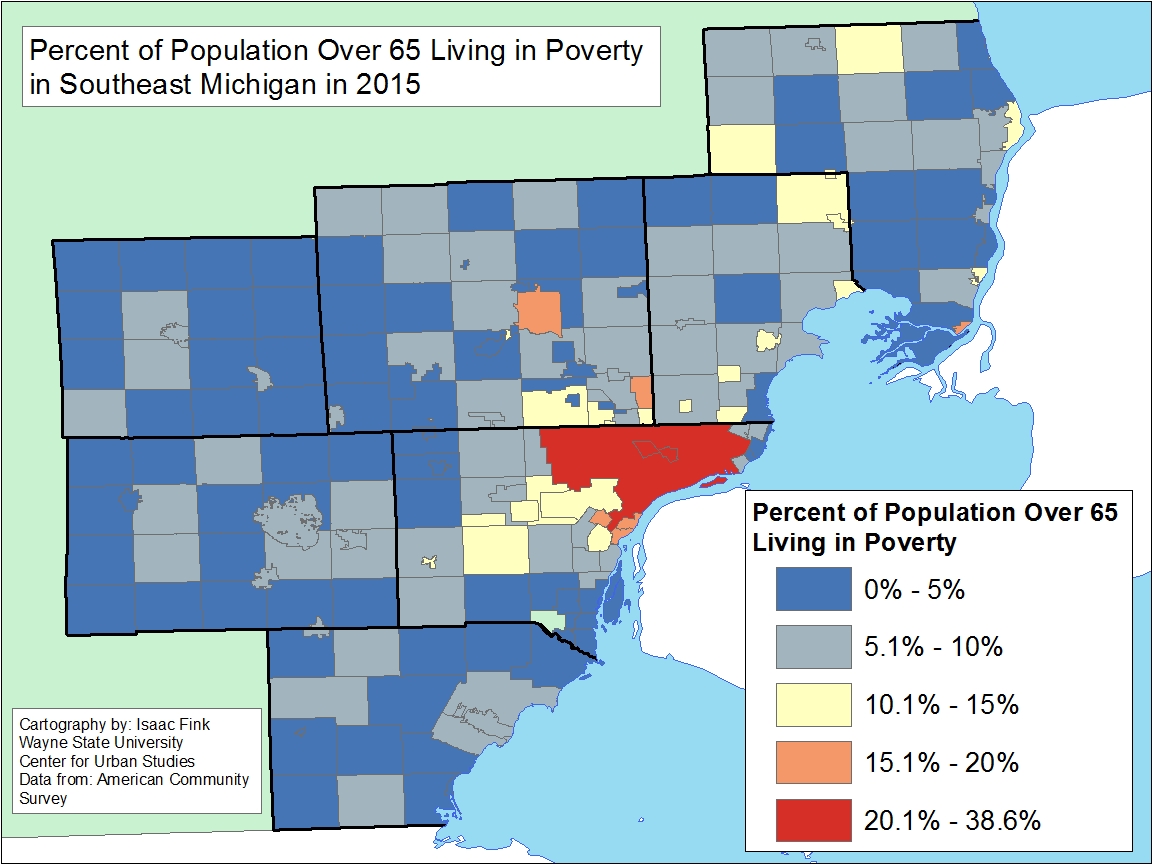
Next week we will view how poverty levels are affecting the elderly population.

Highland Park has Highest Poverty Rate in Southeastern Michigan

In 2015, the highest levels of poverty were concentrated within the City of Detroit and its inner-ring suburbs, according to data from the U.S. Census Bureau. Highland Park, which is surrounded by the City of Detroit, had the highest percentage of residents aged 18 or older living at our below the poverty level at 44.7 percent. In Hamtramck, 28 percent of the adult were living below the poverty level in 2015, and in the City of Detroit, 25.5 percent of the adult population was living below the poverty level.

In 2015, according to the U.S. Department of Health and Human Services, the poverty threshold for an individual was an annual earning of $11,770 and for a family of four it was $24,250.

When breaking down the adult population into two groups, those between the ages of 18-64 and those above the age of 65, Highland Park and Hamtramck, respectively, again had the highest poverty percentages. In Highland Park, 46.1 percent of the population between the ages of 18 and 64 lived at or below the poverty level, and 38.6 percent of the population above the age of 65 lived at or below the poverty threshold. In the City of Hamtramck, 41.7 percent of the population between the ages of 18-64 lived at or below the poverty level, and 30.7 percent of those above the age of 65 lived at or below the poverty level. In Detroit, 37.5 percent of the residents between the ages of 18-64 lived at or below the poverty level in 2015, and 20.4 percent of those above the age of 65 lived at or below the poverty level.

On the opposite end of the spectrum, there were 134 communities in Southeastern Michigan (of the 214 total municipalities) where less than 10 percent of those between the ages of 18-64 lived at or below the poverty level. Additionally, there were 175 communities in the region where less than 10 percent of those above the age of 65 lived at or below the poverty level.

The communities with the lowest percentages of their adult populations living at or below the poverty level were primarily concentrated in the western area of the region, with several being located in Washtenaw County.

While the highest poverty levels were concentrated around the City of Detroit, poverty levels across the region have increased. This data will be explored next week by comparing Census poverty level data for the years 2000, 2010 and 2015.

Bloomfield Hill’s Median Income Ranks Top in Southeastern Michigan

In Southeastern Michigan the average median income was $50,750 in 2015, according to the American Community Survey. Of the seven counties in the region, Wayne County had the lowest median income at $41,210 while Livingston County had the highest at $75,200. Although Livingston County had the highest median income in the region it was Oakland County that had the most number of communities with median incomes above $100,000. In total, there were 12 communities in Oakland County with median incomes above $100,000 and the city of Bloomfield Hills had the highest median income, both county and region-wide, at $172,768.

Income disparity is a growing issue at the national and local levels. In Michigan, this disparity is particularly exemplified due to the fact that the average hourly wage in the state has decreased from what it was a decade ago. According to a recent Crain’s Detroit article, the median hourly wage in Michigan in 2017 is $17.32 and in 2007 it was $18.67. In 2010 in Michigan, residents had a 46 percent chance of out earning their parents, according to a recent Stanford study, which is highlighted in the Crain’s article. The example in the article used to highlight this decline in wages is that in 1977 a newly employed high school graduate at General Motors was earning about $26 an hour (number adjusted with inflation) and today that wage is about $16. Other aspects that contribute to an individual’s economic mobility include access to jobs, particularly those with higher wages, and educational attainment.

In next week’s post we will see how median income has changed regionally since 2000 and 2010, further exploring the claim that upward mobility has declined.


Detroit’s Liquor Licenses Above 1,000

In the City of Detroit there are a total of 1,017 liquor licenses, which equates to about 15 liquor licenses per 10,000 people. A look at the Detroit map below shows that establishments with these licenses are located throughout the city, but patterns occur on major roadways, such as Gratiot and Woodward avenues, and in the larger business districts, such as the downtown area and up into Midtown. There is also a concentration of establishments with liquor licenses in Southwest Detroit.

In Michigan there are several types of liquor licenses which can be obtained, according to the Department of Licensing and Regulatory Affairs, which provided the data for this post. These include licenses needed to sell just beer, those need to sell beer and liquor at a golf course, a hotel, a bar and at a private event. Additionally, brewpubs, distilleries, wholesalers (both those in state and those out of state bringing goods in), winemakers, and stores selling beer and/or liquor need a license. All liquor licenses in the state of Michigan are issued by the Michigan Liquor Control Commission; each license (with the exception of special designated ones) can be transferred anywhere within the county in which the original license was issued.

For this post, there are maps of seven different communities, each one represents the community in each Southeastern Michigan county with highest number of establishments with liquor licenses per 10,000 people. The maps however are dot maps, showing the total number of establishments in each community. The regional map though, which is the first map shown below, represents the number of establishments with liquor licenses per 10,000 people. The per capita calculation was used to best show how many establishments there are per person, or in this case per 10,000 people, so the data could be comparable for each community in the region. Due to how the per capita rate is calculated (taking the old total number of establishments, multiplying it by 10,000 and then dividing that number by the total population) the rate often appears larger than the total number of establishments with liquor licenses.

While Detroit has the highest total number of establishments with liquor licenses in Southeastern Michigan, the village of Memphis has the highest total of liquor licenses per 10,000 people at 63. In total, Memphis, of southern St. Clair County, has 5 establishments with liquor licenses, most of which are concentrated in the downtown business district. The total population of Memphis about 800, a number that plays a role in its high number of liquor licenses per capita. Each community with the highest number of establishments with liquor licenses per 10,000 people in each of the seven counties has smaller population numbers, and of those other six communities The cities of Plymouth and Utica are the only two that have more than 20 establishments with liquor licenses. The city of Plymouth has 39 and Utica has 25 establishments with liquor licenses. The rate per 10,000 people for Plymouth is 44 and the rate for Utica is 53. Plymouth’s population is nearly double of Utica’s at about 9,000 people. The total number of establishments with liquor licenses and the per capita number for the other communities with the highest per capita in each county are:

  • Plymouth (city)-39 (total); 44 (per capita)
  • Uitca: 25, 53
  • Chelsea-19; 37
  • Village of Dundee-14; 35
  • Pinckney-7; 48
  • Clarkston—5; 54

In all of the maps featured below there are two common themes on where the establishments are located. Particularly in Plymouth and Utica, there is a concentration of establishments with liquor licenses in the centrally located downtown districts. In the smaller communities, such as Dundee or Clarkston, the establishments are located along major roadways in the community.

Throughout Southeastern Michigan there are 10 communities with more than 100 establishments with liquor licenses; all of these communities have populations of 75,000 or more. In terms of sheer volume, Ann Arbor has the second highest number of establishments with liquor licenses at 214, which is about 800 less than the number of establishments the City of Detroit has.

According to a study by the Pacific Institute, a high concentration of liquor stores holders can may be related to several public safety and health problems, ranging from high rates of alcohol related hospitalizations, to pedestrian injuries, to high levels of crime and violence. According to data from the Federal Bureau of Investigation we know that Detroit’s violent crime rate was 1,749 per 100,000 residents in 2015 (the most recent data available) and the city’s property crime rate was 4,070, while the state of Michigan’s violent crime rate was 415.5 per 100,000 residents and its property crime rate was 1,889. In Ann Arbor, the violent crime rate was 192 in 2015 and the property crime rate was 1,991.

Vacancy Rates in Detroit Remain Stagnant

In the City of Detroit in September 2016 the total percentage of vacancies was 21.9 percent, according to the U.S. Postal Service. This vacancy percentage was nearly unchanged from the 22 percent total vacancy rate the U.S. Postal Service reported in June of 2016. Similarly, when looking at the percentage of residential vacancies and business vacancies in the City these too nearly went unchanged between June and September. The U.S. Postal Service reports that the September 2016 residential vacancy rate was 22.4, down 0.1 percent. The September 2016 business vacancy rate was 25.9, up .02 percent from June.

Overall, in the month of September there were 87,762 reported total vacancies, 80,002 of which were residential, 7,670 of which were businesses and 104 of which were considered “other.” Between June and September, the total 0.1 percent vacancy decrease was equivalent to a decrease of 579 vacant addresses; there was a decrease of 641 vacant residential addresses and an increase of 62 vacant business addresses.

The first two maps below show, by Census Tract, the total number of vacancies and the total percentage of vacancies. The Census Tract with the highest number of total vacancies is on the east side, just north of Belle Isle. This Census Tract had 906 vacancies, which was 50.6 percent of the total number of structures in that Census Tract.

As the first map shows, majority of the Census Tracts with vacancies above 400 were located either on the cities east side, or just west of the downtown area of Detroit. When looking at the total percentage of vacancies in Detroit by Census Tract we see there is a slight shift in which Census Tracts have among the highest amount of vacancies in terms of percentage versus total numbers. This is directly related to the total number of structures in each Census Tract. For example, just east of Hamtramck there is a Census Tract with 229 vacant addresses, a number that does not put in amongst the Census Tracts with the highest vacancy numbers. However, these 229 vacant addresses in that Census Tract mean there is a 42.9 percent vacancy rate. Just south of that Census Tract is another where there are 307 vacancies which make up 18 percent of the structures there.

slide4

slide5

When comparing the total number of vacancies between September 2015 and 2016 we see that there are several Census Tracts that experienced an increase in the total number of vacancies. It was a Census Tract just north of Highland Park that experienced the greatest increase at 7.8 percent. Vacancy increases over the last year occurred the most on the City’s east side, however they were not isolated there.

Overall, while there were Census Tracts with vacancy rate increases there was a total decrease of 5,446 vacant addresses between September 2015 and September 2016.

In addition to these changes, in September of 2016 there was a decline in the number of “no stat” addresses; that number decreased by 2084 in the last year. Mail carriers denote properties as being either “vacant” or “no-stat.” Carriers on urban routes mark a property as vacant once no resident has collected mail for 90 days. Addresses are classified as “no-stat” for a variety of reasons. Addresses in rural areas that appear to be vacant for 90 days are labeled no-stat, as are addresses for properties that are still under construction. Urban addresses are labeled as no-stat when the carrier decides it is unlikely to be occupied again any time soon — meaning that both areas where property is changing to other uses and areas of severe decline may have no-stat addresses.

slide7

USPS: Detroit’s Vacancy Rate at 22.5%

There were 2,363 fewer vacant Detroit residential properties between June 2015 and June 2016, according to the U.S. Postal Service. Between March 2016 and June 2016 the number of residential vacancies decreased by 1,282. Overall in the month of June of 2016 there were 80,643 vacant residential addresses, which is equivalent to a 22.5 percent residential vacancy rate, according to the U.S. Postal Service. Also, for June 2016 the total number of residential addresses decreased by 4,630 from June 2015 and by 2,030 from March 2016.

Although there was a decrease in the number of vacant addresses, the percentage of vacant addresses in Detroit has remained in the 22.5-22.9 percent range since June of 2015. The data presented below shows that residential vacancy rates have experienced an overall increase since September 2012, when the U.S. Postal Service reported Detroit’s residential vacancy rate was 21.9 percent. However, there has been a decrease since March of 2015 when there was a peak residential vacancy rate of 23.5 percent. While the residential vacancy rate in Detroit has increased since September 2012 the number of residential addresses has experienced an overall decline of 6,441. The decrease occurred while the total of number of vacant residential addresses increased by 1,026 in the same time period (going from 79,612 in September 2012 to 80,643 in June 2016) . However, similar to the vacancy rate, the total number of vacant Detroit residential addresses peaked in March of 2015 and has since started to decline.

In addition to these changes, in June of 2016 there was a decline in the number of “no stat” addresses; that number decreased by 1,992 in the last year. Mail carriers denote properties as being either “vacant” or “no-stat.” Carriers on urban routes mark a property as vacant once no resident has collected mail for 90 days. Addresses are classified as “no-stat” for a variety of reasons. Addresses in rural areas that appear to be vacant for 90 days are labeled no-stat, as are addresses for properties that are still under construction. Urban addresses are labeled as no-stat when the carrier decides it is unlikely to be occupied again any time soon — meaning that both areas where property is changing to other uses and areas of severe decline may have no-stat addresses.

The maps below demonstrate both the overall Detroit address vacancy rates (including residential and business vacancy rates) by Census Tract for June 2016 and the change in vacancy rates between June 2016 and June 2015. In total, there were about 70 Census Tracts in Detroit with total vacancy rates above 33 percent. The Census Tract with the largest increase in its vacancy rate between June 2015 and June 2016 was located in Southwest Detroit and had a total vacancy rate increase of 11.1 percent.

slide3 slide4 slide5 slide6 slide7

Percentage of Renters in Spike Across Southeastern Michigan

Southeastern Michigan followed a trend similar to that of the entire state between 2000 and 2014 in that majority of the region experienced up to a 50 percent increase in the percentage of renters between 2000 and 2014. Statewide there were 998 communities (about 65 percent of the state) that experienced an increase in the total percentage of renters, and regionally there were 154 communities (about 70 percent of the region). Both regionally, and in the state, the city of Grosse Pointe had the highest change in percentage of renters between 2000 and 2014 at 967 percent. According the U.S. Census Bureau the city’s percentage of renters increased from 2 percent in 2000 to 19 percent in 2014.

The data for this post is from the American Community Survey (ACS) and the Census. The 2014 data is ACS and provides the total estimate of houses in the county subdivision, how many were owner-occupied and how many were renter-occupied. The margin of error ranges from 1,919 to 5 units. The 2000 data is from the Census and provides a sample of each county subdivision, along with the number of owners and renters in the sample. No margins of error were provided. For both 2000 and 2014, the percentage of renters was calculated and then used to determine the change between 2000 and 2014.

pct_chng_renters (1)

pct_chng_renters-Semcog (1)

The three communities in the state, and regionally, with the highest percentage increase in renters between 2000 and 2014 were located in Southeastern Michigan. With the city of Grosse Pointe at the top, the city of Memphis in Macomb County came in second and Pittsfield Township in Washtenaw County came in third. Between 2000 and 2014 Memphis experienced a 746 percent increase in renters and Pittsfield Township experienced a 643 percent increase.

In Wayne County there were four communities where there was more than a 100 percent increase in the amount of renters between 2000 and 2014. Those communities were Grosse Pointe, Gibraltar (232%), Dearborn (118%) and Redford (115%). The city of Detroit experienced a 29 percent increase in the percent of renters in that time frame. According the Census data, the percentage of renters in Detroit in 2000 was 38 percent and in 2014 that number increased to 49 percent.

While majority of the region experienced an increase in the percentage of renters between 2000 and 2014 there were several that experienced a decrease. As shown on the map, in Southeastern Michigan many of those communities were the rural ones located in Washtenaw County. There were 15 communities in Washtenaw County that experienced a decrease in the percentage of renters; those decreases ranged from 1 percent to 87 percent. York Township experienced the 87 percent decrease, going from a 67 percent rental rate to a 9 percent rental rate in 2014.

Both regionally and across the state, Detroit had amongst the highest percentage of renters in 2014 at 49 percent. The city of Ypsilanti and Royal Oak Township both had the highest percentage of renters in the state of 68 percent. Royal Oak Township experienced a decrease in the percentage of renters between 2000 and 2014, going from 83 percent to 68 percent. The city of Ypsilanti though experienced an increase from 40 percent to 68 percent.

The fact that the percentage of renters across Southeastern Michigan and the state as a whole has increased further solidifies our previous assessment that the cost of rental units is increasing due to the demand in the number of people seeking such units. Much of this increase in demand is driven by households forced into the rental market by foreclosure. As such, former homeowners are often simply renting units that were occupied by homeowner just months before. Should the demand for rental units continue to increase as these former homeowner units (often single family dwellings) are absorbed, new construction of apartments could increase density, allowing for more units to be built. However, this option may require changes in zoning regulations and support from the local communities.

CENSUS: Median Housing Values Decline in Southeastern Michigan

According to American Community Survey (ACS) data, median housing values throughout Southeastern Michigan declined between 2010 and 2014. These results are based on residents’ estimates of the value of their homes. They also contrast with more recent reports based on the Case-Schiller Index of actual sales.

The city of Algonac in St. Clair County had the largest median housing value decrease during that time period at 48 percent; the reported 2014 value was $102,500 and the reported 2010 value was $195,800. Hamtramck and Redford Township came in second for the median value decreases throughout the region at 44 percent. For Hamtramck, the ACS reported the median housing value was $39,800 in 2014 and in 2010 the median value was reported at $73,700. In Redford Township the median housing value was reported at $63,900 in 2014 and $118,500 in 2010. Both of these communities are located in Wayne County, which had the largest overall median housing value decline of the seven counties in the region at 28 percent. On the other hand, Washtenaw County had the lowest percent decline in median housing value between 2010 and 2014 at 10 percent. In Washtenaw County there were nine communities with a median housing value decrease of 5 percent or less. In addition, the city of Dexter experienced a 3 percent median housing value increase, from $216,600 to $222,6000. In Oakland County, cities that experienced a housing value increase between 2010 and 2014 were Birmingham (1%) and Rochester (1%). Lake Angelus in Oakland County did not experience an increase or decrease; median housing values for this community remained at above $1 million for both years.


Of all the communities in Southeastern Michigan, Lake Angelus also had the highest reported median housing value in 2014 at above $1 million (the Census does not specify above $1 million). River Rouge on the other hand had the lowest reported median housing value $36, 800.

medhousval

In recent Drawing Detroit posts, and throughout the media, increases in median housing values have been reported in 2015 and 2016. The data displayed in this post shows a contrary picture for 2010 through 2014. This, in part, may be based on perception as the housing values used in the ACS are based on respondents’ estimates of how much their property would sell for at that time. As we continue to explore housing questions in upcoming posts another question to now be addressed will be why there are different reports on the state of housing values and why, and if, there is in fact a perception that homes are worth less than in 2010 when the rebound from the economic crisis was moving at a much slower pace.

Oakland County has Largest Decrease in Foreclosure Filings

Between 2010 and 2014 foreclosure filings throughout Southeastern Michigan dropped between 77 to 87 percent, depending on the county. Oakland County experienced the largest decrease in foreclosure filings in the region at 87 percent and St. Clair County experienced the smallest decrease in the region at 77 percent.

The data used for this post was provided by RealtyTrac.com, a company which tracks and provides comprehensive housing data by gathering such information from parcel level records. The foreclosure data examined here is based off of the total number of properties that received at least one foreclosure filing during that year. Foreclosure filings can include a Notice of Default, a pending lawsuit filing, a Notice of Trustee Sale, a Notice for Foreclosure Sale and/or a Real Estate Owned foreclosure filing.

Wayne County had the highest number of filings in Southeastern Michigan, both in 2014 and 2010. In 2014 there were 6,259 filings and in 2010 there were 36,704. The number of foreclosure filings in 2014 in Wayne County accounted for .76 percent of the county’s housing units and in 2010 the number of foreclosure filings accounted for 4.38 percent of the County’s housing units. Overall there was an 83 percent decrease in the number of foreclosure filings between 2010 and 2014 in Wayne County.

On the opposite end of the spectrum Livingston County had the lowest amount of foreclosure filings in 2014 at 347. In 2010 though Monroe County had the lowest number of foreclosure filings, according to Realtytrac.com at 2,361.

Michigan Foreclosure Filings

Michigan Foreclosure Filings 2010-2014

Although Wayne County consistently had the highest number of foreclosure filings in the region between 2010 and 2014 it did not always have the highest percentage of housing units for which foreclosures were filed. For example, in 2010 4.55 percent of Macomb County’s housing units had at least one foreclosure filing; that percentage was 4.38 for Wayne County. Of the five years examined here, 2012 was the only year when Wayne County had the highest percentage of its housing units with at least one foreclosure filing; that number was 2.57 percent.

Unlike Wayne and Macomb counties, Washtenaw County regularly had the lowest percentage of housing units between 2010 and 2014 with at least one foreclosure filing. In 2010 the percentage of housing units with at least one foreclosure filing was 2.38 and by 2014 that number in Washtenaw County decreased to 0.47.

Foreclosure Filings Housing

In 2010 Oakland County had 20,445 foreclosure filings and in 2014 that number dropped to 2,682, meaning there was 87 percent decrease in the number of foreclosure filings there. This percentage decrease in the number of filings was the greatest in the region. The 20,445 foreclosure filings in 2010 for Oakland County were equivalent to 3.89 percent of Oakland County’s housing units and the number of foreclosure filings in 2014 for Oakland County was equivalent to .51 percent of the housing units. According to the Oakland County Treasurer’s Office, in 2014 834 properties were offered up for for tax auction by the county and in 2010 that number was 909 (2012 was the highest recent number for Oakland County at 1,651).

St. Clair County had the smallest percentage decrease in the number of foreclosure filings between 2010 and 2014. In 2010 Realtytrac.com reported there were 2,493 foreclosure filings and in 2010 that number decreased to 569. The 2010 number of foreclosure filings in St. Clair County was equivalent to 3.4 percent of the housing units there and the 2014 number was equivalent to .79 percent.

Michigan change in foreclosure filings

Overall, we see that there has been a very substantial decline in foreclosure filings in Metro-Detroit. However, the number of foreclosure filings in 2010 may still be having an affect on today’s current rental market. Foreclosure is damaging to an individual’s credit score, making it more difficult to take out lines of credit, which can affect an their ability to purchase a home. With foreclosure filings ranking in the thousands in each county for at least a few years, it is likely that at least a large share of people whose properties were ultimately foreclosed went to seek rentals. This would mean the total number of renters in the region would have increased, which could lead to an increase in rental demand, particularly if the number of rental units did not increase. The topic of rental demand as it relates to the percent of renter occupied units and the number of rental units available will be explored in upcoming posts as we continue to explore housing issues, particularly those related to increasing rental costs, in Southeastern Michigan.

Rent Costs Increase throughout Michigan between 2000-2014

In 2014 there were 122 different communities in the state of Michigan with gross median rental costs above $1,000; Bloomfield Hills topped this list with a gross median rent price of $2,001. Despite this community being at the top of the median gross rental cost list for the state it experienced a 5 percent median rental price decrease between 2000 and 2014. On the opposite end of the spectrum, in 2014 there were 72 different Michigan communities with median gross rental prices under $500 a month; Rose City in Ogemaw County had the lowest gross median rental cost at $294 per month. Like Bloomfield Hills, Rose City also experienced a decrease in its median gross rental cost between 2000 and 2014. However, for Rose City that decrease was much greater; there was a 50 percent median gross rental cost decrease between 2000 and 2014.

On a national basis, in 2014 the gross median rental cost was $920 and 41 percent of rental units throughout the U.S. had a gross median rental price above $1,000; 12.1 percent of the rental units in the U.S. had gross median rental costs below $500.

For this post, data from the year 2000 is from the decennial census while the 2014 data is from the 5 year American Community Survey. Additionally, when comparing gross median rent data between 2000 and 2014 (as seen in the second map) the 2000 rent prices were adjusted to reflect 2014 dollars so a more accurate reflection of the changes could be presented.

Gross rent is defined as the monthly amount of rent plus the estimated amount of utilities and fuel.

MedGrossRent2014

The map above shows the range of median gross rental costs throughout the state of Michigan in 2014. Looking at the highest bound of rents–$1,275 and there were 20 communities throughout the state, 13 of which were located in Southeastern Michigan and seven of which were located in Oakland County. Of those in the region, two were located in Wayne County-Grosse Pointe Shores and Grosse Pointe Farms. As noted, there were over 100 communities with gross rental prices above $1,000 in Michigan in 2014.

Regionally, there were also five communities on the lower end of the spectrum, with gross median rental costs below $625. The city of Highland Park was the only one located in Wayne County, with a gross median rent of $624. The city of Center Line had the lowest gross median rental cost in the region at $492.

The city of Detroit had a gross median rental cost of $756 in 2014. This was in the 42 percentile of gross median rental prices throughout the state. Detroit’s gross median rental cost was higher than more than 50 percent of the other communities in the state.

ChangeRent00to14

In total, there were 80 Michigan communities with gross median rental price increases above 50 percent between 2000 and 2014 (These are the communities for which there was full data for comparison). Of those 80 communities, four were located in the Southeastern Michigan region, two of which were located in Oakland County. Of those communities, Orchard Lake Township had the highest percentage change in gross median rent at 117 percent. In 2014 the gross median rent in the township was $1,909 and in 2000 (in adjusted 2014 numbers) the gross median rent was $879 ($635 in 2000 dollars).

Cross Village Township in Emmett County had the largest overall gross median rental cost increase between 2000 and 2014 (in 2014 dollars) at 132 percent. In 2014 the gross median rental price in the township was $915 while in 2000 the price (in 2014 dollars) was $415 (equivalent to $300 in non-adjusted 2000 dollars). It should be noted though that this Lake Michigan town had a population of 294 in 2014, meaning that a small number of large increases in rent could produce the large reported change in the median.

Of the 27 communities in Michigan with a decrease in gross median rental costs between 2000 and 2014 for which full data was available for comparison, only two were located in Southeastern Michigan. These communities-Rose and Sylvan Lake townships in Oakland County and Deerfield Township in Livingston County-experienced rental rate decreases at 1.5 percent, 2.7 percent and 25 percent, respectively.

Between 2000 and 2014 the city of Detroit’s gross median rental cost increased by 12 percent. Detroit’s gross median rental cost increase was higher than about 70 percent of the other Michigan communities between 2000 and 2014 (when comparing in 2014 dollars). While not depicted in either of the maps, it was reported on July 23 2016 by the Detroit News that the housing market in Downtown Detroit continues to soar, with average rents increasing more that 11 percent since 2011 in that area of the city. According to the article, the average monthly rent for a one bedroom apartment in Downtown Detroit is $1,359.

Overall, about 65 percent of the state’s cities or townships had gross median rental cost increases between 2000 and 2014, when dollars were adjusted for comparison. Various reasons may explain the overall increase in gross median rental costs (in comparable dollars) throughout the state, the most likely of which is greater demand. The 2008-2009 recession produced a large uptick in foreclosures, nationally and throughout the state. With this, many people were left looking for affordable rental units. With an increase in demand comes an increase in price. In a future post we will discuss the overall change in rental rates throughout Southeastern Michigan between 2000, 2010 and 2014, but according to the U.S. Census Bureau we do know that on a national basis the recession produced a greater demand in rental units. Since gross median rent also includes the estimated cost of utilities and fuel, increases in energy costs overtime are also likely contributors to the overall increase.