UAW Strike Impacts and What it Could Have Meant

Just over seven weeks ago United Auto Workers (UAW) members who work for Ford, General Motors (GM) and Stellantis across the US strategically went on strike. The strikes began because the UAW workers have been fighting for better wages, including a restoration of cost of living pay raises, improved pension plans and additional benefits. As is noted later in this post, inflation continues to occur in Michigan, and throughout the country, and for example, 36 percent of Detroit residents earn a living wage, according to a University of Michigan Economic Outlook report.

As the number of UAW facilities on strike expanded over the last six weeks so did the states where the facilities are housed. Not only has Michigan been impacted by the strikes but also California, Colorado, Kentucky, Illinois, Indiana, Kansas, Georgia, Tennessee, Florida, New York, Kansas, Massachusetts, Minnesota, Missouri, Ohio, Oregon, Texas, Virginia, West Virginia, Pennsylvania, Nevada, North Carolina and Wisconsin. With all of the Big Three having UAW employees on strike, this marks the first time this has occurred since at least 1960 during a contract negotiation year.

Now, while tentative agreements between the UAW and Ford, GM and Stellantis are moving toward ratification impacts from the strike, and the new ratified contracts, are sure to be felt. According to CBS Detroit,  UAW employees of the Big Three will experience wage increases of 25 percent over the life of the contracts, along with items such as the restoration of cost-of-living allowances, the elimination of some wage tiers, increased 401K contributions and more. As these new tentative contracts make their way toward becoming reality for thousands of Big Three employees (voting and ratification still needs to occur), other automotive companies appear to be eyeing, and responding, to the changes too. According to the Detroit Free Press, Toyota recently announced they would be boosting wages by 9 percent and reducing the time it takes for workers to get to top wage; this will become effective Jan. 1.

With increased wages and improved wages coming down the pipeline soon for UAW employees, which should also have a positive affect on the overall economy, it should also be noted the financial impact the UAW strike has had.  According to the Anderson Economic Group, LLC., the costs of the UAW strike reached $10.4 billion in its sixth week, with wage losses of Original Equipment Manufacturers workers being $650 million, losses to the Big 3 Manufacturers being estimated at $4.3 billion, lost wages and earnings to supplier companies and workers being estimated at $3.3 billion and loses to dealers, customers, and ancillary auto industry workers being estimated at $2 billion. With contracts still needing to be ratified, plants needing to reopen and several other housekeeping matters needing to occur, it is also projected that losses will continue for at least another short while.

Michigan, which is home to the highest number of UAW employees, was predicted to experience personal income loss for over 66,000 people if UAW workers at the Ford, GM and Stellantis all striked.  This prediction scenario was published in an Analysis of the Economic and Fiscal Impacts of Potential UAW Strike Scenarios  by the University of Michigan right before the strike. While not every UAW plant went on strike these early projections do show a more drilled down look at the impacts of UAW strikes. For example, the analysis estimated personal income loss by for Ford UAW employees for a one- or two-week strike could have resulted in a total employment loss of 28,000 jobs statewide (including the 22,000 striking workers). The total personal income loss for this period could have been $50 million by the second week. Following two weeks of strikes it was projected Ford the suppliers would also begin to feel the impact of the strike (which they did), and a month after striking, the University of Michigan projected 54,000 people could have been unemployed as a result of the Ford UAW strike in the state, with a cumulative personal income loss of $150 million. Now, if the strike were to push to 8 weeks that unemployment number could grow to 105,000 total job losses in Michigan, along with a cumulative personal income loss of $610 million, according to the University of Michigan. For strikes longer than eight weeks, the total job loss for Michigan would likely remain at 105,000, but personal income losses would continue to accumulate.

This report, which was published before the strike, also hypothesized that a strike could also bring on a loss in tax revenue. According to the University of Michigan, a one-week strike could result in a loss of $1.8 million in state tax revenue. That number grows to $10.9 million for a four-week strike and $41.2 million for an eight-week strike.

While the above example sheds light on the impact a Ford UAW strike could have/had on the Michigan economy, similar effects were projected to occur with GM and Stellantis UAW workers strike too. According to the University of Michigan’s report, a one- or two-week strike at GM was projected to produce a total employment loss of 25,000 jobs (including the 20,000 striking workers), with a total personal income loss of $40 million by the second week and a $1.6 million loss in state revenue. If all UAW Stellantis employees went on strike, it was projected a one- or two-week strike could have produced a statewide total employment loss of 31,000 jobs (including the 25,000 striking workers), with a total personal income loss of $50 million by the second week. Additionally, a  one-week UAW Stellantis strike could have resulted in a loss of $1.9 million in state tax revenue, according to the University of Michigan report.

As noted, the above information is all based on simulation and speculation of all UAW workers at all three companies being on strike in unison. On Sept. 15 UAW union members were instructed to go on strike, but at targeted auto plants, and not all of them. Since then, as we know, the number of plants on strike has grown, but not every plant went on strike from day one.

As mentioned early, one of the items negotiated into the UAW contracts was cost of living increases, which are based on the rate of inflation. The charts below show the percent changes in the Consumer Price Index (CPI) on a month-to-month basis and a year-to-year basis for each month in years 2019, 2020, 2021, 2022 and 2023 in the Midwest Region. The CPI is a measure that examines the weighted average of prices of consumer goods and services, such as transportation, food, energy, housing and medical care. It is calculated by taking price changes for each item in the predetermined group of goods and averaging them.

The first  chart below highlights how the CPI changed on a month-to-month basis between 2019 and 2023. Currently in 2023, the region’s prices were up 0.2 percent in the month of August. The highlights for the change include:

•Overall, food prices declined 0.1 percent for the month of August. Prices for food at home fell 0.2 percent, while prices for food away from home (restaurant, cafeteria, and vending purchases) increased 0.2 percent for the same period.

•The energy index increased by 3.4 percent over the month, due almost entirely to an increased price in gasoline (6.7 percent). However, natural gas prices declined  (0.5 percent, as did prices for electricity (0.1 percent).

•Rent (+0.4 percent) and medical care (+1 percent) and apparel (+2 percent) also contributed to the increase in the month-to-month CPI increase.

When examining the second chart, which shows how prices changed on a year-to-year basis,  we see how prices remain higher than this time in 2019, 2020 and 2021 but not higher than 2022.

In August of 2023 the CPI was reported to be 3.4 percent above what it was the year prior. Contributing factors to the continued increase in the CPI include

•Food prices increasing 3.4 percent over the last year, with away from home food prices increasing 5.4 percent

•The cost of electricity decreased by 6.6 percent, with the 28.6 percent decline in the price of natural gas playing a large role in the overall decline

•Owners’ equivalent rent of residences increasing 6.9 percent and rent of primary residence increasing 7 percent 

•Recreation prices increasing 4.3 percent

With cost of living continuing to increase and wages and benefits often not keeping up and increased desires for improved work life balances other workers in Michigan and beyond are also striking. In Michigan, 3,700 casino workers went a strike just over a month ago, demanding increased wages, reduced work loads and job security. In Portland, Oregon more than 3,500 members of the Portland Association of Teachers went on strike for similar reasons. This strike has shut down the 81 schools in the Portland School District.

According to an August 2023 Gallup Poll report, labor unions continue to enjoy high support in the U.S., with 67% of Americans approving of them. This is down slightly from its 2022 approval rating of 71 percent but significantly up from its 2009 approval rating low of 48 percent.

Additionally, Gallop reports, and recent events solidify that Americans have become more likely than a to want unions’ influence to improve their work lives and that they benefit various aspects of business and the economy.

In Michigan, actions by the legislature show that Unions are gaining back strength. Legislation on its way to be signed by the Governor repeals the 2023 Right-to-Work law that essentially allowed union employees to opt out of payment.

Detroit’s Residential and Business Vacancies Decline

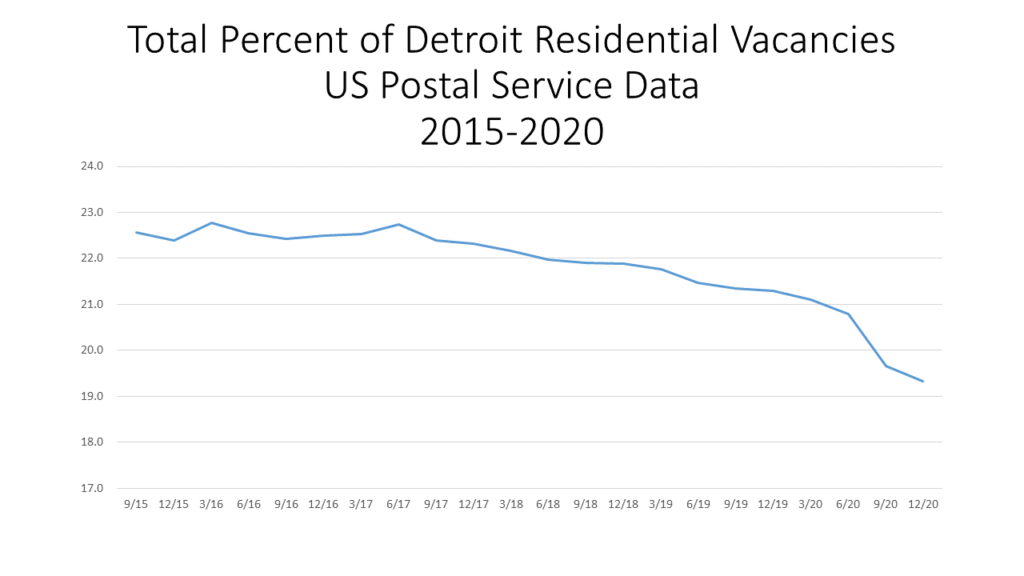
In December of 2020 the US Postal Service reported 74,313 total vacant properties in the City of Detroit, equivalent to a 19 percent vacancy rate. This rate is the lowest report rated since 2015, as can be seen in the first chart below. Additionally in 2020 the Postal Service reported 317,272 occupied addresses.

According to the first map below, while the overall vacancy rate in December of 2020 was 19 percent, there were several areas in the City with much higher rates. The highest rates were near I-96 and Gratiot Avenue in the City of Detroit, with the highest overall rate for a Census Tract being 52.3 percent in the Morningside/Chandler Park area. Conversely, vacancies remained the lowest in the Downtown Detroit area and Green Acres/Pembroke/Bagley areas. High vacancy rates in the City ranged from 31-52.3 percent and low vacancy rates ranged from 1.9 to 9.3 percent. Between September and December of 2020 the vacancy rate decreased by 0.3 percent. Additionally, the vacancy rate had an annual 2 percent decrease plus a 2.8 percent decrease over a five-year time period. The second map below shows the long-term trends; all but seven Census Tracts experienced a decrease in vacancy or little to no change between 2019 and 2020. The Chandler Park area had the highest increase in vacancy rates between December 2019 and 2020 at 3.5 percent.

The USPS provides aggregate vacancy and no-stat counts (see explanation below) of residential and business addresses that are collected by postal workers and submitted to on a quarterly basis the Department of Housing and Urban Development. While occupancy status is recorded, USPS does not capture any information about the nature of the vacancy or the address itself, other than whether it is a residential or business address. To the USPS, the address is either occupied and requires mail service or is vacant and does not. An address is deemed vacant if it did not collect mail for 90 days or longer. In addition to occupied and vacant addresses there are also “no stat” addresses. A “no stat” address is called that if it is under construction and not yet occupied or is in an urban area and identified by a carrier as not likely to be active for some time.

As noted, overall vacancy rates in the City of Detroit have been declining, and this also true at both the residential and business levels. Residential vacancy rates in September of 2015 were 22.6 percent, which was equivalent to 81,666 residential vacancies. By December of 2020 that number of vacancies decreased to 19.3 percent, or 67,442 total vacancies.

For business vacancies in December 2020 there was a total of  6,871 vacant businesses out of 28,438 total businesses in the City.  This was equivalent to 24.2 percent. In September of 2015 the vacancy rate was 24.6 percent for a total of 7,337 vacant businesses out of 29,885.

Examining both charts below we see that there has been a steadier decline in residential vacancy rates than business vacancy rates. Between 2015 and 2019 business vacancies were actually climbing, and reached a high of 28 percent in December of 2018. Then, through the pandemic declined substantially, though it is not clear why.

According to the USPS there was 27,878 “no stat” addresses reported in Detroit in December of 2020, an increase of 3,884 from the year prior.

Environmental Injustices Continue in Detroit

Environmental injustice occurs when certain populations, typically those who are marginalized, and the environment are both harmed from certain actions. We have seen this occur with the Flint water crisis and we continue to witness it right here in Detroit. While pollution can come in many forms, it is air pollution that we are focusing on in this post and what is at least one factor in Detroit’s environmental injustice.

Before we dive into some of the sources of Detroit’s air pollution it is important to understand Detroit’s socioeconomic makeup. With a population of about 620,000 residents, 78 percent of the population is black, nearly 25 percent of the population is under the age of 18 and 32 percent of the population lives in poverty, according to the US Census Bureau.

Furthermore, according to the University of Michigan School of Public Health it is estimated that air pollution kills more than 650 Detroiters a year, with thousands more being hospitalized and children missing a disproportionate number of days at school because of illnesses and asthma.

According to the 2021 update on the State of Michigan’s “Detroit: The Current Status of Asthma Burden,” the asthma rate of the in the City of Detroit in 2019 was four times higher than the State of Michigan’s rate. Additionally, there were 1,458 asthma hospitalizations of Detroit residents in 2019.

Between 2017 and 2019, 71 Detroit residents died due to asthma. The rate of asthma mortality among Detroit residents was 31.4 per 1,000,000 population. The rate of asthma mortality in Detroit in 2017-2019 was about three times the rate for Michigan as a whole.

Now, when further digging into asthma rates el, the “Detroit: The Current Status of Asthma Burden,” states that in 2019, the rate of asthma hospitalization among Detroit’s Black population was 31 per 10,000 while the rate among Detroit’s white population was 7.9 per 10,000.  Asthma hospitalization among Detroit Blacks were over three times that of Detroit whites. Michigan Blacks had over five times the hospitalization rate of Michigan whites.

According to the American Lung Association, the exact cause of asthma remains unknown, but there are certain factors that play a role in developing the disease. These factors include family history, allergies, viral respiratory infections, obesity, smoking, certain jobs and air pollution, especially including dust and mold.

As noted in our last post, there are several secondary particle pollution sources that have a negative impact on the area’s air quality in Metro-Detroit. According to climatetrace.org, a global non-profit organization that independently traces greenhouse gas emissions, some of the area’s highest emitters are an oil refinery, two steel plants, an airport and a powerplant. These emitters are:

Marathon Petroleum CO Detroit:

Ranked 378/80,188 Worldwide: for Carbon Dioxide emissions (CO2E)

Cleveland-Cliffs Dearborn Steel Plant

Ranked 296/80,188: for Carbon Dioxide emissions (CO2E)

Detroit Metropolitan Wayne County Airport

Ranked 917/80,188 for Carbon Dioxide emissions (CO2E)

Gerdau Monroe Steel Plant

Ranked 1,450/80,188 for Carbon Dioxide emissions (CO2E)

Monroe Michigan Power Plant (DTE)

Ranked 37/80,188 for Carbon Dioxide emissions (CO2E)

Other secondary sources that contribute to particle pollutants in the Metro-Detroit are the the Mistersky and River Rouge power plants, highways, the Ambassador Bridge and Stellantis manufacturing plants in Warren and on Detroit’s eastside.

The media has long reported the history of the Detroit’s 48217 ZIP code, which is located in Southwest Detroit. With the Marathon plant and the DTE Delray and Mistersky powerplants, along with nearby highways and international trucking routes (Ambassador Bridge and soon to be Gordie Hower International Bridge), the amount of air pollution in this area is at concerning levels.

According to a recent released by the University of Michigan School of Public Health, between 2016-2021 the major source of PM2.5 ( which is fine inhalable particles, with diameters that are generally 2.5 micrometers and smaller) in the area was “mobile sources of emissions,” or vehicle exhaust and construction equipment, at 40 percent. Industrial sources of emissions also contributed a “sizable” amount to the PM2.5 levels, but were on the decline due to recent closures of coal-burning power plants and other facilities in the area.

Another area of growing concern is Detroit’s eastside, where the Stellantis production plant has not only grown to two production lines, but the amount of traffic has also increased due to the addition of a logistics warehouse that services the Stellantis plant. As has been noted in this and previous air quality posts, high traffic and industrial areas are major factors in both environmental pollution and an individual’s health.

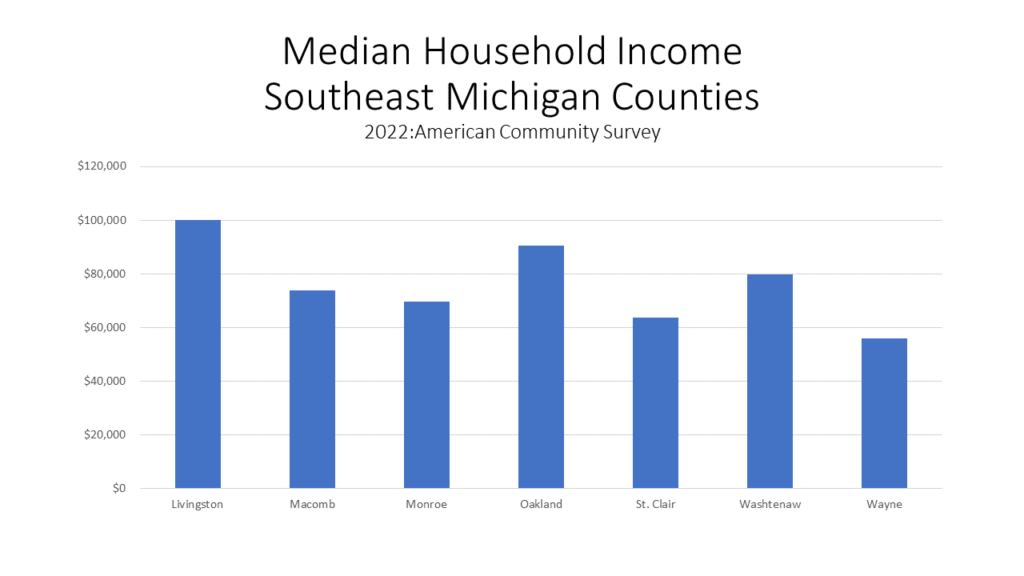
So, what we know thus far is that Detroit is a primarily a city composed of minorities, particularly African-Americans and Hiuspanics with a lower median income than neighboring communities in Southeast Michigan. We also know that in Detroit there are pockets of dedicated space for industry, whether it be manufacturing plants, power plants or other forms that push PM2.5 into the air. Poor air quality is not only a major concern for many Detroit residents, but also a reality. This type of environmental injustice has led to severe health problems for thousands of residents, both children and adults.

With strong regulations, from zoning to emission standards and even traffic regulations, we can work toward alleviating environmental injustices. However, as we continue to see at an increasing rate, pollution and other negative impacts on the environment have a long-lasting impact. Advocating for and taking steps to implement equitable solutions when it comes to housing, education and access to jobs is crucial.

Secondary Sources of Particle Pollution Affect Southeastern Michigan, Even After the Wildfire Smoke Clears

Michigan’s air quality has received a great amount of attention over the last several months. With wildfires still burning and winds bringing smoke into Southeastern Michigan, the region has had more than a dozen Ozone Action days. This increase in Ozone Action days has brought about increased attention to what poor air quality means for our health and what is causing the poor air quality. Smoke caused by increased temperatures and drought has caused wildfires in northern Michigan and Canada; the drought and increased temperatures are direct results of climate change. Climate change is caused by various factors, many of which are related to pollutants.

In this post we will further examine the air quality of Southeast Michigan and some of the factors behind it, particularly some of the region’s biggest polluters.

Of the seven counties in Southeast Michigan, three received an “F” grade for air quality from the American Lung Association in the 2023 State of the Air Report, and the other two that had enough information to be graded did not receive higher than a “C” grade.  These grades are based on the number of high ozone days in each county and the change in particle pollution from day-to-day and year-to-year.

Wayne, St. Clair and Macomb counties all received “F” grades for air quality in the 2023 State of the Air Report, with Wayne County have 11 “Orange Days” in 2022, St. Clair County having 10 and Macomb County having 16 “Orange Days.” According to the American Lung Association, when a county has an “Orange Day” that day is deemed “unhealthy for sensitive groups.” Additional colors in this ranking index include red for “unhealthy,” purple for “very unhealthy,” and maroon for “hazardous.” Benzie and Mason counties were the only two in Michigan to have red days.

Furthermore, according the American Lung Society’s State of the Air Report, the Detroit area was ranked the twelfth most polluted for year-round particle pollution.

Particle pollution is of serious concern because it negatively impacts individuals’ health, causing respiratory and cardiovascular problems and even premature death. According to the Centers for Disease Control, there are two sources of particle pollution, primary and secondary sources. Primary sources cause particle pollution on their own; wood stoves and forest fires are primary sources. Secondary sources let off gases that can form particles. These sources include power plants, factories, construction sites, vehicles and coal fires.

In Southeast Michigan there are several secondary particle pollution sources that have a negative impact on the area’s air quality. According to climatetrace.org, a global non-profit organization that independently traces greenhouse gas emissions, some of the area’s highest emitters are an oil refinery, two steel plants, an airport and a powerplant. These emitters are:

Marathon Petroleum CO Detroit:

Ranked 378/80,188 Worldwide: for Carbon Dioxide emissions (CO2E)

Cleveland-Cliffs Dearborn Steel Plant

Ranked 296/80,188: for Carbon Dioxide emissions (CO2E)

Detroit Metropolitan Wayne County Airport

Ranked 917/80,188 for Carbon Dioxide emissions (CO2E)

Gerdau Monroe Steel Plant

Ranked 1,450/80,188 for Carbon Dioxide emissions (CO2E)

Monroe Michigan Power Plant (DTE)

Ranked 37/80,188 for Carbon Dioxide emissions (CO2E)

These rankings and the acknowledgement of these assets on the Climate Trace map use data from 2021.

Other secondary sources that contribute to particle pollutants in the Metro-Detroit are the highways, the Ambassador Bridge and, most recently, Stellantis manufacturing plants in Warren and Detroit. Over the last several months, Stellantis has been fined over $500,000 for violating emission standards, according to Crains Detroit. Now, instead of trying to cut back on the emissions, Stellantis has submitted applications to the Michigan Department of Environment, Great Lakes and Energy to raise emission levels of volatile organic compounds and particulate matter at the Warren Plant and to raise the amount of permitted particulate emissions at the Detroit Plant.

It remains unknown what the State of Michigan will do with Stellantis’ requests, but the State and the federal government both need to enforce stricter emission standards, both the benefit of the environment and the population. Higher accountability standards are needed, as are means to produce power and products in ways that do not create greenhouse gases.


Various Populations At-Risk By Continued Poor Air Quality in Michigan

Ozone action season is upon us here in Southeast Michigan; it began March 1 and continues through the end of September. Ozone Action Days are declared when hot temperatures are expected to combine with pollution, creating high amounts of ground-level ozone. Ground level ozone, especially in excess, can cause a human health threat, particularly to vulnerable population. These vulnerable populations include children, those 65 years of age or older, those with asthma, COPD, cardiovascular disease, lung cancer and those who are pregnant.

In 2022 in Southeast Michigan there were five Ozone Action Days, according to the Southeast Michigan Council of Governments, or days when the public is asked to do less strenuous activities and to reduce the ways in which they may contribute to air pollution. While we were certainly hoping for zero Ozone Action Days in 2023, we have already had 14, due in large part to the smoke that has drifted to Southeast Michigan from the Canadian and Northern Michigan wildfires. The most recent Ozone Action Day in Southeast Michigan was declared on July 5, 2023 and the first of the season was declared on April 15, 2023.

With nearly triple the number of Ozone Action Days in 2023 compared to 2022, concerns of air quality remain a constant worry throughout Michigan, as does the population’s health, particularly our most vulnerable populations’. Each year the American Lung Association releases a State of the Air Report that examines air quality at the county, state and national levels and how it impacts certain populations. For the 2023 State of the Air Report, The American Lung Association had data on the vulnerable populations of Macomb, Oakland, St. Clair, Washtenaw and Wayne counties.

As the data shows, children (those under the age of 18) are the category with the highest percentage of individuals at risk. Of the five counties with such data available from the American Lung Association, between 18 and 24 percent of the populations are children, with Wayne County having the highest percentage and Washtenaw County having the lowest percent. The category of those 65 years of age or above had the second highest percentage of individuals at risk, with between 15 (Washtenaw County) and 19 percent (St. Clair County) of the population being at risk of health complications from high ground ozone levels.

Of the diseases/conditions that can contribute to health problems during Ozone Action Days, adult asthma was the most common among the counties in Southeast Michigan (between 9-10 percent of the populations in the counties had adult asthma). Of the child population in the region, each of the five counties discussed in this post had 7 percent of that population with childhood asthma.

For COPD, less than 7 percent of the populations in Macomb, Oakland, St. Clair, Washtenaw and Wayne counties had the disease, except for Wayne County where the American Lung Association reported 11.5 percent of the population had COPD.  Heart disease, lung cancer and being pregnant also cause increased health risks during high ozone days, and of those three categories heart disease had the highest percentage of individuals who could be impacted.

While we can’t control how and when wildfire smoke will drift through our region there are actions we can take to help lower the amount of particles in the air, in general, and especially during Ozone Action Days.

According to the Southeast Michigan Council of Governments, to help lower the amount of ground level ozone in the air we can:

  • Delay mowing your lawn until evening or the next day. Exhaust from a lawn mower and other gas-powered lawn and garden equipment help form ozone.
  • Drive less, telecommute, bike, or walk. This helps reduce traffic congestion and air pollution.
  • Avoid refueling vehicles during daylight hours. Fumes released at the gas pump contribute to ozone formation.
  • Delay or combine errands. This will reduce traffic congestion and air pollution.
  • Reduce electricity use.

With wildfires still burning in Canada, temperatures continuing to rise and air pollution still occurring in Southeast Michigan, it is likely the number of Ozone Action Days in Southeast Michigan will rise from 13. For some of our most vulnerable populations, summer days may be spent inside more often than expected, now and in the future. As noted in our previous post, the wildfires causing our most recent Ozone Action Days are related to climate change, which is creating hotter and dryer seasons.

And, while wildfires are impacting our air quality, so is pollution, which also is a driving factor in climate change. Two of the vulnerable populations we did not discuss in this post are those in poverty and certain minorities. We will further examine how these populations are impacted by not only air quality, but also pollution, in future posts as we have a larger conversation on environmental racism.

Michigan Air Quality Remains Poor, State at Risk of Increased Fires

As of 10 p.m. on Monday June 26, some places in Michigan had Air Quality Index (AQI) levels above 150, a level that is serious for even healthy people and can be dangerous for people with serious health conditions, according to PurpleAir.com. This website tracks hyperlocal quality throughout the country on a daily basis; to view current information click here.

The poor air quality in Michigan, currently, is a result of massive fires in Canada, particularly Quebec, with smoke drifting down into Michigan.

But Michigan is also facing a substantial increase in wildfires of its own. And it could get worse.

The average number of fires per year in Michigan is 337, according the Michigan DNR, and halfway through 2023 the state is on pace to exceed that average with 238 fires having already been reported. According to the Michigan Department of Natural Resources there have been 205 total fires in Michigan’s lower peninsula in 2023, as of June 26, 2023, and 33 in the upper peninsula.

There are several reasons for fires, which include everything from lightening (279 since 2006) to fireworks (53 since 2006) to debris burning (1553 since 2006) and more. But one common factor amongst many fires is a dry environment that allows sparks to turn into flames and flames, in some cases, into raging fires. As of June 26 of this year, 2,532 acres of land had been burned by fires in Michigan; the average number of acres burned by fires in Michigan in June is 270. The Wilderness Fire Trail in Crawford County, which was started by a bonfire, burned more than 2,000 acres of land in June, according to the Associated Press. This wildfire contributed to the above average number of acres burned by fire in 2023. Michigan wildfires also drew attention in May, with more than three dozen being reported, according to Bridge Magazine. The cause? Drier than usual weather. According to the National Integrated Drought Information System, May of 2023 was the ninth-driest May in Michigan since the federal government began keeping records in 1895.

With summer just beginning, we are nowhere near being out of fire season. According to the US Drought Monitor, created by the University of Nebraska-Lincoln, much of Michigan is at least abnormally dry, as of June 22, 2023. The western portion of the Upper Peninsula and about a third of the Lower Peninsula (the thumb and the top of the “mitten”) have been deemed “abnormally dry,” and nearly all the remaining portion of the “mitten” (including Wayne County) have been deemed “moderately dry.” There is also an area in mid-Michigan that has been deemed to be in a severe drought; the eastern portion of the Lower Peninsula has no drought conditions.

With drier conditions being a factor in increased fires across the state of Michigan, we must also touch on what is behind the drier conditions. Climate change, driven by increased emissions, pollution and more, can be dubbed as the main culprit behind increased drought conditions in certain areas (and increased drought in other areas, but that is for another day).

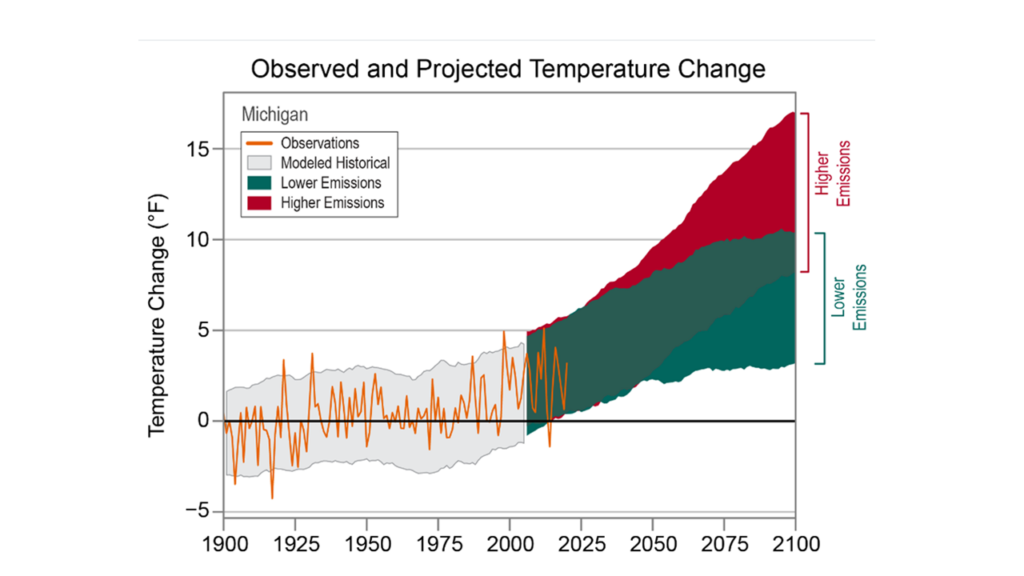
In Michigan, average temperatures have already risen 2.5 degrees, with summers being hotter and heatwaves being stronger. Fast forward to 2100, summers in Isle Royale National Park, for example, are expected to be 11 degrees hotter, according to statesatrisk.org.

The chart below shows just how Michigan’s annual daily temperatures have changed since 1900 and how they are expected to change up to 2100, depending on the amount of emissions we continue to pump into the environment (Southeast Michigan has several high emission emitters, as will be discussed in detail in a future post). The observed data is through 2020 and shows that Michigan’s average temperature has increased by nearly 3 degrees (Fahrenheit) over time. According to the data set from The Cooperative Institute for Satellite Earth System Studies and the National Oceanic and Atmospheric Administration (NOAA), even with lower emissions temperatures are expected to increase in Michigan by a minimum of 3 degrees through 2100. That number could increase to at least 12 degrees though if the emissions we produce increase.

With climate change having a direct impact on our environment, it is also having a direct impact on our lives. We know drought can be catastrophic to crops, our food systems and the economy and we know fires cause destruction. It should also be known that fires also have a direct impact on air quality, which affects the lives of all of us.

Next week we will dig into how Michigan’s air quality ranks and how the fires in Michigan, and beyond, have making it much worse in recent weeks.

Southeast Michigan’s Poor Air Quality a Result of Climate Change

Air quality in Southeast Michigan has been notably poor in recent weeks, with three Ozone Action Days occurring in June thus far. According to the Southeast Michigan Council of Governments, Ozone Action season began on May 1 in Southeast Michigan. This year is the 30th year of the voluntary program that helps keep Southeast Michigan’s air clean. In 2022, there were five Ozone Action days.

As we’ve discussed in previous posts, clean air is vital to healthy populations, and in Southeast Michigan clean air has been hard to come in recent weeks. The Canadian wildfires have been the easy culprit to blame for the poor air quality, the real root of the problem goes much deeper….climate change.

Wayne State University Center for Urban Studies Director Lyke Thompson further dives into what is causing poor quality in Southeast Michigan in this recent opinion piece published by the Detroit Free Press.

Signs Show Evidence of an Economic Slow Down in Michigan

Michigan is not experiencing a deep recession but there are signs that the economy is beginning to slow down. From unemployment rates to the cost of housing, the signs of a recession are evident, and according to presentations given at the Detroit Economic Club on April 13, a recession will likely start this summer.

One telltale sign of a slowing economy is an increased jobless rate. In Michigan, the unemployment rate has remained steady, and amongst recent lows, since June of 2022 though. In February of 2023 the state unemployment rate was reported at 4.3 percent. According to the Michigan Department of Technology, Management and Budget, layoffs are occurring though. In through March of 2023, 14 companies sent notices of layoffs or closure notices, or Worker Adjustment and Retraining Notifications (WARN). These 14 companies sent a total of 2,112 notices, with Prospect Airport Services in Detroit sending the most at 516. Comparatively, by the same time in 2022 six companies sent layoff notices and in 2021 three companies had sent layoff notices. Also, according to news reports, General Motors is offering buyouts to up to 3,500 salaried workers, and Stellantis is cutting and consolidating at least 408 positions at the Detroit assembly plants.

While the recent Stellantis layoff notices are not reflected in the most recent Detroit unemployment data, how large companies are restructuring should be kept in mind with a possible recession looming. According to the Michigan Department of Michigan Technology, Management and Budget unemployment in Detroit declined to 7.7 percent in February of 2023; in February of 2022 the unemployment rate was at 12.1 percent.

The chart below provides a more detailed look at unemployment rates throughout Southeast Michigan, both currently and a year ago. According to the data, unemployment rates for all seven counties in Southeastern Michigan were less in February of 2023 than they were in February of 2022. Monroe County had the highest unemployment rates in both February of 2023 and 2022 at 5.1 and 6.2, respectively.  Wayne County had the largest decrease in its unemployment rate between February of 2022 and 2023 at 1.8 percent. In February of 2022 Wayne County’s unemployment rate was 6.2 percent, and in 2023 it was 4.4 percent.

Livingston County continued to have the lowest unemployment rate in the region at 3 percent in February of 2023, followed by Washtenaw County with an unemployment rate of 3.5 percent.

Home prices in Metro-Detroit again decreased in January of 2023, according to the Case Shiller Index. In January of 2023, the average price of single-family dwellings sold was $168,300 , a decrease of $1,190 from the average price of a home in December of 2022. This was the largest decrease in the average home prices in Metro-Detroit since December of 2020.

While the month-to-month trend of prices increasing is easing up a look at data from year’s prior shows just how much prices have increased overall. Between January of 2023 and 2022 the average price increased $4,960; between January of 2022 and 2020 the price increased $39,020 and between January of 2023 and 2014 the average price has increased $74,380.

Opioid Harm Reduction Programs in Michigan as Overdoses Continue to Rise

The fact that Michigan is experiencing an opioid epidemic has been well-established. With fatal overdoses on the rise, particularly in Washtenaw and Wayne counties it is vital to not only acknowledge that the epidemic is in fact in full swing, but that there is hope by way of harm reduction practices. According to the US Centers for Disease Control, “harm reduction is a public health approach that focuses on mitigating the harmful consequences of drug use, including transmission of infectious disease and prevention of overdose, through provision of care that is intended to be free of stigma and centered on the needs of people who use drugs.” Harm reduction activities include naloxone distribution, provision of sterile syringes, education and prevention regarding overdoses and safer drugs and other activities that can lessen the risk of adverse outcomes associated with using drugs. 

Several harm reduction activities are offered throughout Michigan, and administered through various organizations. For example, in Michigan various places have naloxone portal kits that have been distributed through the Michigan Department of Health and Human Services (MDHSS). A naloxone portal kit typically contains two doses of naloxone, two nasal misters and directions on use. Naloxone is a medicine that reverses the effects of opioid overdoses, restoring normal breathing and consciousness of a person experiencing overdose symptoms (Narcan is the nasal spray version of this).

According to MDHHS, Wayne County had the highest number of naloxone kits distributed to various organizations by the end of 2022 at 52,464. Macomb County had the second highest number of kits at 35,328 and Livingston County had the lowest number of kits distributed to various organizations by the MDHHS by the end of 2022 at 2,148. The type of organizations these kits were distributed to include first responders, courts, treatment and recovery centers, correctional facilities, health departments, academic institutions and community organizations and non-profit organizations. Throughout Michigan, community organizations and non-profit organizations received the highest number of kits. Of the 334,152 kits distributed throughout Michigan by the end of 2022, 198,780 (or 59%) of the kits were distributed to community organizations and non-profit organizations, according to the MDHHS.

Academic institutions were also included in the list of organizations that receive and distribute naloxone kits. Through Wayne State University’s Center for Urban Studies, the AmeriCorps Community Training for Overdose Rescue (ACT) administers free training for Southeast Michigan community members to prepare people to provide aid during an overdose emergency while waiting for help to arrive. All training participants receive a free Overdose Preparedness Kit containing Narcan. Such training is part of the Strategies and Tools for Overdose Prevention (STOP) program, which is a harm reduction initiative conducting research, delivering training and distributing naloxone in Southeast Michigan. Since October 2019, the ACT/STOP program through the Center for Urban Studies has hosted 235 overdose rescue training sessions and equipped 3,501 people with the skills and knowledge to provide first aid during opioid overdose emergencies.

Another harm reduction tool for opioid use in Michigan is the standing order issued the by the MDHHS that allows licensed pharmacies to dispense naloxone to the public. Of the percent of registered pharmacies in each of the seven counties in Southeast Michigan, St. Clair County had the highest percentage of pharmacies participating the in the standing naloxone order at 79 percent (26 pharmacies). Wayne County had the lowest participating at 50 percent (319 pharmacies).

An additional harm reduction practice is the existence of Syringe Service Programs. These data below shows the percent of the population within a 15-minute drive of a Syringe Service Program funded by the MDHHS. These programs are considered a form of harm reduction because they offer sterile injection equipment and provide a linkage to substance use disorder treatment.

Washtenaw County had the highest percentage of the population that lived within a 15-minute drive of a Syringe Service Program in Michigan at 82.9 percent. Wayne County had the second highest percentage of the population within a 15-minute drive of a Syringe Service Program at 81.7 percent.

Livingston County had the lowest percentage regionally with 0.5 percent of the population being with a 15-minute drive to a Syringe Service Program. While this percentage was much lower than the other counties’, Livingston County had the 53rd highest percentage of the population within a 15-minute drive to a program.

The use of Buprenorphine is harm reduction to meant to treat opioid disorder.  Buprenorphine is a medication approved by the Food and Drug Administration to treat opioid use disorder.

In Southeast Michigan, Monroe County had the highest Buprenorphine prescription unit rate per 1,000 people in 2020 at 3,950.5, followed by St. Clair County with a rate of 2,978.5. Higher rates of Buprenorphine are viewed as favorable in the calculating the MI-SUVI rate because the drug aims to treat addiction. Oakland County had the lowest Buprenorphine prescription rate at 1,485.6 per 1,000 people.

The Buprenorphine rate is based on the prescription units.

As shown, harm reduction programs and policies are in motion in Michigan. And while opioid use still continues, these approaches, according to the CDC, have been proven to prevent death, injury, disease, overdose, and substance misuse.

Even with such programs in place, overdoses do still occur. It is important to be aware of the signs and to know what to do in the event someone has overdosed. According to the ACT/STOP training, signs of an opioid overdose are:

  • Pinpoint pupils
    • Not breathing normally (infrequent or no breathing at all, deep snoring or gurgling)
    • Pale – lips and fingertips may be blue/gray
    • Not responsive to touch or sound
    • Signs of substance use around: syringes, pill bottles, other substances.

Should someone be experiencing an overdose, you should decide to help. Michigan’s Good Samaritan Laws protect you from legal action and lawsuits if unintended consequences result from your assistance.

Ways to help include, if someone is not breathing normally, begin hands-only CPR right away and call 911 immediately. If someone is unconscious but breathing normally, administer Narcan then place them in the recovery position.

For more information on Wayne State University Center for Urban Studies’ ACT program click here. You can also find information on Syringe Service Programs and how to receive naloxone here.

Synthetic Opioid Overdose Deaths in Michigan Continue to Rise, Outpace Other Opioid Related Deaths

Michigan’s opioid epidemic is no secret, and it is not just prescription pills that are contributing to the rise in overdoses. Opioids include prescription pain relievers such as oxycodone (Oxycontin), hydrocodone (Vicodin), codeine, morphine, fentanyl, methadone, and the illegal drug heroin. However, pain killers that are not prescribed or are used outside of the prescription are considered illegal. Furthermore, pain killers such as fentanyl are being illegally manufactured and distributed at an increasing rate. As the first chart below shows, the number of overdose deaths for all opioids has increased since 2000, but synthetic opioid overdose deaths have risen the most over the last several years, according to data from the Michigan Department of Health and Human Services.

In 2000 there were 17 synthetic opioid overdose deaths (not including methadone) in the State of Michigan. Comparably there were 60 prescription opioid overdose deaths in Michigan in 2000 and 89 heroin overdose deaths. In 2021 there were 2,287 synthetic opioid overdose deaths, 512 prescription opioid overdose deaths and 145 heroin overdose deaths. In Michigan, synthetic opioid overdose deaths increased the most between 2014 and 2015 and 2019 and 2020. Between 2014 and 2015 synthetic opioid overdose deaths increased by 465 deaths, from 175 overdose deaths to 465 overdose deaths. Between 2019 and 2020 opioid overdose deaths increased by 466, from 1,445 to 1,911. Although heroin and prescription overdose deaths have also increased since 2000, the number of overdose deaths for both categories have not grown by the amounts that synthetic opioid overdoses have, nor have they reached (individually) as high an overdose death number as synthetic opioid overdose deaths.

The yellow line in the chart represents the total number of opioid overdose deaths between 2000 and 2021, as reported by the Michigan Department of Health and Human Services. The yellow line often falls below the total number of opioid overdose deaths calculated when combining prescription and synthetic opioids and heroin. According to the Michigan Department of Health and Human Services, the summing of categories will not always result in more than the number of all opioid drug overdoses and the categories of death are not exclusive as deaths might involve more than one drug.

It is also important to note that prescription overdoses includes both prescription opioid pain relievers (e.g., hydrocodone, oxycodone, and morphine) and opioids used to treat addiction (e.g., methadone)

The first chart shows the sheer number of opioid overdose deaths by category, and the chart below shows the rate of opioid overdoses by category, again highlighting the increase in synthetic opioid overdoses. The rates below are calculated per 100,000 people. Prescription opioids regularly had the highest overdose mortality rate up until 2015. In 2015 the overdose mortality rate for prescription opioids was 4.5 overdoses per 100,000 people and for synthetic opioids the rate was 4.7. From there, the overdose rate for synthetic opioids grew to a rate of 23.9 overdose deaths per 100,000 in 2021. Prescription opioid overdose rates and heroin overdose rates also grew for a few years beyond 2015, both peaking after then. The prescription opioid overdose rate peaked in 2016 at 7.7 and the heroin overdose rate peaked at a rate of 8.2 overdoses per 100,000 in 2017. Overdose rates for prescription opioid overdoses and heroin overdoses have decreased since then.

The data clearly shows opioid overdoses continue to increase in Michigan, and synthetic opioid (such as fentanyl) overdoses are playing a large role in that. An obvious question may be, why fentanyl? Well, fentanyl is a highly potent opioid that only requires people to ingest a tiny amount to overdose.

According to Rutgers University, in many areas, fentanyl has nearly completely replaced heroin and can be found in many counterfeit prescription opioid and benzodiazepine pills bought on the street. Methamphetamine and cocaine may also contain undeclared fentanyl.

As shown, Michigan is not immune to its population gaining access to this highly dangerous drug. And while it is still found on the streets, law enforcement agents are working to stop production and distribution. According to the US Department of Justice, more than 65 kilograms of fentanyl powder and 88,000 fentanyl laced pills were seized by federal agents during May 23 and Sept. 8, 2022. The USDOJ said this was enough to provide 4.7 million deadly dosages.

According to the USDOJ,  fentanyl is 50 times more potent than heroin. Just two milligrams of fentanyl, or the amount that could fit on the tip of a pencil, is considered a potentially lethal dose.

The risk of overdose remains high with opioid use, as do other negative consequences from using opioids. So, while law enforcement officials work to eliminate illegal production, distribution and use of opioids there are also organizations working to help those with an opioid addiction. As we have noted throughout this series, to end the opioid epidemic we need a multi-faceted approach and treating addiction is part of that approach. In our next post we will discuss these programs and their impacts.