With a re-ignited commitment to sustainability, the State of Michigan has experienced an increase in the amount of materials being recycled. According to a 2023 report (2023 Michigan Recycling: State of the State) by the Michigan Department of Energy, Great Lakes and Environment (EGLE), Michigan’s recycling rate increased 35 percent since prior to 2019 to 2022. This report states that Michigan now has a 19 percent recycling rate, in part because of greater access to and greater funding for this key element in sustainability. According to the report, more than $460 million has been invested in recycling for everything from new technology to equipment upgrades to hiring new employees since 2019.
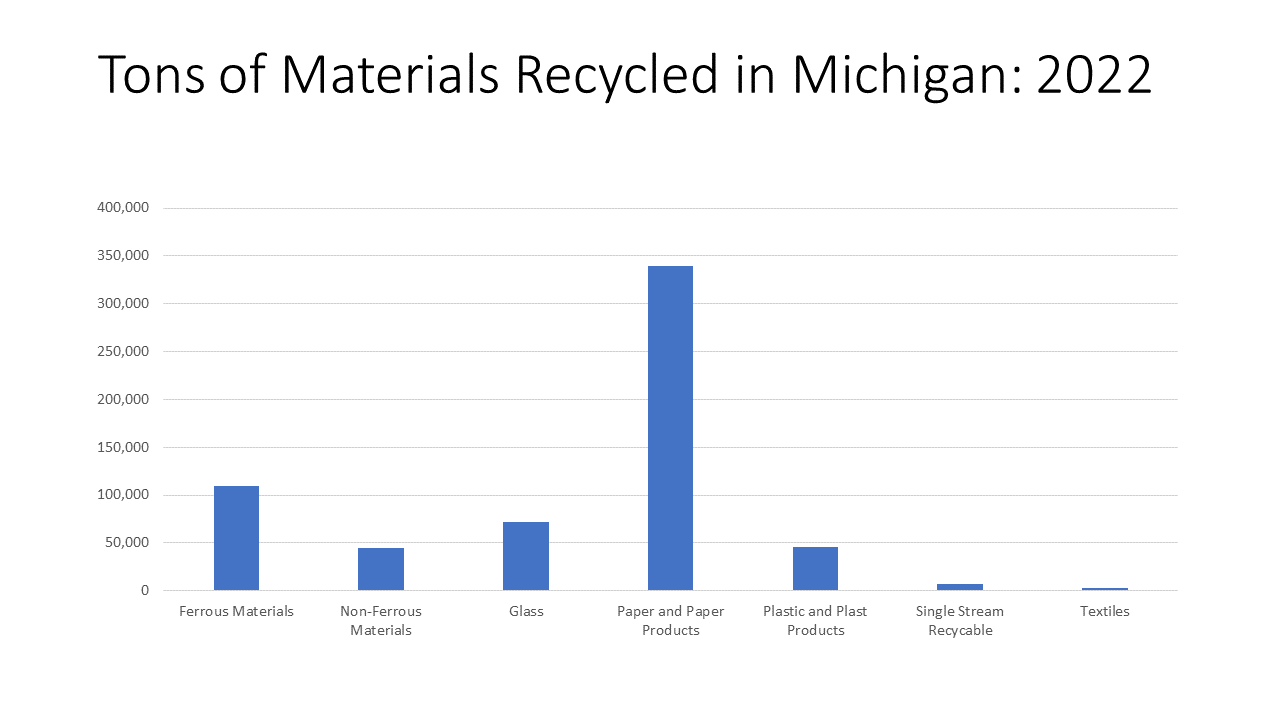
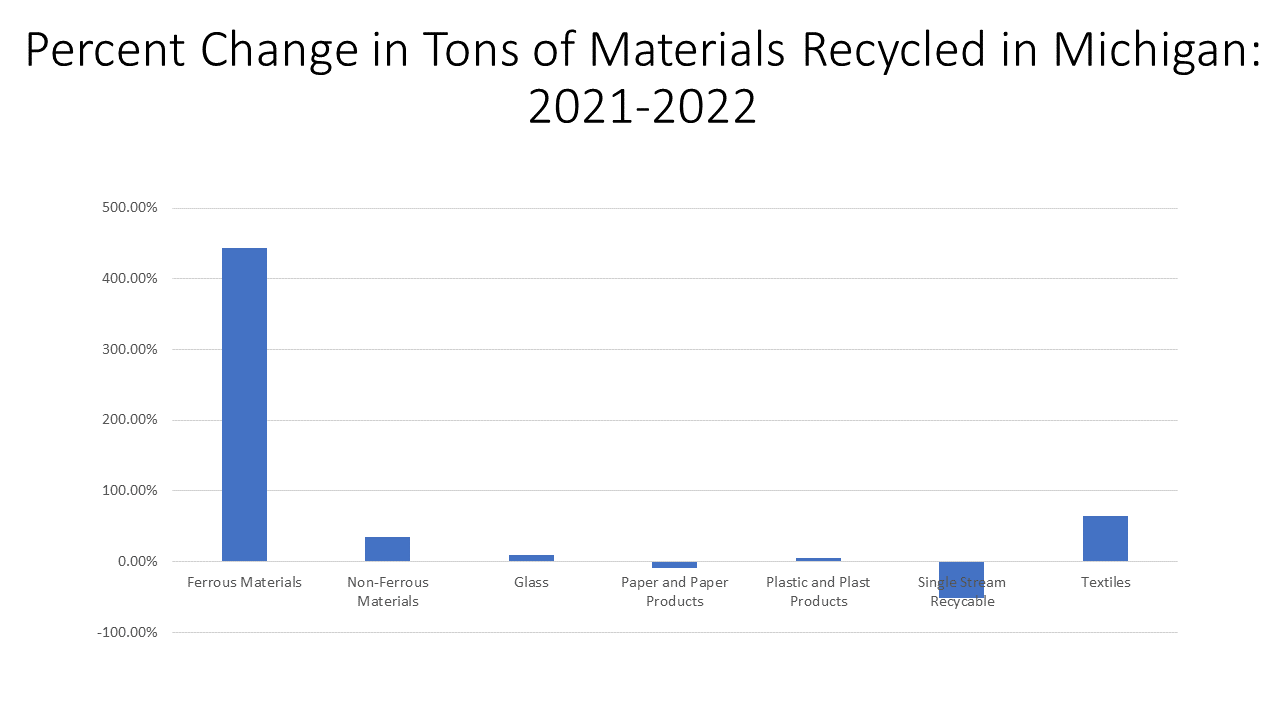
As Michigan continues to up its commitment to recycling efforts, it is important to understand just what is being recycled in the state and how much. According to the 2023 EGLE Recycling Report, 620,494 tons of materials were recycled in Michigan last year, with paper and paper products making up majority of those materials being recycled. According to the breakdown in the report, there was about 339,000 tons of paper and paper materials recycled in 2022. Ferrous materials, which are metals that contain iron, were the second most recycled items in 2022 with there being about 110,000 tons. Ferrous materials also had the largest percent change increase in the number of tons recycled between 2021 and 2022 at 443 percent. Single stream recycling materials (which are all recyclables, including newspaper, cardboard, plastic, aluminum and junk mail that are eventually sorted into various commodity streams for sale to markets) had the largest year-to-year percent change decrease at 51 percent. There was also a year-to-year percent change decrease for paper and paper products at 9 percent.
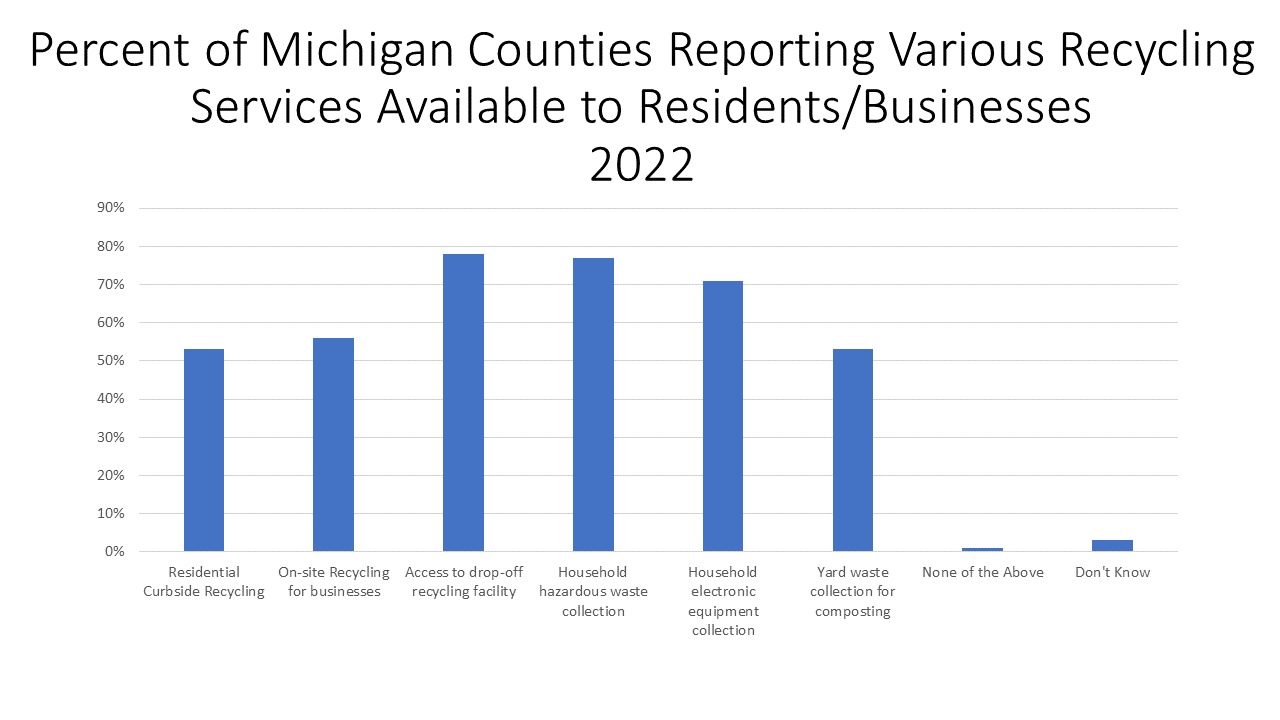
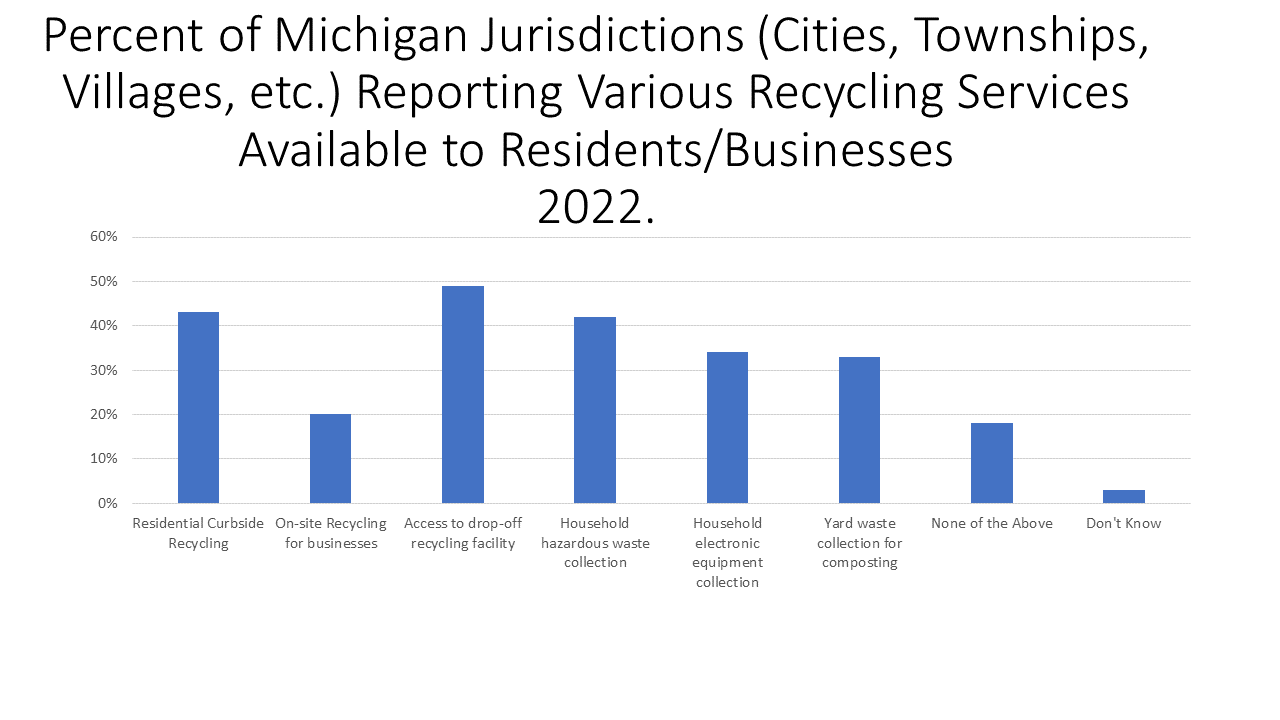
While understanding what is being recycled is important, understanding the resources available for residents and businesses to recycle may be even more important. According to the 2023 EGLE Recycling Report, 75 percent of Michigan households, or about 2.9 million households, have access to curbside recycling or drop-off locations. Digging deeper into this statistic, according to a University of Michigan March 2022 Michigan Public Policy Survey on Recycling, the majority of counties (which are viewed as different than local jurisdictions such as cities, townships and villages) provide access to a drop-off recycling facility (78%) household hazard waste collection (77%) and household electronic equipment collection (71%). Fifty-three percent of counties provide curbside recycling services (shown in Chart 4), and 41 percent of local jurisdictions provide those services (Chart 5).
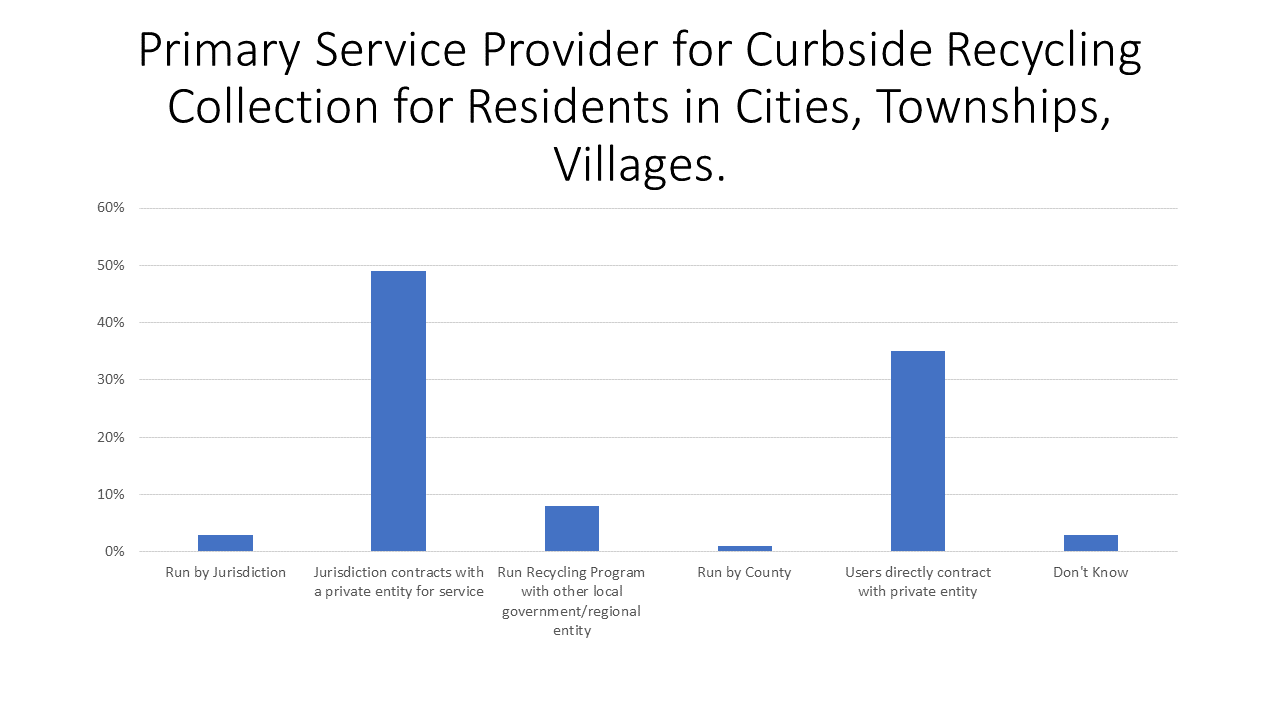
Chart 6 digs deeper into how those curbside recycling services are provided, as described in the survey. According to the survey, 49 percent of Michigan local government jurisdictions contract with a private entity to provide curbside recycling services, and 35 percent of those jurisdictions have their residents directly contract with a private entity for such services. It is important to remember that these jurisdictions range from populations of 1,000 or less to 30,000 or more. Seventy-eight percent of jurisdictions with populations of 30,000 or more contract with a private entity to provide curbside recycling services to their residents while 47 percent of jurisdictions with populations between 5,000 and 10,000 have their residents directly contract with a private entity, and 40 percent of jurisdictions with populations between 1,500 and 5,000 also have their residents directly contract with a private entity.
Through the data highlighted we know that there are various levels of recycling services provided to residents and businesses to make this sustainability effort easier. We also know that it is not just the state’s priority to increase recycling rates, but also local jurisdictions’. For example, of the $460 million invested in recycling over the last several years, about 80 percent of it has come from local government, nonprofits, and businesses across the state. But, while our efforts are increasing, the amount of waste Michigan accepted into its landfills increased between 2021 ( 50,918,462 tons) and 2022 (51,990,037 tons). It is important to note that the amount of waste Michigan dumped into its landfills decreased between 2021 and 2022, but the amount it accepted from Canada and other U.S. states increased. Overall, 76 percent of the waste in Michigan’s landfills is from Michigan, 18.6 percent is from Canada and 5.3 percent is from other states.
The State of Michigan has made great strides in its commitment to recycling, with greater transparency, more data and more resources available. But the other key piece of addressing Michigan’s (and the country’s) climate change issue is reducing the amount of waste that goes into landfills through reduction of consumption. Additionally, the practice of accepting solid waste from other states and countries must also be halted.