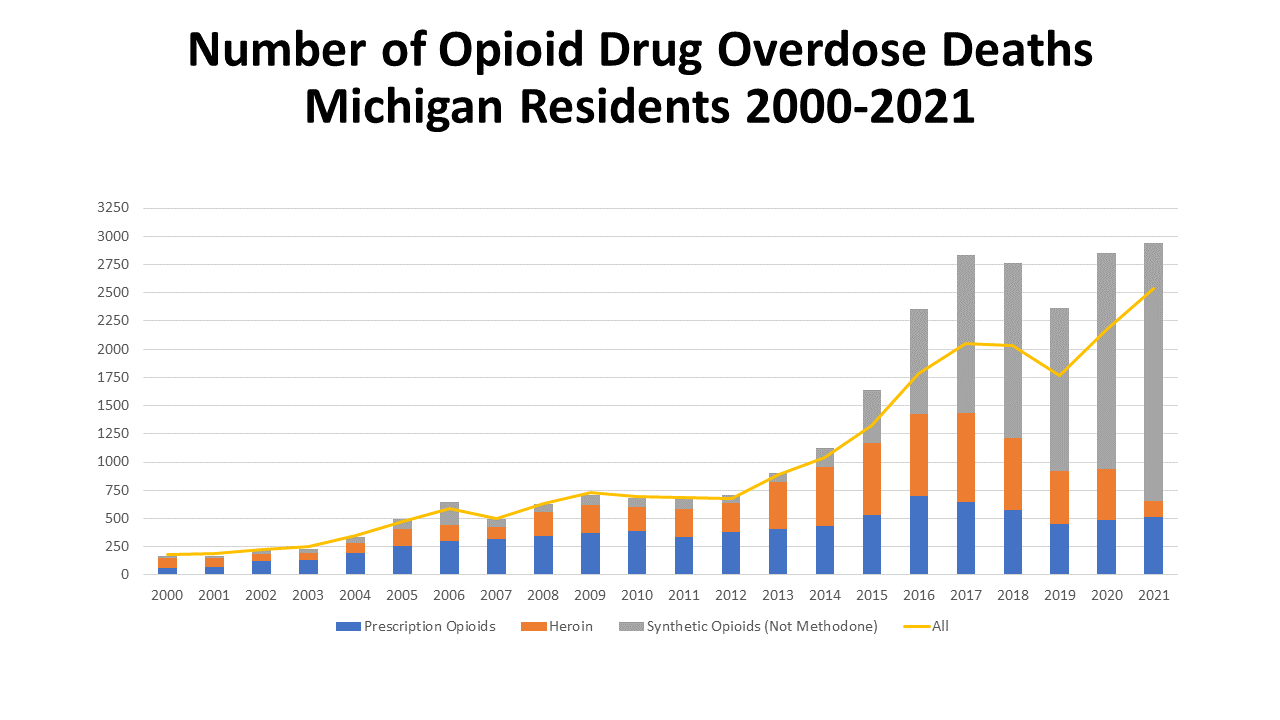
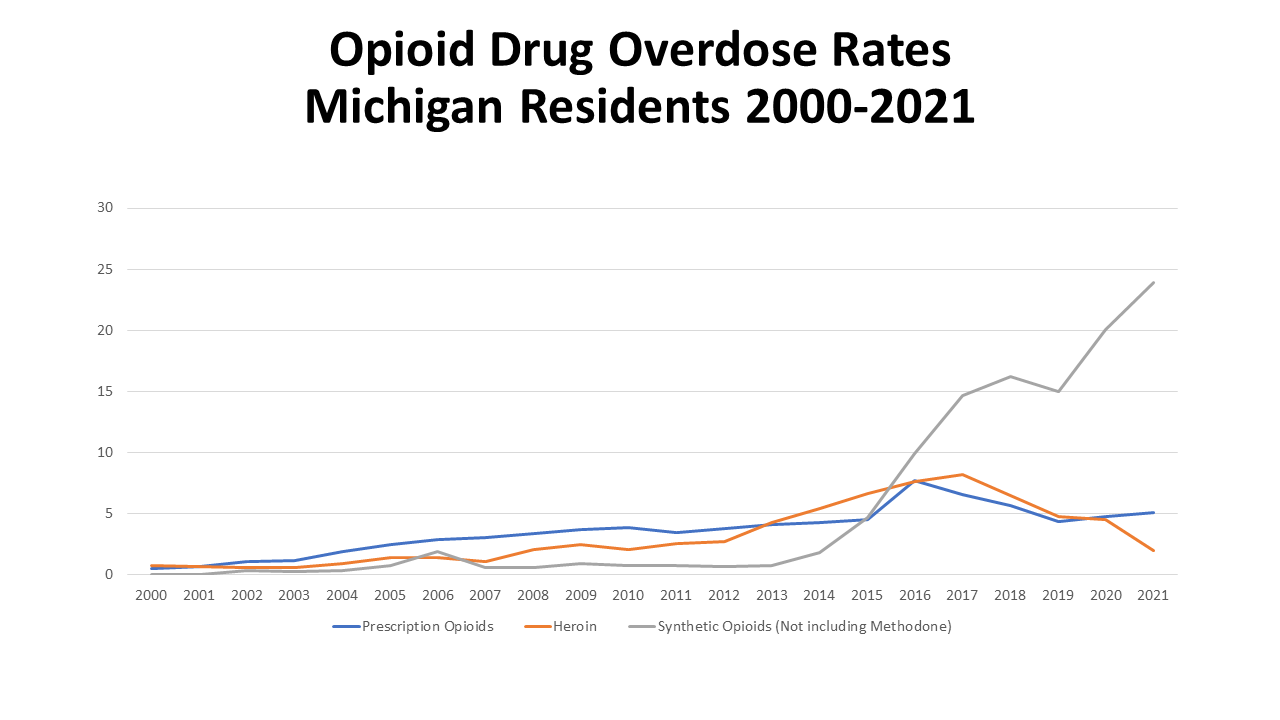
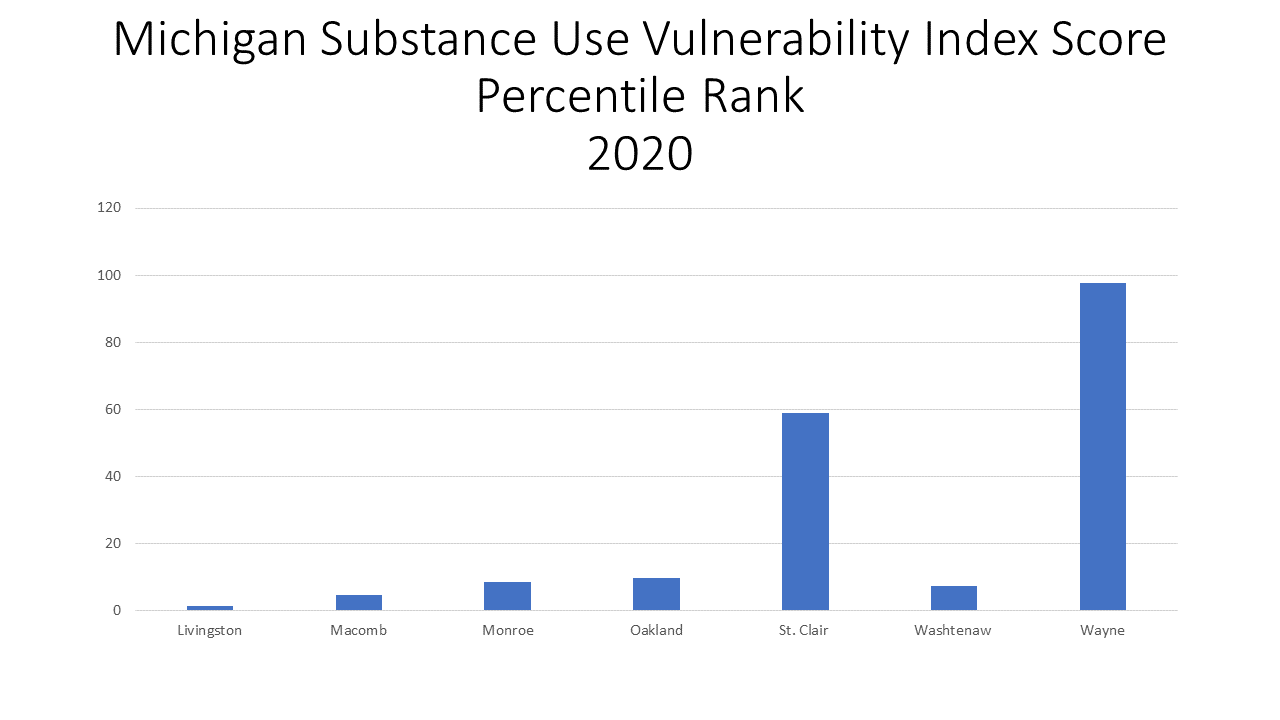
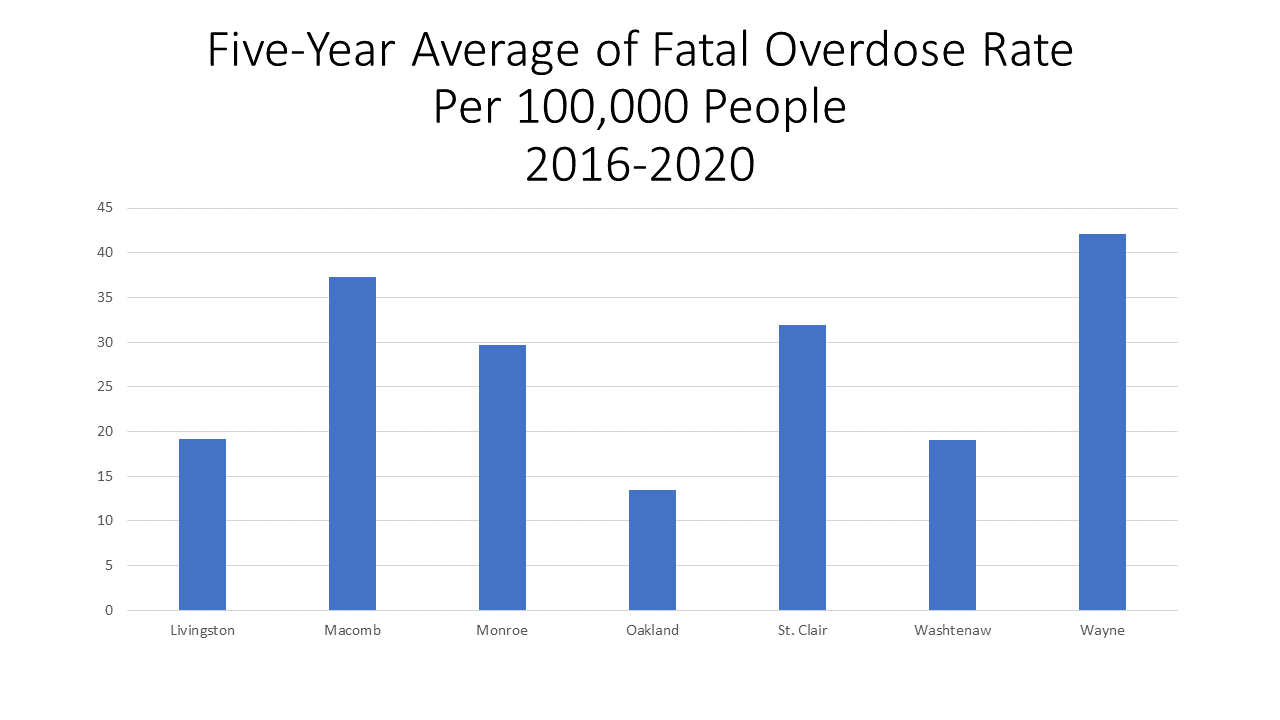
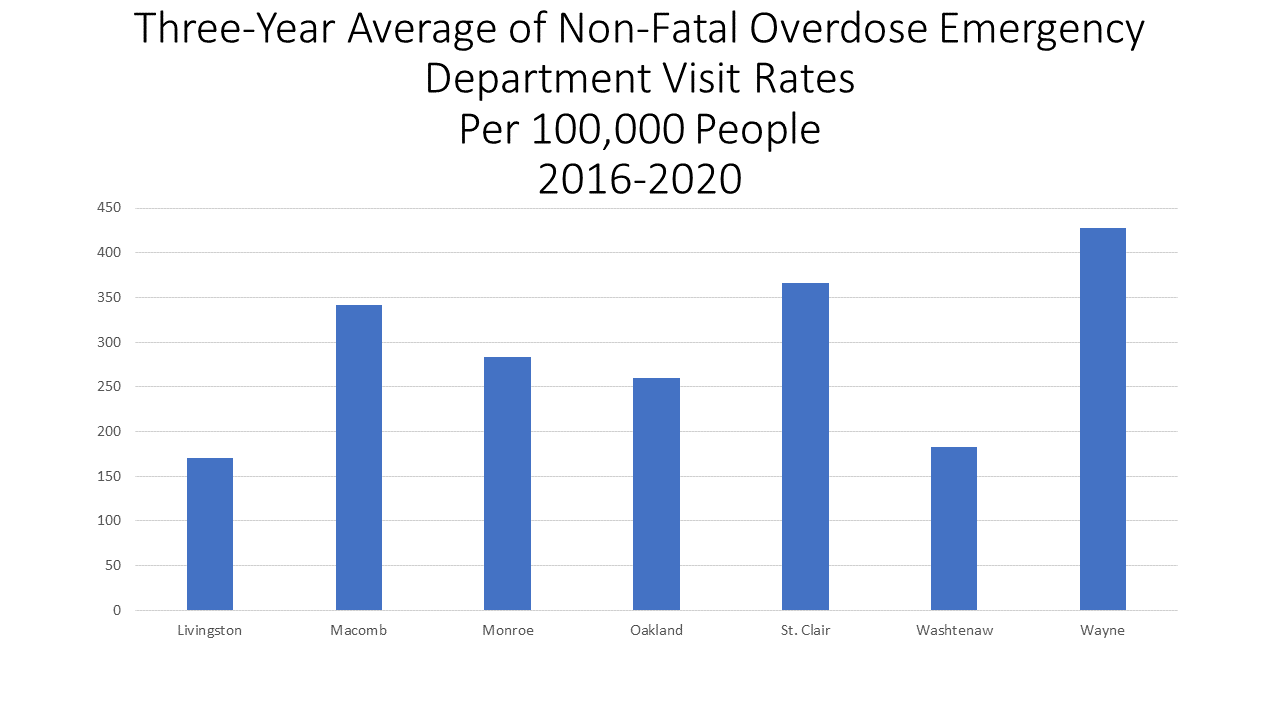
The fact that Michigan is experiencing an opioid epidemic has been well-established. With fatal overdoses on the rise, particularly in Washtenaw and Wayne counties it is vital to not only acknowledge that the epidemic is in fact in full swing, but that there is hope by way of harm reduction practices. According to the US Centers for Disease Control, “harm reduction is a public health approach that focuses on mitigating the harmful consequences of drug use, including transmission of infectious disease and prevention of overdose, through provision of care that is intended to be free of stigma and centered on the needs of people who use drugs.” Harm reduction activities include naloxone distribution, provision of sterile syringes, education and prevention regarding overdoses and safer drugs and other activities that can lessen the risk of adverse outcomes associated with using drugs.
Several harm reduction activities are offered throughout Michigan, and administered through various organizations. For example, in Michigan various places have naloxone portal kits that have been distributed through the Michigan Department of Health and Human Services (MDHSS). A naloxone portal kit typically contains two doses of naloxone, two nasal misters and directions on use. Naloxone is a medicine that reverses the effects of opioid overdoses, restoring normal breathing and consciousness of a person experiencing overdose symptoms (Narcan is the nasal spray version of this).
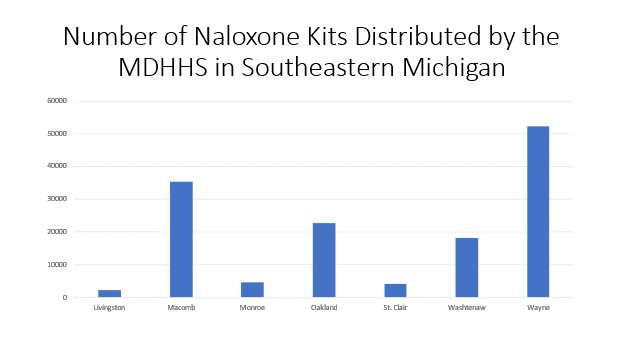
According to MDHHS, Wayne County had the highest number of naloxone kits distributed to various organizations by the end of 2022 at 52,464. Macomb County had the second highest number of kits at 35,328 and Livingston County had the lowest number of kits distributed to various organizations by the MDHHS by the end of 2022 at 2,148. The type of organizations these kits were distributed to include first responders, courts, treatment and recovery centers, correctional facilities, health departments, academic institutions and community organizations and non-profit organizations. Throughout Michigan, community organizations and non-profit organizations received the highest number of kits. Of the 334,152 kits distributed throughout Michigan by the end of 2022, 198,780 (or 59%) of the kits were distributed to community organizations and non-profit organizations, according to the MDHHS.
Academic institutions were also included in the list of organizations that receive and distribute naloxone kits. Through Wayne State University’s Center for Urban Studies, the AmeriCorps Community Training for Overdose Rescue (ACT) administers free training for Southeast Michigan community members to prepare people to provide aid during an overdose emergency while waiting for help to arrive. All training participants receive a free Overdose Preparedness Kit containing Narcan. Such training is part of the Strategies and Tools for Overdose Prevention (STOP) program, which is a harm reduction initiative conducting research, delivering training and distributing naloxone in Southeast Michigan. Since October 2019, the ACT/STOP program through the Center for Urban Studies has hosted 235 overdose rescue training sessions and equipped 3,501 people with the skills and knowledge to provide first aid during opioid overdose emergencies.
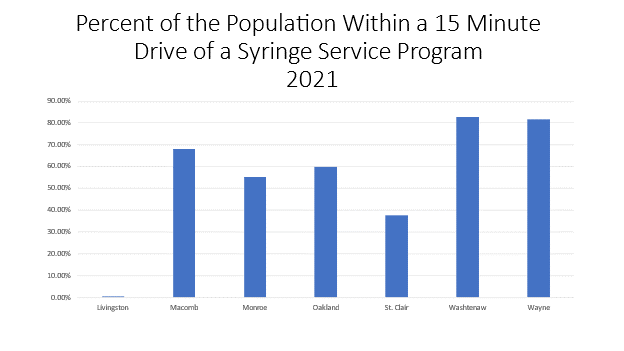
An additional harm reduction practice is the existence of Syringe Service Programs. These data below shows the percent of the population within a 15-minute drive of a Syringe Service Program funded by the MDHHS. These programs are considered a form of harm reduction because they offer sterile injection equipment and provide a linkage to substance use disorder treatment.
Washtenaw County had the highest percentage of the population that lived within a 15-minute drive of a Syringe Service Program in Michigan at 82.9 percent. Wayne County had the second highest percentage of the population within a 15-minute drive of a Syringe Service Program at 81.7 percent.
Livingston County had the lowest percentage regionally with 0.5 percent of the population being with a 15-minute drive to a Syringe Service Program. While this percentage was much lower than the other counties’, Livingston County had the 53rd highest percentage of the population within a 15-minute drive to a program.
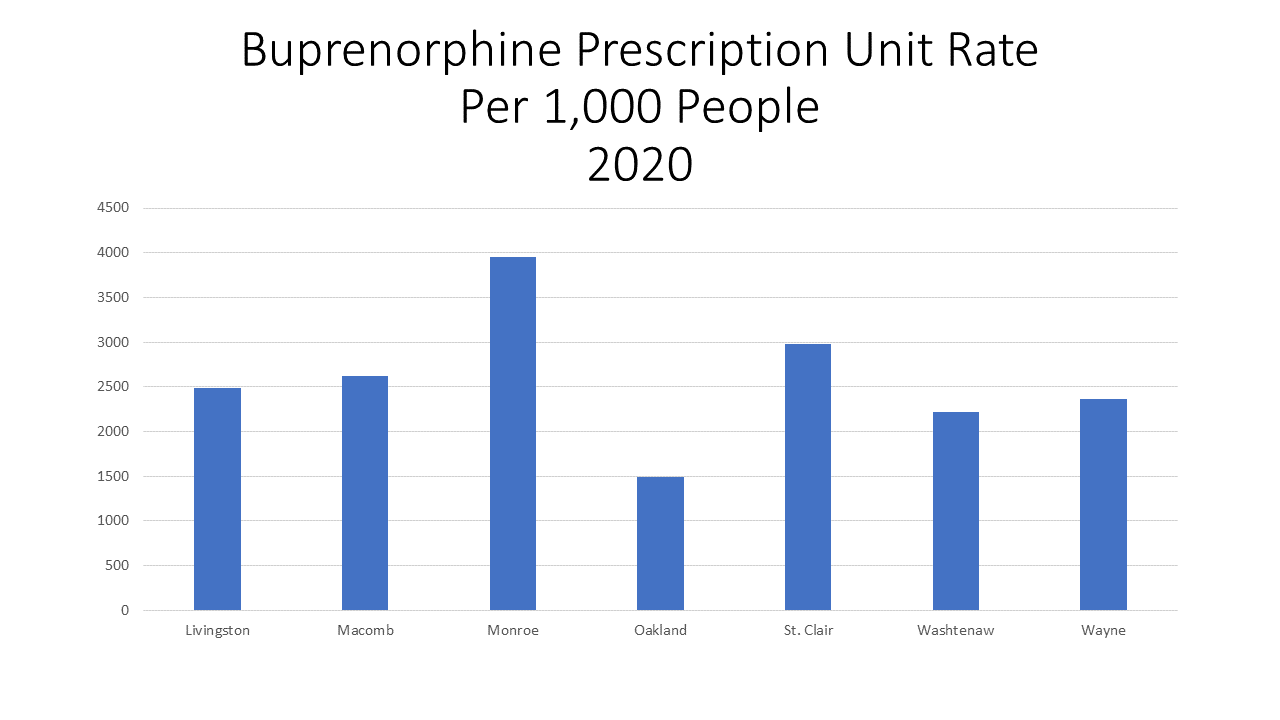
The use of Buprenorphine is harm reduction to meant to treat opioid disorder. Buprenorphine is a medication approved by the Food and Drug Administration to treat opioid use disorder.
In Southeast Michigan, Monroe County had the highest Buprenorphine prescription unit rate per 1,000 people in 2020 at 3,950.5, followed by St. Clair County with a rate of 2,978.5. Higher rates of Buprenorphine are viewed as favorable in the calculating the MI-SUVI rate because the drug aims to treat addiction. Oakland County had the lowest Buprenorphine prescription rate at 1,485.6 per 1,000 people.
The Buprenorphine rate is based on the prescription units.

As shown, harm reduction programs and policies are in motion in Michigan. And while opioid use still continues, these approaches, according to the CDC, have been proven to prevent death, injury, disease, overdose, and substance misuse.
Even with such programs in place, overdoses do still occur. It is important to be aware of the signs and to know what to do in the event someone has overdosed. According to the ACT/STOP training, signs of an opioid overdose are:
- Pinpoint pupils
- Not breathing normally (infrequent or no breathing at all, deep snoring or gurgling)
- Pale – lips and fingertips may be blue/gray
- Not responsive to touch or sound
- Signs of substance use around: syringes, pill bottles, other substances.
Should someone be experiencing an overdose, you should decide to help. Michigan’s Good Samaritan Laws protect you from legal action and lawsuits if unintended consequences result from your assistance.
Ways to help include, if someone is not breathing normally, begin hands-only CPR right away and call 911 immediately. If someone is unconscious but breathing normally, administer Narcan then place them in the recovery position.
For more information on Wayne State University Center for Urban Studies’ ACT program click here. You can also find information on Syringe Service Programs and how to receive naloxone here.