Various Populations At-Risk By Continued Poor Air Quality in Michigan

Ozone action season is upon us here in Southeast Michigan; it began March 1 and continues through the end of September. Ozone Action Days are declared when hot temperatures are expected to combine with pollution, creating high amounts of ground-level ozone. Ground level ozone, especially in excess, can cause a human health threat, particularly to vulnerable population. These vulnerable populations include children, those 65 years of age or older, those with asthma, COPD, cardiovascular disease, lung cancer and those who are pregnant.

In 2022 in Southeast Michigan there were five Ozone Action Days, according to the Southeast Michigan Council of Governments, or days when the public is asked to do less strenuous activities and to reduce the ways in which they may contribute to air pollution. While we were certainly hoping for zero Ozone Action Days in 2023, we have already had 14, due in large part to the smoke that has drifted to Southeast Michigan from the Canadian and Northern Michigan wildfires. The most recent Ozone Action Day in Southeast Michigan was declared on July 5, 2023 and the first of the season was declared on April 15, 2023.

With nearly triple the number of Ozone Action Days in 2023 compared to 2022, concerns of air quality remain a constant worry throughout Michigan, as does the population’s health, particularly our most vulnerable populations’. Each year the American Lung Association releases a State of the Air Report that examines air quality at the county, state and national levels and how it impacts certain populations. For the 2023 State of the Air Report, The American Lung Association had data on the vulnerable populations of Macomb, Oakland, St. Clair, Washtenaw and Wayne counties.

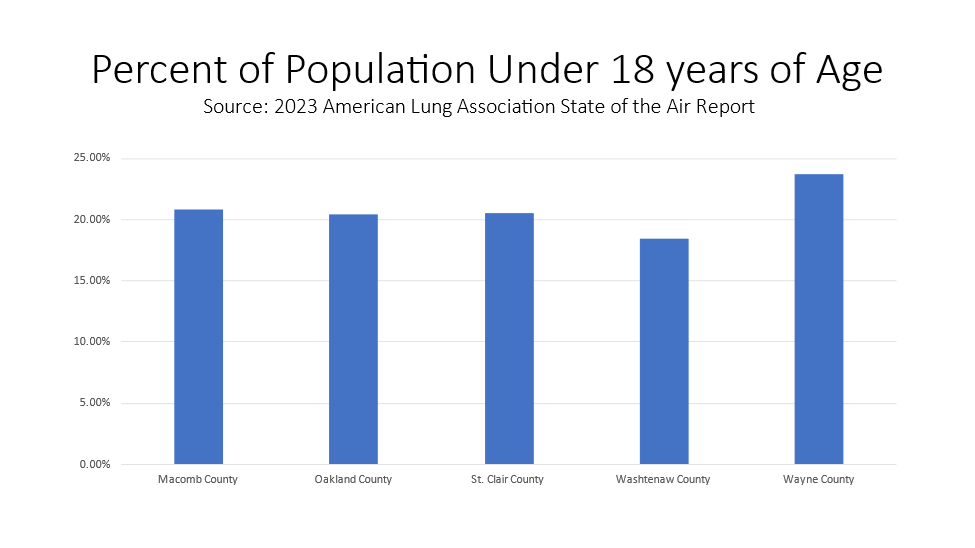
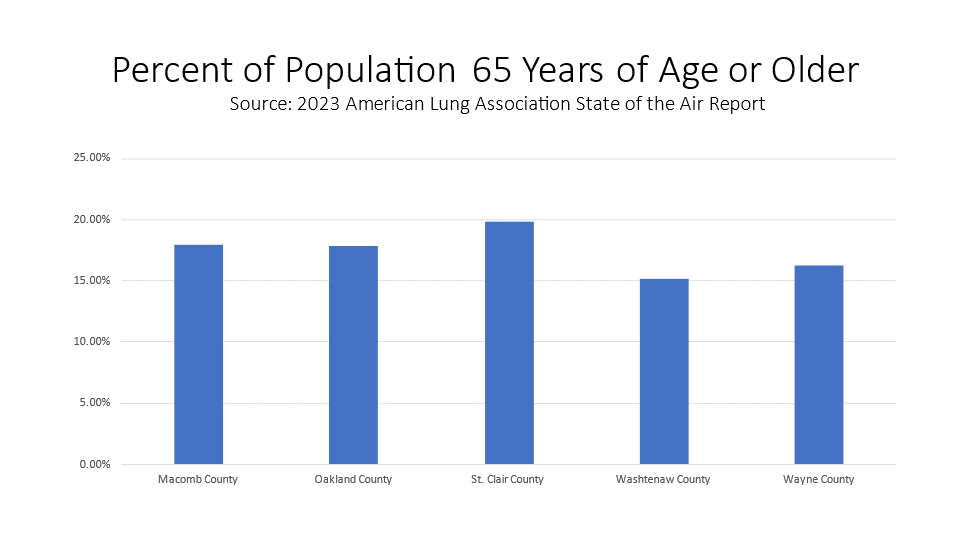
As the data shows, children (those under the age of 18) are the category with the highest percentage of individuals at risk. Of the five counties with such data available from the American Lung Association, between 18 and 24 percent of the populations are children, with Wayne County having the highest percentage and Washtenaw County having the lowest percent. The category of those 65 years of age or above had the second highest percentage of individuals at risk, with between 15 (Washtenaw County) and 19 percent (St. Clair County) of the population being at risk of health complications from high ground ozone levels.

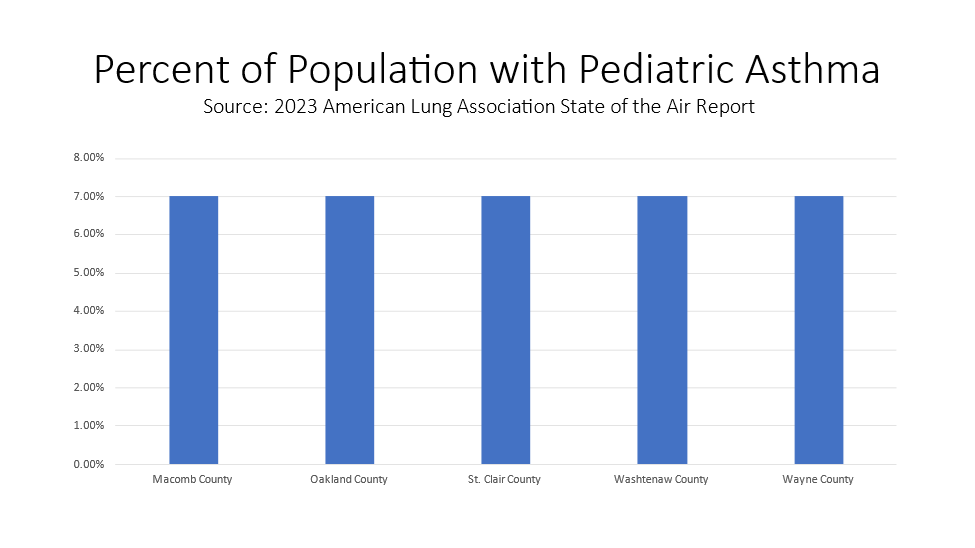
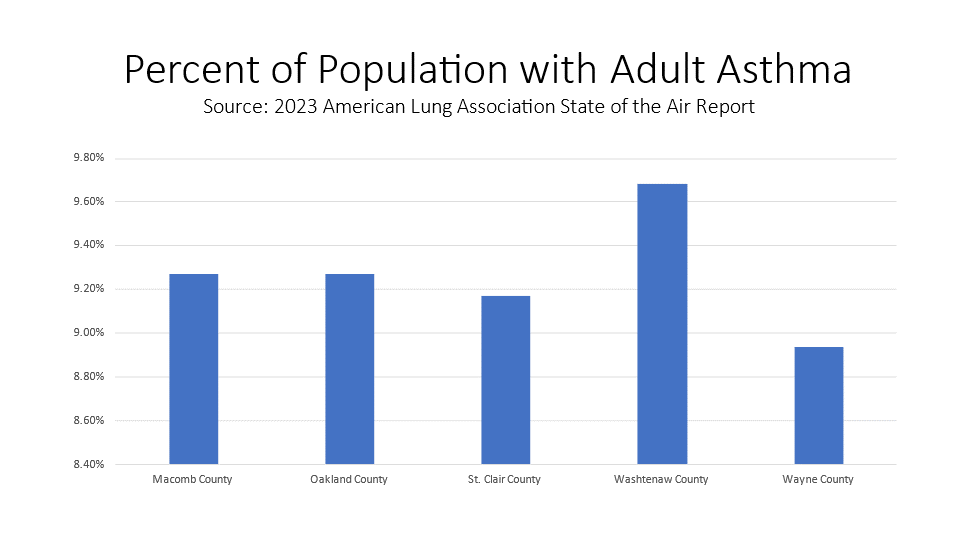
Of the diseases/conditions that can contribute to health problems during Ozone Action Days, adult asthma was the most common among the counties in Southeast Michigan (between 9-10 percent of the populations in the counties had adult asthma). Of the child population in the region, each of the five counties discussed in this post had 7 percent of that population with childhood asthma.

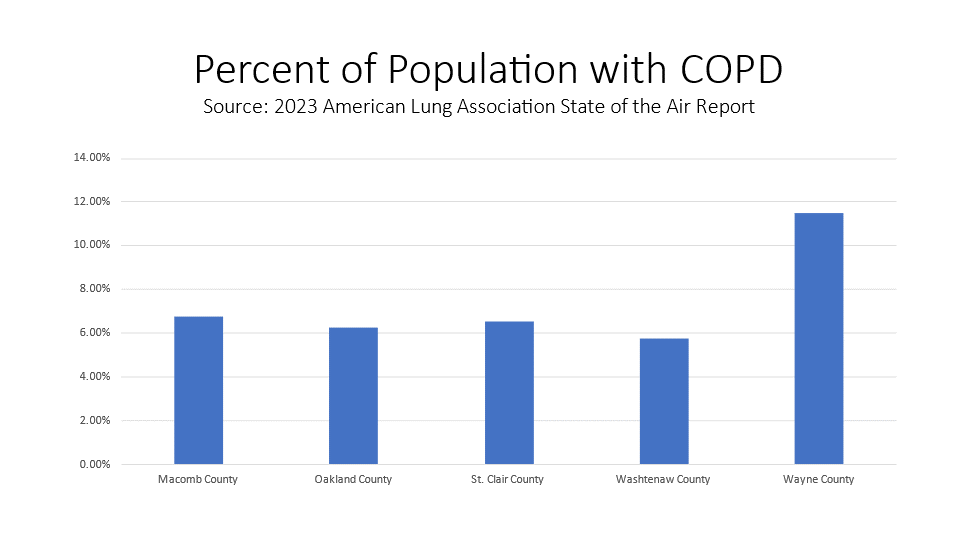
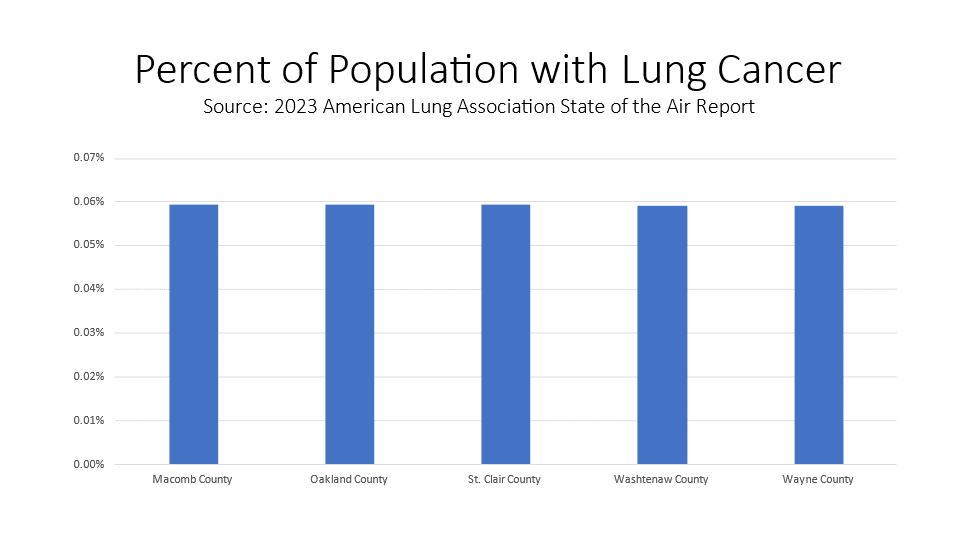
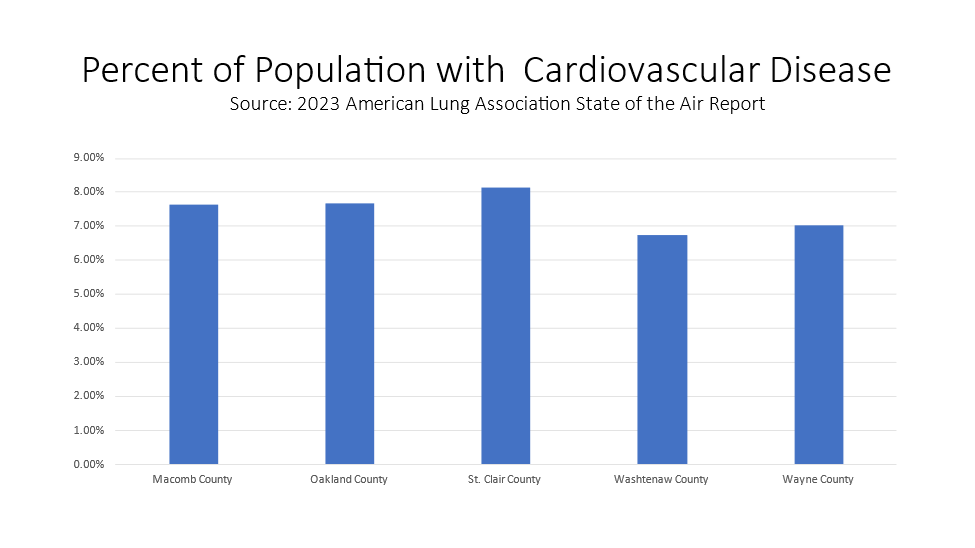
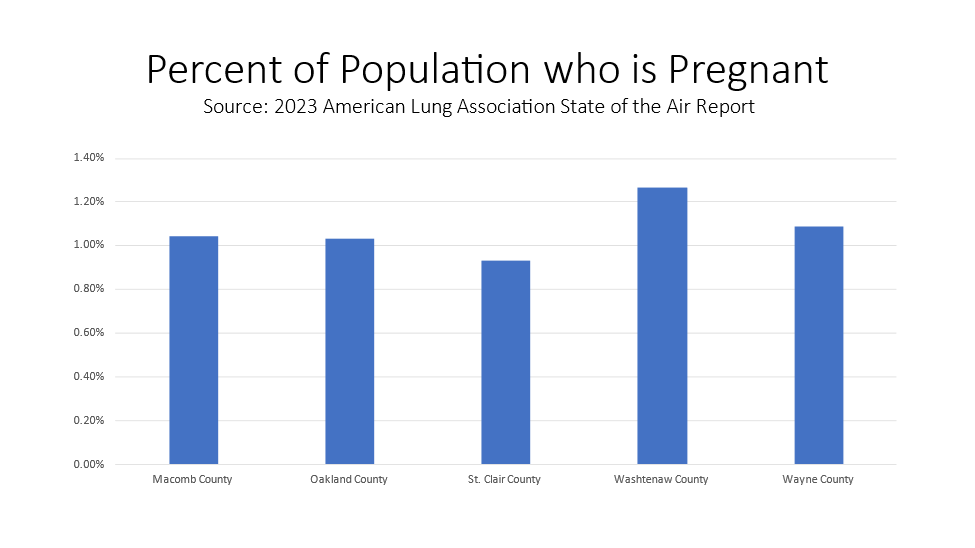
For COPD, less than 7 percent of the populations in Macomb, Oakland, St. Clair, Washtenaw and Wayne counties had the disease, except for Wayne County where the American Lung Association reported 11.5 percent of the population had COPD.  Heart disease, lung cancer and being pregnant also cause increased health risks during high ozone days, and of those three categories heart disease had the highest percentage of individuals who could be impacted.

While we can’t control how and when wildfire smoke will drift through our region there are actions we can take to help lower the amount of particles in the air, in general, and especially during Ozone Action Days.

According to the Southeast Michigan Council of Governments, to help lower the amount of ground level ozone in the air we can:

  • Delay mowing your lawn until evening or the next day. Exhaust from a lawn mower and other gas-powered lawn and garden equipment help form ozone.
  • Drive less, telecommute, bike, or walk. This helps reduce traffic congestion and air pollution.
  • Avoid refueling vehicles during daylight hours. Fumes released at the gas pump contribute to ozone formation.
  • Delay or combine errands. This will reduce traffic congestion and air pollution.
  • Reduce electricity use.

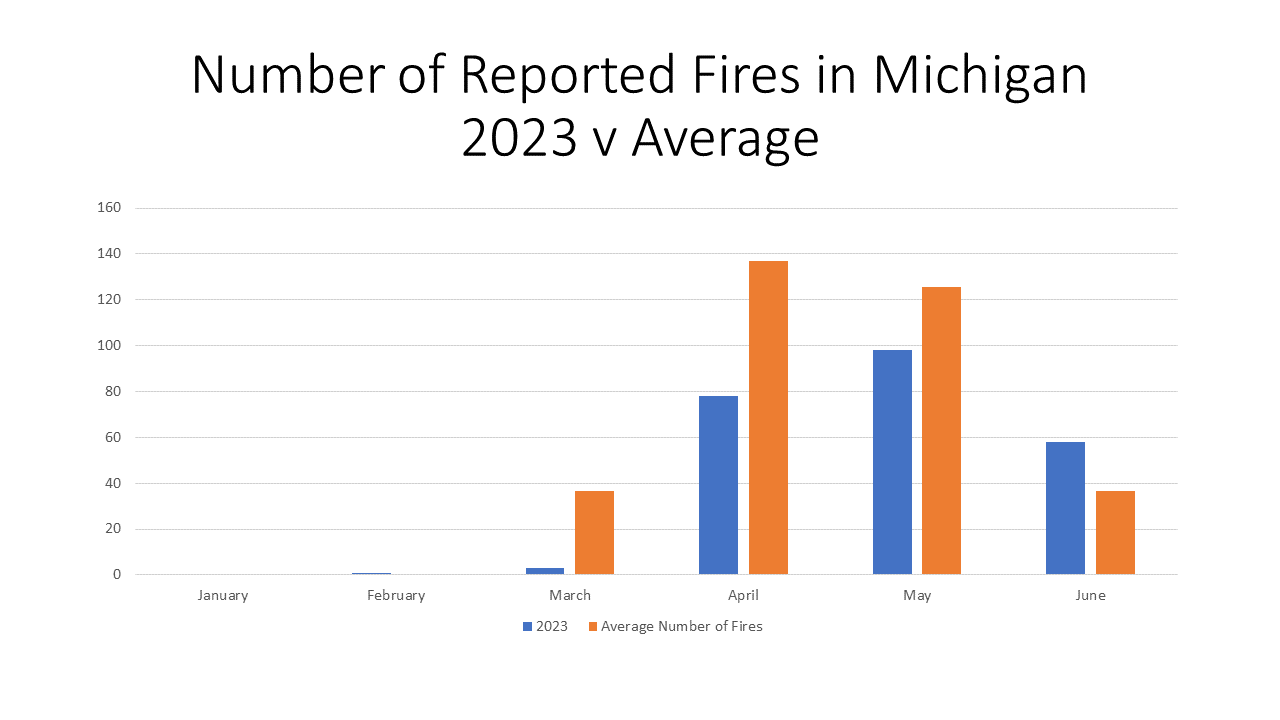
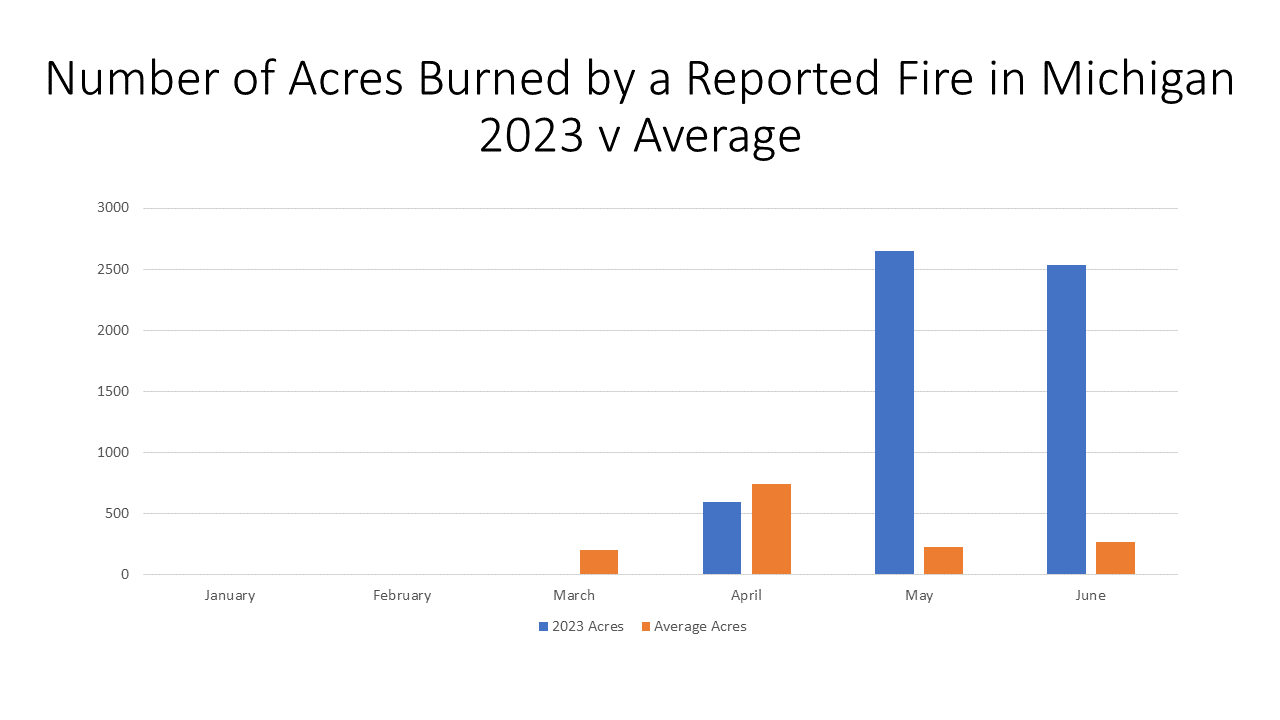
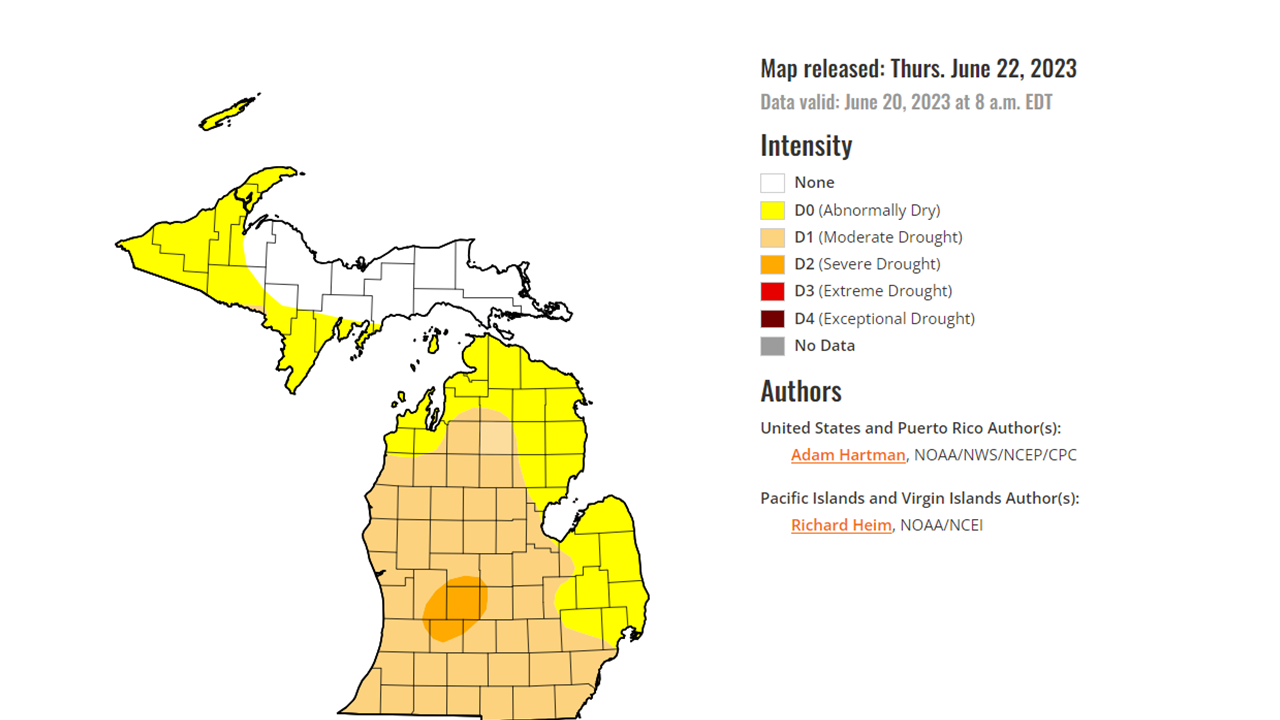
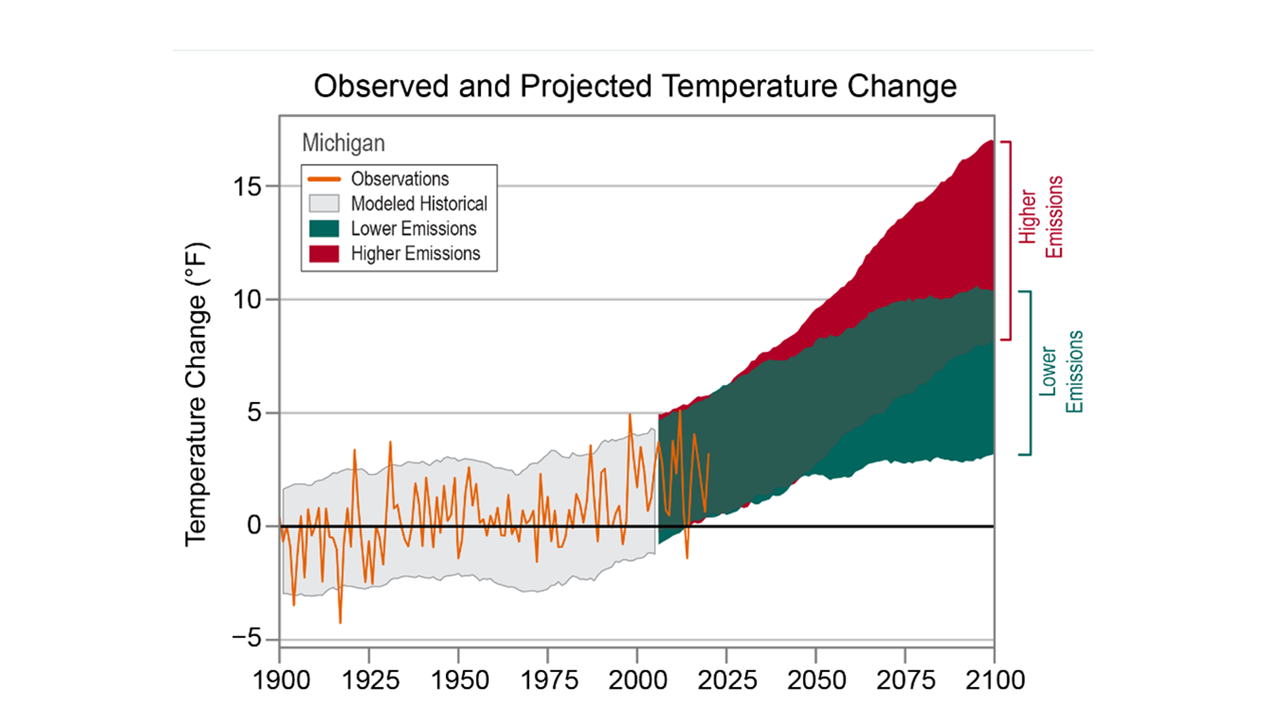
With wildfires still burning in Canada, temperatures continuing to rise and air pollution still occurring in Southeast Michigan, it is likely the number of Ozone Action Days in Southeast Michigan will rise from 13. For some of our most vulnerable populations, summer days may be spent inside more often than expected, now and in the future. As noted in our previous post, the wildfires causing our most recent Ozone Action Days are related to climate change, which is creating hotter and dryer seasons.

And, while wildfires are impacting our air quality, so is pollution, which also is a driving factor in climate change. Two of the vulnerable populations we did not discuss in this post are those in poverty and certain minorities. We will further examine how these populations are impacted by not only air quality, but also pollution, in future posts as we have a larger conversation on environmental racism.

Michigan Air Quality Remains Poor, State at Risk of Increased Fires

As of 10 p.m. on Monday June 26, some places in Michigan had Air Quality Index (AQI) levels above 150, a level that is serious for even healthy people and can be dangerous for people with serious health conditions, according to PurpleAir.com. This website tracks hyperlocal quality throughout the country on a daily basis; to view current information click here.

The poor air quality in Michigan, currently, is a result of massive fires in Canada, particularly Quebec, with smoke drifting down into Michigan.

But Michigan is also facing a substantial increase in wildfires of its own. And it could get worse.

The average number of fires per year in Michigan is 337, according the Michigan DNR, and halfway through 2023 the state is on pace to exceed that average with 238 fires having already been reported. According to the Michigan Department of Natural Resources there have been 205 total fires in Michigan’s lower peninsula in 2023, as of June 26, 2023, and 33 in the upper peninsula.

There are several reasons for fires, which include everything from lightening (279 since 2006) to fireworks (53 since 2006) to debris burning (1553 since 2006) and more. But one common factor amongst many fires is a dry environment that allows sparks to turn into flames and flames, in some cases, into raging fires. As of June 26 of this year, 2,532 acres of land had been burned by fires in Michigan; the average number of acres burned by fires in Michigan in June is 270. The Wilderness Fire Trail in Crawford County, which was started by a bonfire, burned more than 2,000 acres of land in June, according to the Associated Press. This wildfire contributed to the above average number of acres burned by fire in 2023. Michigan wildfires also drew attention in May, with more than three dozen being reported, according to Bridge Magazine. The cause? Drier than usual weather. According to the National Integrated Drought Information System, May of 2023 was the ninth-driest May in Michigan since the federal government began keeping records in 1895.

With summer just beginning, we are nowhere near being out of fire season. According to the US Drought Monitor, created by the University of Nebraska-Lincoln, much of Michigan is at least abnormally dry, as of June 22, 2023. The western portion of the Upper Peninsula and about a third of the Lower Peninsula (the thumb and the top of the “mitten”) have been deemed “abnormally dry,” and nearly all the remaining portion of the “mitten” (including Wayne County) have been deemed “moderately dry.” There is also an area in mid-Michigan that has been deemed to be in a severe drought; the eastern portion of the Lower Peninsula has no drought conditions.

With drier conditions being a factor in increased fires across the state of Michigan, we must also touch on what is behind the drier conditions. Climate change, driven by increased emissions, pollution and more, can be dubbed as the main culprit behind increased drought conditions in certain areas (and increased drought in other areas, but that is for another day).

In Michigan, average temperatures have already risen 2.5 degrees, with summers being hotter and heatwaves being stronger. Fast forward to 2100, summers in Isle Royale National Park, for example, are expected to be 11 degrees hotter, according to statesatrisk.org.

The chart below shows just how Michigan’s annual daily temperatures have changed since 1900 and how they are expected to change up to 2100, depending on the amount of emissions we continue to pump into the environment (Southeast Michigan has several high emission emitters, as will be discussed in detail in a future post). The observed data is through 2020 and shows that Michigan’s average temperature has increased by nearly 3 degrees (Fahrenheit) over time. According to the data set from The Cooperative Institute for Satellite Earth System Studies and the National Oceanic and Atmospheric Administration (NOAA), even with lower emissions temperatures are expected to increase in Michigan by a minimum of 3 degrees through 2100. That number could increase to at least 12 degrees though if the emissions we produce increase.

With climate change having a direct impact on our environment, it is also having a direct impact on our lives. We know drought can be catastrophic to crops, our food systems and the economy and we know fires cause destruction. It should also be known that fires also have a direct impact on air quality, which affects the lives of all of us.

Next week we will dig into how Michigan’s air quality ranks and how the fires in Michigan, and beyond, have making it much worse in recent weeks.

Southeast Michigan’s Poor Air Quality a Result of Climate Change

Air quality in Southeast Michigan has been notably poor in recent weeks, with three Ozone Action Days occurring in June thus far. According to the Southeast Michigan Council of Governments, Ozone Action season began on May 1 in Southeast Michigan. This year is the 30th year of the voluntary program that helps keep Southeast Michigan’s air clean. In 2022, there were five Ozone Action days.

As we’ve discussed in previous posts, clean air is vital to healthy populations, and in Southeast Michigan clean air has been hard to come in recent weeks. The Canadian wildfires have been the easy culprit to blame for the poor air quality, the real root of the problem goes much deeper….climate change.

Wayne State University Center for Urban Studies Director Lyke Thompson further dives into what is causing poor quality in Southeast Michigan in this recent opinion piece published by the Detroit Free Press.

Signs Show Evidence of an Economic Slow Down in Michigan

Michigan is not experiencing a deep recession but there are signs that the economy is beginning to slow down. From unemployment rates to the cost of housing, the signs of a recession are evident, and according to presentations given at the Detroit Economic Club on April 13, a recession will likely start this summer.

One telltale sign of a slowing economy is an increased jobless rate. In Michigan, the unemployment rate has remained steady, and amongst recent lows, since June of 2022 though. In February of 2023 the state unemployment rate was reported at 4.3 percent. According to the Michigan Department of Technology, Management and Budget, layoffs are occurring though. In through March of 2023, 14 companies sent notices of layoffs or closure notices, or Worker Adjustment and Retraining Notifications (WARN). These 14 companies sent a total of 2,112 notices, with Prospect Airport Services in Detroit sending the most at 516. Comparatively, by the same time in 2022 six companies sent layoff notices and in 2021 three companies had sent layoff notices. Also, according to news reports, General Motors is offering buyouts to up to 3,500 salaried workers, and Stellantis is cutting and consolidating at least 408 positions at the Detroit assembly plants.

While the recent Stellantis layoff notices are not reflected in the most recent Detroit unemployment data, how large companies are restructuring should be kept in mind with a possible recession looming. According to the Michigan Department of Michigan Technology, Management and Budget unemployment in Detroit declined to 7.7 percent in February of 2023; in February of 2022 the unemployment rate was at 12.1 percent.

The chart below provides a more detailed look at unemployment rates throughout Southeast Michigan, both currently and a year ago. According to the data, unemployment rates for all seven counties in Southeastern Michigan were less in February of 2023 than they were in February of 2022. Monroe County had the highest unemployment rates in both February of 2023 and 2022 at 5.1 and 6.2, respectively.  Wayne County had the largest decrease in its unemployment rate between February of 2022 and 2023 at 1.8 percent. In February of 2022 Wayne County’s unemployment rate was 6.2 percent, and in 2023 it was 4.4 percent.

Livingston County continued to have the lowest unemployment rate in the region at 3 percent in February of 2023, followed by Washtenaw County with an unemployment rate of 3.5 percent.

Home prices in Metro-Detroit again decreased in January of 2023, according to the Case Shiller Index. In January of 2023, the average price of single-family dwellings sold was $168,300 , a decrease of $1,190 from the average price of a home in December of 2022. This was the largest decrease in the average home prices in Metro-Detroit since December of 2020.

While the month-to-month trend of prices increasing is easing up a look at data from year’s prior shows just how much prices have increased overall. Between January of 2023 and 2022 the average price increased $4,960; between January of 2022 and 2020 the price increased $39,020 and between January of 2023 and 2014 the average price has increased $74,380.

Opioid Harm Reduction Programs in Michigan as Overdoses Continue to Rise

The fact that Michigan is experiencing an opioid epidemic has been well-established. With fatal overdoses on the rise, particularly in Washtenaw and Wayne counties it is vital to not only acknowledge that the epidemic is in fact in full swing, but that there is hope by way of harm reduction practices. According to the US Centers for Disease Control, “harm reduction is a public health approach that focuses on mitigating the harmful consequences of drug use, including transmission of infectious disease and prevention of overdose, through provision of care that is intended to be free of stigma and centered on the needs of people who use drugs.” Harm reduction activities include naloxone distribution, provision of sterile syringes, education and prevention regarding overdoses and safer drugs and other activities that can lessen the risk of adverse outcomes associated with using drugs. 

Several harm reduction activities are offered throughout Michigan, and administered through various organizations. For example, in Michigan various places have naloxone portal kits that have been distributed through the Michigan Department of Health and Human Services (MDHSS). A naloxone portal kit typically contains two doses of naloxone, two nasal misters and directions on use. Naloxone is a medicine that reverses the effects of opioid overdoses, restoring normal breathing and consciousness of a person experiencing overdose symptoms (Narcan is the nasal spray version of this).

According to MDHHS, Wayne County had the highest number of naloxone kits distributed to various organizations by the end of 2022 at 52,464. Macomb County had the second highest number of kits at 35,328 and Livingston County had the lowest number of kits distributed to various organizations by the MDHHS by the end of 2022 at 2,148. The type of organizations these kits were distributed to include first responders, courts, treatment and recovery centers, correctional facilities, health departments, academic institutions and community organizations and non-profit organizations. Throughout Michigan, community organizations and non-profit organizations received the highest number of kits. Of the 334,152 kits distributed throughout Michigan by the end of 2022, 198,780 (or 59%) of the kits were distributed to community organizations and non-profit organizations, according to the MDHHS.

Academic institutions were also included in the list of organizations that receive and distribute naloxone kits. Through Wayne State University’s Center for Urban Studies, the AmeriCorps Community Training for Overdose Rescue (ACT) administers free training for Southeast Michigan community members to prepare people to provide aid during an overdose emergency while waiting for help to arrive. All training participants receive a free Overdose Preparedness Kit containing Narcan. Such training is part of the Strategies and Tools for Overdose Prevention (STOP) program, which is a harm reduction initiative conducting research, delivering training and distributing naloxone in Southeast Michigan. Since October 2019, the ACT/STOP program through the Center for Urban Studies has hosted 235 overdose rescue training sessions and equipped 3,501 people with the skills and knowledge to provide first aid during opioid overdose emergencies.

Another harm reduction tool for opioid use in Michigan is the standing order issued the by the MDHHS that allows licensed pharmacies to dispense naloxone to the public. Of the percent of registered pharmacies in each of the seven counties in Southeast Michigan, St. Clair County had the highest percentage of pharmacies participating the in the standing naloxone order at 79 percent (26 pharmacies). Wayne County had the lowest participating at 50 percent (319 pharmacies).

An additional harm reduction practice is the existence of Syringe Service Programs. These data below shows the percent of the population within a 15-minute drive of a Syringe Service Program funded by the MDHHS. These programs are considered a form of harm reduction because they offer sterile injection equipment and provide a linkage to substance use disorder treatment.

Washtenaw County had the highest percentage of the population that lived within a 15-minute drive of a Syringe Service Program in Michigan at 82.9 percent. Wayne County had the second highest percentage of the population within a 15-minute drive of a Syringe Service Program at 81.7 percent.

Livingston County had the lowest percentage regionally with 0.5 percent of the population being with a 15-minute drive to a Syringe Service Program. While this percentage was much lower than the other counties’, Livingston County had the 53rd highest percentage of the population within a 15-minute drive to a program.

The use of Buprenorphine is harm reduction to meant to treat opioid disorder.  Buprenorphine is a medication approved by the Food and Drug Administration to treat opioid use disorder.

In Southeast Michigan, Monroe County had the highest Buprenorphine prescription unit rate per 1,000 people in 2020 at 3,950.5, followed by St. Clair County with a rate of 2,978.5. Higher rates of Buprenorphine are viewed as favorable in the calculating the MI-SUVI rate because the drug aims to treat addiction. Oakland County had the lowest Buprenorphine prescription rate at 1,485.6 per 1,000 people.

The Buprenorphine rate is based on the prescription units.

As shown, harm reduction programs and policies are in motion in Michigan. And while opioid use still continues, these approaches, according to the CDC, have been proven to prevent death, injury, disease, overdose, and substance misuse.

Even with such programs in place, overdoses do still occur. It is important to be aware of the signs and to know what to do in the event someone has overdosed. According to the ACT/STOP training, signs of an opioid overdose are:

  • Pinpoint pupils
    • Not breathing normally (infrequent or no breathing at all, deep snoring or gurgling)
    • Pale – lips and fingertips may be blue/gray
    • Not responsive to touch or sound
    • Signs of substance use around: syringes, pill bottles, other substances.

Should someone be experiencing an overdose, you should decide to help. Michigan’s Good Samaritan Laws protect you from legal action and lawsuits if unintended consequences result from your assistance.

Ways to help include, if someone is not breathing normally, begin hands-only CPR right away and call 911 immediately. If someone is unconscious but breathing normally, administer Narcan then place them in the recovery position.

For more information on Wayne State University Center for Urban Studies’ ACT program click here. You can also find information on Syringe Service Programs and how to receive naloxone here.

Synthetic Opioid Overdose Deaths in Michigan Continue to Rise, Outpace Other Opioid Related Deaths

Michigan’s opioid epidemic is no secret, and it is not just prescription pills that are contributing to the rise in overdoses. Opioids include prescription pain relievers such as oxycodone (Oxycontin), hydrocodone (Vicodin), codeine, morphine, fentanyl, methadone, and the illegal drug heroin. However, pain killers that are not prescribed or are used outside of the prescription are considered illegal. Furthermore, pain killers such as fentanyl are being illegally manufactured and distributed at an increasing rate. As the first chart below shows, the number of overdose deaths for all opioids has increased since 2000, but synthetic opioid overdose deaths have risen the most over the last several years, according to data from the Michigan Department of Health and Human Services.

In 2000 there were 17 synthetic opioid overdose deaths (not including methadone) in the State of Michigan. Comparably there were 60 prescription opioid overdose deaths in Michigan in 2000 and 89 heroin overdose deaths. In 2021 there were 2,287 synthetic opioid overdose deaths, 512 prescription opioid overdose deaths and 145 heroin overdose deaths. In Michigan, synthetic opioid overdose deaths increased the most between 2014 and 2015 and 2019 and 2020. Between 2014 and 2015 synthetic opioid overdose deaths increased by 465 deaths, from 175 overdose deaths to 465 overdose deaths. Between 2019 and 2020 opioid overdose deaths increased by 466, from 1,445 to 1,911. Although heroin and prescription overdose deaths have also increased since 2000, the number of overdose deaths for both categories have not grown by the amounts that synthetic opioid overdoses have, nor have they reached (individually) as high an overdose death number as synthetic opioid overdose deaths.

The yellow line in the chart represents the total number of opioid overdose deaths between 2000 and 2021, as reported by the Michigan Department of Health and Human Services. The yellow line often falls below the total number of opioid overdose deaths calculated when combining prescription and synthetic opioids and heroin. According to the Michigan Department of Health and Human Services, the summing of categories will not always result in more than the number of all opioid drug overdoses and the categories of death are not exclusive as deaths might involve more than one drug.

It is also important to note that prescription overdoses includes both prescription opioid pain relievers (e.g., hydrocodone, oxycodone, and morphine) and opioids used to treat addiction (e.g., methadone)

The first chart shows the sheer number of opioid overdose deaths by category, and the chart below shows the rate of opioid overdoses by category, again highlighting the increase in synthetic opioid overdoses. The rates below are calculated per 100,000 people. Prescription opioids regularly had the highest overdose mortality rate up until 2015. In 2015 the overdose mortality rate for prescription opioids was 4.5 overdoses per 100,000 people and for synthetic opioids the rate was 4.7. From there, the overdose rate for synthetic opioids grew to a rate of 23.9 overdose deaths per 100,000 in 2021. Prescription opioid overdose rates and heroin overdose rates also grew for a few years beyond 2015, both peaking after then. The prescription opioid overdose rate peaked in 2016 at 7.7 and the heroin overdose rate peaked at a rate of 8.2 overdoses per 100,000 in 2017. Overdose rates for prescription opioid overdoses and heroin overdoses have decreased since then.

The data clearly shows opioid overdoses continue to increase in Michigan, and synthetic opioid (such as fentanyl) overdoses are playing a large role in that. An obvious question may be, why fentanyl? Well, fentanyl is a highly potent opioid that only requires people to ingest a tiny amount to overdose.

According to Rutgers University, in many areas, fentanyl has nearly completely replaced heroin and can be found in many counterfeit prescription opioid and benzodiazepine pills bought on the street. Methamphetamine and cocaine may also contain undeclared fentanyl.

As shown, Michigan is not immune to its population gaining access to this highly dangerous drug. And while it is still found on the streets, law enforcement agents are working to stop production and distribution. According to the US Department of Justice, more than 65 kilograms of fentanyl powder and 88,000 fentanyl laced pills were seized by federal agents during May 23 and Sept. 8, 2022. The USDOJ said this was enough to provide 4.7 million deadly dosages.

According to the USDOJ,  fentanyl is 50 times more potent than heroin. Just two milligrams of fentanyl, or the amount that could fit on the tip of a pencil, is considered a potentially lethal dose.

The risk of overdose remains high with opioid use, as do other negative consequences from using opioids. So, while law enforcement officials work to eliminate illegal production, distribution and use of opioids there are also organizations working to help those with an opioid addiction. As we have noted throughout this series, to end the opioid epidemic we need a multi-faceted approach and treating addiction is part of that approach. In our next post we will discuss these programs and their impacts.

Young Females, Black Community Impacted by Opioid Use, Overdose

We know, according to the new Michigan Substance Use Vulnerability Index (MI-SUVI), that St. Clair and Wayne counties are the most vulnerable when it comes to substance use in Southeastern Michigan. Additional data shows that it isn’t just residents of those counties who are vulnerable to opioid use, and related harm, though. Rather the black community and the young female population appear to be amongst the most vulnerable populations when it comes to opioid use, death and related Emergency Department visits.

In general, we know that the number of opioid related deaths are increasing across the State of Michigan.  When examining just the number of opioid related deaths in Southeastern Michigan we also know that Wayne County has the highest number of such deaths, in part due to it having the highest population in the state. However, the chart below shows that in recent years only Wayne and Macomb counties have been experiencing noticeable increases in the number of opioid related deaths. In 2020, Wayne County recorded 706 opioid related deaths and Macomb County reported 269; these are increases from the 660 opioid related deaths Wayne County recorded in 2019 and the 215 Macomb County recorded.  Monroe County also experienced an increase in the number of opioid related deaths between 2019 and 2020.

It should be noted that while the state has some data for opioid related deaths in 2021 it was not accessible at the county level. Additionally, data for opioid related deaths in Oakland County was not available for the year 2018 and beyond; this data was suppressed according to the Michigan Department of Health and Human Services.

As the data below shows, males in Michigan have regularly had a higher number of opioid related deaths as compared to women. In 2021 there were 1,528 opioid related deaths amongst Michigan males and 672 amongst Michigan females. (See the chart below.) In 2000, when the data started to be tracked, there were 98 and 25 opioid deaths, respectively. While the number of opioid related overdose deaths for both males and females has been growing, officials are also zeroing on data related to a specific age group of females.

According to the State of Michigan, in 2021, most overdose Emergency Departments visits among young women and girls were intentional and related to self-harm. According to the State, there were 602 more intentional overdose Emergency Department visits among females between the ages of 11-24 years old than in 2020. This was a 30 percent increase. These data further indicate that only 2 percent of that overdose Emergency Departments visits were related to opioids (40% Non-opioid analgesics, antirheumatics, and antipyretics, 25% were related to anti-depressants and 3% were related to psycho-stimulants).

These data indicate how important mental health is in substance use and addiction. That are many factors that impact a person’s mental health, but this recent study by the State highlights how young women are just one group with an increased risk of substance use and its impacts.

The data below shows the number of opioid related deaths for Black males and females and White males and females to further show the details of opioid death trends. While the raw numbers highlight that White Males have always had the highest number of opioid related deaths (1,199 in 2021), followed by White females (542 in 2021), the number of opioid related deaths in the Black male community are rapidly increasing.

In 2000 there were 32 opioid related deaths in the Black male community and by 2021 that increased to 492. The Black female community had 19 reported opioid related deaths in 2000 and by 2021 that increased to 216. The data clearly shows an increase, but we must also be considered that much of this may be related to measurement or aggregation of the data.

According to the Michigan Overdose Data to Action Dashboard, between August 2021 to July 2022 759 Black Michiganders died from an opioid overdose. According to the National Institute on Drug Abuse, the trend we are seeing in Michigan of increased opioid related deaths is also a national trend. According to the institute, Black individuals in four U.S. states(New York, Massachusetts, Kentucky, Ohio) experienced a 38 percent increase in the rate of opioid overdose deaths between 2018 to 2019. Many of these overdoses were driven by heroin and fentanyl, according to the National Institute on Drug Abuse.
While these numbers continue to increase, the focus on the addressing the forces behind these overdose deaths, including the harm reduction from the drugs themselves and the breakdown of societal structures that contribute to them, are increasing. According to NIDA Director Nora D. Volkow, M.D.,  ”systemic racism fuels the opioid crisis, just as it contributes mightily to other areas of health disparities and inequity, especially for Black people.”
As we have briefly touched on, the way to tackle the opioid epidemic in our state, and our country, is to create multi-faceted policies and programs that directly address specific communities. There is no blanket approach to tackling the opioid epidemic, but as we will show in our next post, several programs in Michigan are making headway.

Michigan’s Substance Use Vulnerability Index Highlights Wayne County as one of State’s Most Vulnerable

In Southeast Michigan, St. Clair and Wayne counties are the most vulnerable when it comes to substance use, according to the Michigan Substance Use Vulnerability Index (MI-SUVI). This index provides a score, balancing the eight factors listed below:

  • Overdose death rate
  • Nonfatal overdose emergency department visit rate
  • Opioid prescribing rate
  • Drug-related arrest rate
  • Percent of the population within a 30-minute drive to a treatment center
  • Percent of the population within a 15-drive drive to a syringe service program
  • Buprenorphine prescribing rate
  • And the Social Vulnerability Index (This is the Centers for Disease Control’s own measure that looks at social detriments to health, like technology access and healthcare access. We explored this in a previous post.)

The scores above are separated into three categories (Burden Rank, Resource Rank and Social Vulnerability Rank), each receiving a score in and of itself. Once the factors and rankings are determined, a final score is then provided to determine the vulnerability of an area to substance use. The factors listed below all use data from 2020, 2021 or an average of 2016-2020.

The information described above is part of the State of Michigan’s new Overdose data to Action Dashboard, which digs deep into the data above, serving as resource to stakeholders across the state who are working to address substance use disorders.

In this post we not only show the percentile rank of MI-SUVI scores for each of the seven counties in the region, highlighting which ones have higher or low index scores, but also dig deeper into the factors behind each score.

As noted, Wayne and St. Clair counties had the highest MI-SUVI index percentile ranks in the region at 97.6 percent and 59 percent, respectively. Wayne County not only had the highest index in the region, but the second-highest in the state (Oscoda County had the highest index in the state at 98.8 percent). In other words, Oscoda County was the most vulnerable county when it came to substance use and Wayne County was the second most vulnerable county.

What contributed to such a high score? Well, as shown through several data points below, Wayne County had the highest fatal and nonfatal overdose rates in the region in 2020 and is in the middle-third of opioid prescriptions issued in a county statewide. Wayne County does provide a greater amount of access to resources that some counties throughout the state and region, but even so, its burden rank weighs heavily on the county’s scoring.

Livingston County had the lowest Michigan Substance Use Vulnerability Index percentile rank at 1.2 percent. Overall, Livingston County ranked 83rd on the MI-SUVI index—there are 83 counties in Michigan. This ranking is because of its low burden and social vulnerability index rankings and its average resource ranking.

Between 2016 and 2020 the five-year average for the number of all fatal overdoses in Wayne County was 42.1 per 100,000 people, according to the Michigan Opioid Data to Action Dashboard.  Wayne County had the second highest fatal overdose rate in the state; Genesee County had the highest rate at 42.9. Regionally, Macomb County had the second highest fatal overdose rate at 37.3 per 100,000.

Oakland County had the lowest five-year average fatal overdose rate per 100,000 people at 13.4.

Regionally, Wayne County also had the highest non-fatal overdose emergency room visit rate per 100,000 people at 427.8. This rate ranked fourth in the state. The drug overdoses counted for this emergency room visit category represents all drug overdoses—not just opioid overdoses. St. Clair County had the second highest non-fatal overdose emergency room visit rate per 100,000 people at 365.8. Livingston County had the lowest rate at 170.3.

The rates for this data set are based on a three-year average between 2016-2020.

For the opioid prescription rate per 100,000 people, it was not Wayne County that had the highest rate regionally, but rather St. Clair County. In 2020, according to data from the Michigan Overdose Data to Action Dashboard, St. Clair County had an opioid prescription rate of 59,685.5. St. Clair County had the 15th highest opioid prescription rate in the state. Wayne County had an opioid prescription rate of 42,580.2 per 100,000 people, which was the 52nd highest rate in the state.

Regionally and statewide, Washtenaw County had the lowest opioid prescribing rate of 19,420.8.

The opioid prescription rate is based on the number of prescription opioid units dispensed to treat pain.

The percent of the population within a 15-minute drive of a Syringe Service Program measure is one of the factors in the MI-SUVI rate because it is a harm reduction indicator. This indicator represents the number of Syringe Service Programs funded by the Michigan Department of Health and Human Services. These programs are considered a form of harm reduction because they offer sterile injection equipment and provide a linkage to substance use disorder treatment.

Washtenaw County had the highest percentage of the population that lived within a 15-minute drive of a Syringe Service Program in Michigan at 82.9 percent. Wayne County had the second highest percentage of the population within a 15-minute drive of a Syringe Service Program  at 81.7 percent.

Livingston County had the lowest percentage regionally with 0.5 percent of the population being with a 15-minute drive to a Syringe Service Program. While this percentage was much lower than the other counties’, Livingston County had the 53rd highest percentage of the population within a 15-minute drive to a program.

Buprenorphine is a medication, approved by the Food and Drug Administration, to treat opioid use disorder. Access to this prescription is also viewed as a harm reduction indicator, which is why it is one of the factors in determining the MI-SUVI rate of a county.

In Southeast Michigan, Monroe County had the highest Buprenorphine prescription unit rate per 1,000 people in 2020 at 3,950.5, followed by St. Clair County with a rate of 2,978.5. Higher rates of Buprenorphine are viewed as favorable in the calculating the MI-SUVI rate because the drug aims to treat addiction. Oakland County had the lowest Buprenorphine prescription rate at 1,485.6 per 1,000 people.

As with the opioid prescription rate, the Buprenorphine rate is based on the prescription units.

The data discussed above provides a fair amount of insight into the ever-growing concerns and consequences of opioid addiction across Southeast Michigan and the state. And while we have a better understanding of what counties are more vulnerable to the impacts of this disease than others, there is still much more to be known. Over the next several weeks we will further examine the hard reduction programs in place—what services they offer, what their impacts are and how they are growing in numbers. We will also dig deeper into who is most impacted by opioid addiction and what factors impact that. And finally, we will discuss the National Opioid Lawsuit and its impact on Michigan and its communities.

Just as with addiction itself, understanding the intricacies of the data presented by the State is vital in establishing a comprehensive and effective plan to reduce the harm, and existence itself, of opioid addiction.

Rate of Alcohol-Induced Deaths Increasing in Southeast Michigan; White Males Have Highest Rates

Statewide, across genders and across racial groups, the rate of alcohol-induced deaths is increasing, according to the Michigan Department of Health and Human Services. This trend is also true for majority of the counties in Southeast Michigan, with the exception of two. Why alcohol-induced deaths are increasing remains unknown, but the data does show that Michigan men had higher rates of alcohol-induced death than women, and White Michiganders have had higher alcohol-induced death rates over the last decade, as compared to their Black counterparts.

Digging further into the data, we know that the rate of alcohol-induced deaths for men in Michigan in 2000 was 10.6 deaths per 100,000 people; by 2021 that increased to 21.7 deaths per 100,000 people. The largest increase for male alcohol-induced deaths took place between 2018 and 2021. Nationally, the New York Times sites a sharp increase in alcohol-related deaths for women. However, as data from the Michigan Department of Health and Human Service shows, while the trend has been steadily increasing since 2000 (rates increased from 3.3 per 100,000 people to 8.8 per 100,000 people), the males in Michigan have experienced the sharpest increase.

The trends amongst the White and Black populations in Michigan is not as straightforward. As noted, the White population in Michigan had the highest alcohol-induced death rate in 2021 at 15.5 deaths per 100,000 people. Since 2000 the alcohol-induced death rate amongst the White population in Michigan steadily increased from 6.3 alcohol-induced deaths per 100,000 people to 15.5. The alcohol-induced death for the Black population has not been as linear. Between 2000 and 2007 the alcohol-induced death rate decreased from 10.5 alcohol-induced deaths per 100,000 to 5.2. Then, between 2007 and 2018, there were both increases and decreases in the alcohol-induced death rates for the Black population, with the 2018 rate being reported at 6.6. Since 2018, the alcohol-induced death rate for the Black population increased from 6.6 to 14.4 in 2021.

Up until 2010, according to the data, Black males had the highest alcohol-induced death rate among Black males and females and White males and females. But, beginning in 2010 and through 2021, White men had the highest rate at 22.2 per 100,000 people in 2021. When examining the female population, it was often a trade-off from year-to-year whether it was the Black or White female population with the highest alcohol-induced death rate. In 2021, Black women had the highest rate at 9.4 deaths per 100,000 people.

When digging into the more local data, it is St. Clair County that regularly had the highest alcohol-induced death rate since at least 2007, despite Livingston County having the highest local rate in 2021. In 2021, the alcohol-induced death rate for Livingston County was 18.2 alcohol-induced deaths per 100,000 people. In 2018, Livingston County had an alcohol-induced death rate of 3.3 and by 2021 it had spiked to 18.2.

St. Clair County had the second-highest rate at 16.9. Wayne County, with Detroit data removed, had the lowest alcohol-induced death rate at 12; Detroit’s alcohol-induced death rate in 2021 was 13.3.

Despite St. Clair County regularly having the highest alcohol-induced death rate over the last decade, there was a decrease between 2020 and 2021. Monroe County also experienced a decrease in the alcohol-induced death rate between 2020 and 2021.

Overall, the trend of alcohol induced death rates increasing is evident. Exact reasons for it remain unknown, but publications touch on mental health, the pandemic and genetics as reasons. While trying to better understand the “why,” policies can also be put in place to help curb increasing rates. Some policy recommendations from the American Public Health Association include increasing alcohol taxes at the federal, state and local levels, limiting the number of stores that can sell alcohol in a community (and limiting clustering of such stores), lowering the Blood Alcohol Content level for drunk driving, increasing public awareness campaigns (similar to what has been done in the tobacco industry).  Strategies need to simultaneously occur at the individual-community-population level to ensure a holistic approach that is long-term and impactful.

Metro-Detroit Economic Indicators: Home Prices Dropping, Personal Debt Increasing

Unemployment rates for both the State of Michigan and the City of Detroit hit record lows in the second quarter of 2022.

In December of 2022 the unemployment rate for the State of Michigan was 4.3, which is inline with the State’s unemployment rate since March of 2022. In that time frame the unemployment rate for the state has only slightly fluctuated between 4.4 and 4.1 percent. For the City of Detroit, the unemployment rate for November of 2022 (December data was not yet available) was 6.4 percent.

The unemployment rate for Detroit has been regularly declining since May of 2022 when the rate was reported at 10.5 percent. In November of 2021, the unemployment rate for Detroit spike to 8.4 percent, down from the 10 percent the previous month.

The chart below provides a more detailed look at unemployment rates throughout Southeast Michigan, both currently and a year ago. According to the data, Monroe and Washtenaw counties both had higher unemployment rates in November of 2022 than in November of 2021. For Monroe County there was only a 0.1 percent increase in the unemployment rate, with it being reported at 3.9 percent in 2021 and 4 percent in 2022. For Washtenaw County there was a 0.3 percent increase between November of 2021 and 2022. In 2022 Washtenaw County had the third highest unemployment rate in the region, falling only behind Monroe and Wayne counties. The unemployment rate for Wayne County in November of 2022 was 3.7 percent, which was the below the 5.7 percent unemployment rate the county reported in

Livingston County continued to have the lowest unemployment rate in the region at 2.1 percent in November of 2022, followed by Oakland County with an unemployment rate of 2.3 percent.

The charts below show the percent changes in the Consumer Price Index (CPI) on a month-to-month basis and a year-to-year basis for each month in years 2019, 2020, 2021 and 2022 in the Midwest Region. The CPI is a measure that examines the weighted average of prices of consumer goods and services, such as transportation, food, energy, housing and medical care. It is calculated by taking price changes for each item in the predetermined group of goods and averaging them.

The first  chart below highlights how the CPI changed on a month-to-month basis between 2019 and 2022. Currently in 2022, the region’s prices were down 0.5 percent in the month of December. The highlights for the change include:

•Food prices increased 0.3 percent for the month of December. Prices for food at home (groceries) and away from home (restaurants) both increased 0.3 percent.
•The energy index decreased 7.2 percent in December largely due to a 15.9 percent decrease in gasoline; prices for natural gas service increased 2.8 percent though and electricity increase 1.5 percent
•There were decreases in  the cost for used cars and trucks (-2.4 percent), apparel (-1.8 percent), public transportation, and medical care (-0.3 percent).

When examining the second chart, which shows how prices changed on a year-to-year basis,  we see how prices remain higher than 2019 and 2020 but that there was a decline in the CPI for the month of December between 2021 and 2022.

In December of 2022 the CPI was reported to be 6 percent above what it was the year prior. Contributing factors to the continued increase in the CPI include

•Food prices increasing 11.4 percent over the last year, with at home food prices increasing 13 percent
•Energy prices increasing 5.3 percent over the last year, with the largest contributor being natural gas (16 percent price increase)
•Rent prices increasing 7 percent
•Recreation prices increasing 6.8 percent
•The cost of used cars and trucks decreasing 9.1 percent.

While home prices in Metro-Detroit continue to increase from one month to the next, the rate at which they are increasing is beginning to taper off. According to the Case-Shiller Home Price Index, the average price of single-family dwellings sold was $168,790 in October of 2022, a decrease of $450 for the average price of a home in September of 2022. This is the first there has been a decrease in the average home price in Metro Detroit since August of 2019. At that time home prices decreased $129,220 to $127,290. Since then though, the average price of a home continued to increase until October of 2022.

While the month-to-month trend of prices increasing broke, a look at data from year’s prior is a reminder just how much the average price of a home has increased. Between October of 2022 and 2021 the average price increased $9,200 and between October of 2022 and 2014 the price increased $70,570.

Debt for Michigan residents continues to grow, according to recent reports from the Federal Reserve Bank of New York. According to the data, the Michigan Per Capita Debt Balance came in at $44,370 at the end of the third quarter of 2022; this is an increase from the $44,130 Michigan Per Capita Debt Balance at the end of the second quarter in 2022 and from the  $41,200 debt a year prior. Overall, the Michigan Per Capita Debt Balance increase 7.69 percent between September of 2022 and September of 2021.

According to WalletHub, $86 billion in new credit card debt was incurred in 2021 in the US. A recent CNBC article noted how household debt has increased at its fastest pace in 15 years, a trend that is further demonstrated in the chart below.  Reasons for the fast-paced increase in debt include inflation and rising interest rates.