Climate Change in Michigan–Now and in the Future

Climate change is multi-faceted in both its causes and effects. In Michigan, and more specifically Metro-Detroit, many of the causes of these drastic shifts in weather patterns are the same across the globe— the continued use and overuse of fossil fuels, increased carbon emissions, desecration of natural resources. What are the effects?

Increased Average Temperature

Temperatures have already risen 2.5 degrees in Michigan. Summers are hotter, and heatwaves are stronger and last longer. Fast forward to 2100, summers in Isle Royale National Park are expected to 11 degrees hotter, according to statesatrisk.org.

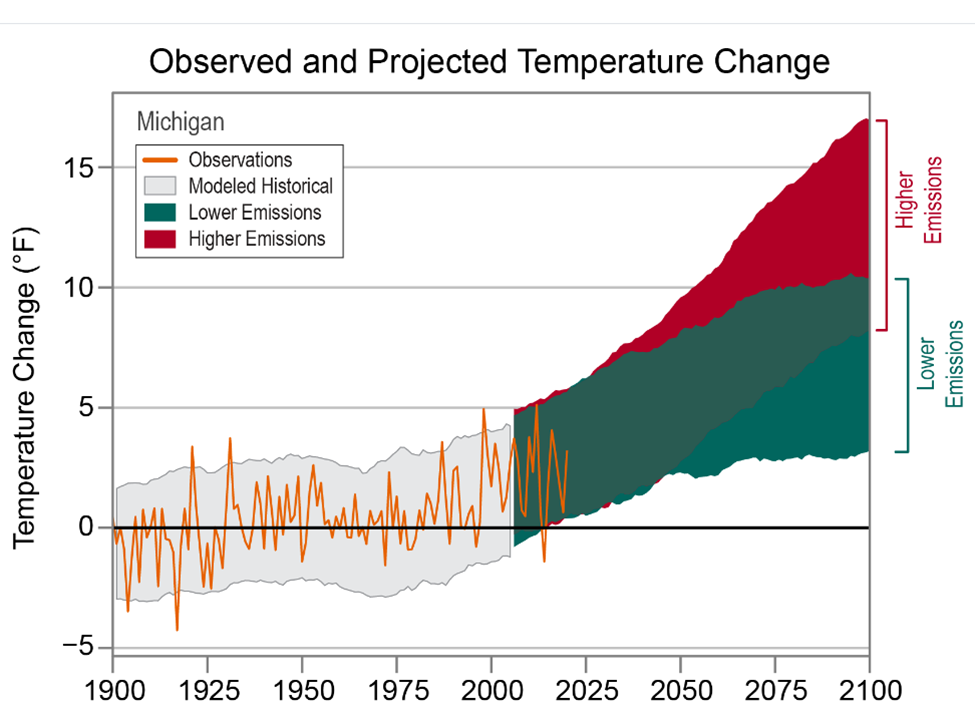
The chart below shows just how Michigan’s annual daily temperatures have changed since 1900 and how they are expected to change up to 2100, depending on the amount of emissions we continue to pump into the environment. The observed data is through 2020 and shows that Michigan’s average temperature has increased by nearly 3 degrees (Fahrenheit) over time. According to the data set from The Cooperative Institute for Satellite Earth System Studies and the National Oceanic and Atmospheric Administration (NOAA), even with lower emissions temperatures are expected to increase in Michigan by a minimum of 3 degrees through 2100. That number could increase to at least 12 degrees though if the emissions we produce increase.

Increased Flooding

With increasing temperatures that means hotter air, which holds more water. More water means storms produce heavier rainstorms that are slower to move on, meaning greater accumulations of rain.

In 2020 30,000 residents of Southeast Michigan found their homes flooded. Six years earlier, in 2014, there was another great flood—these 100 year events happened within six years of each other.

According to the June 2021 report “Household Flooding in Detroit” by Healthy Urban Waters, in partnership with the Wayne State Center for Urban Studies and others, 43 percent of 4,667 Detroit households surveyed between 2012-2020 reported household flooding. Furthermore, in an online Detroit Office of Sustainability survey published in 2018, 13 percent of those survey reported they experienced flooding very often; 23 percent reported they experienced flooding somewhat often and 32 percent reported they experienced it occasionally. Additionally, a cross-sectional study published in 2016 of 164 homes in Detroit’s Warrendale neighborhood indicated that 64 percent of homes experienced at least one flooding event in during that, with many experiencing three or four events, according to the report.

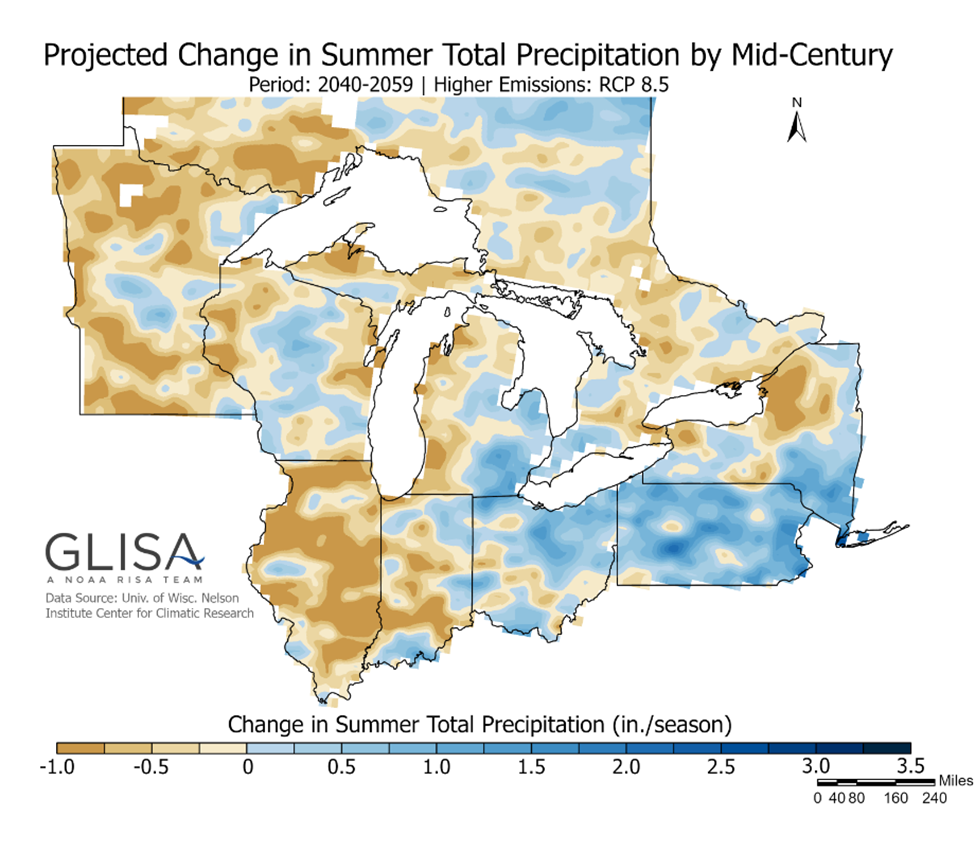
The map below is a projection map developed by the Great Lakes Integrated Sciences and Assessments group that shows how precipitation is expected to increase in Southeastern Michigan and the middle of the state to about 2.25 inches between 2040 and 2059 with increased emissions. While Southeastern Michigan will face continued potential flooding events, the data prediction also shows that the western side of the state will have a decrease in precipitation.

An Increased Number of Heat Islands

A heat island, according to the US Environmental Protection Agency (EPA), is an area where heat is intensified due to structures, such as buildings and roads, that absorb and re-emit the sun’s heat far more than natural landscapes, such as forests and bodies of water. Urban areas, where these structures are highly concentrated and greenery is limited, become “islands” of higher temperatures relative to the outlying areas. Temperatures in such heat islands can be 1 to 7 degrees higher than neighboring areas. The Detroit metropolitan area contains heat islands.

Heat islands can be problematic, according to the EPA, because they can lead to increased energy consumption, increase the emissions of air pollutants and greenhouse gases and compromise water quality—all of which just further perpetuate climate change. Additionally, heat islands can have negative effects on human health. 

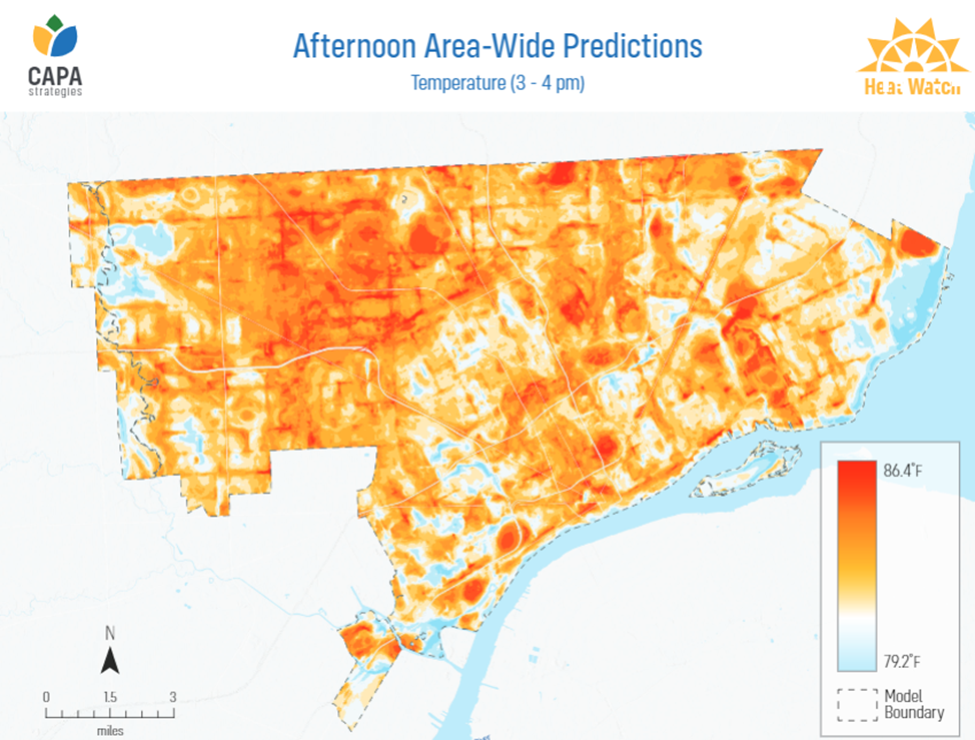
The map below was developed by the CAPA Heat Watch program, through a partnership with the National Integrated Heat Health Information System, NOAA Climate Program Office and the National Weather Service. This map was created from 2020 data and highlights how afternoon temperatures varied depending on the land coverage. For example, on the east side of the City, closer to the river, those areas have greater tree coverage so therefore tend to have cooler temperatures. However, areas with fewer trees, denser residential areas and wider streets have higher temperatures. As noted, this is how heat islands are created and these exist, for example, across the river from Belle Isle and several pockets on the City’s west side.

 Less, or More, Ice Coverage

According to the GLISA, the depth of a lake impacts how rapidly ice can form. So with a shallower lake, there is a greater chance of ice coverage. While depth impacts the ability for a lake to freezer over so does temperature, and with temperatures above freezing there is less to no ice coverage.  Less ice means moisture evaporates into the atmosphere easier, leading way to increased amounts of snow and rain in Michigan.

Also, according to the GLISA,  water temperatures in the fall determine the amount of evaporation from the lake surface because the temperature difference between the air and lake surface temperatures can accelerate evaporation, with warmer water temperatures resulting in greater evaporation. According to the GLISA, “the evaporation removes latent heat from the surface, resulting in a cooling of the surface, and the potential for greater ice cover. For example, if the previous winter experienced low amounts of ice cover (more solar warming), higher evaporation rates (strong cooling effect) during the fall would lead to increased ice cover the next winter. Conversely, cooler water temperatures during fall leads to lower evaporation rates (less cooling) thereby decreased ice cover.”

The effects of climate change on Michigan and Metro-Detroit are apparent with impacts on the daily lives of many. Over the next year we will dig into some of the major contributors to climate change in the region, what policies are being developed to combat the impacts climate change (and how they will work) and what the future of Metro-Detroit may be with a new climate to adapt do.


Is the Future of Southeast Michigan’s Public Transportation Regional?

The Regional Transit Authority, which is charged with coordinating regional services and developing rapid transit along Woodward, Gratiot and Michigan Avenue corridors in Macomb, Oakland, Washtenaw and Wayne counties, placed a millage on the ballot in 2016 to support such operations. That millage failed and while the sentiment for public transportation in the region has seemed to increase, we are now left wondering whether it is simply public transportation that has garnered more support, or if it is regional transportation.

Millages supporting SMART (the Suburban Mobility Authority for Regional Transportation) passed in Wayne, Oakland and Macomb counties in the November 2022 election. Since 1995 each of the three counties have passed such millages every four years to support this local transit authority, although in 2022 the margins for approval of these millages was higher only higher for Macomb County as compared to the approval rates in 2018. None the less, the millages were approved in all three counties, again, such consistency is about to change—whether it’s for the long-term better or worse remains unknown though.

For the short-term, the millage renewals will continue to support public transportation throughout Wayne, Macomb and Oakland counties, and will allow for services to be expanded. Oakland County is the key example of where services will be expanded. Once an “opt-out” county, where each municipality could decide if it wanted to leverage tax dollars to support the public transportation service, Oakland County is now a fully opt-in community. Along with ballot language that gave way to Oakland County being an opt-in county, the now approved millage language also gave way to a 10-year countywide transit millage that will levy 0.95 mills a year starting in 2023. For a home valued at $200,000 (or a home with an SEV of $100,000) the homeowner will pay $95 a year to support the newly approved SMART millage. The Oakland Transit Millage will not only support SMART but also the North Oakland Transportation Authority (NOTA), the Western Oakland Transportation Authority (WOTA) and the Older Persons Commission (OPC) in the Rochester area.

According to Oakland County, these funds levied through the approve transit millage will support services that specifically benefit Oakland County residents and businesses. With the approved millage, Oakland County transit is expected to bring in in about $66.1 million in the first year. According to Oakland County, of those funds, SMART would receive $33.3 million to maintain service and expand routes, the OPC would received $1 million, and the North and West Oakland Transportation Authorities would each receive $2 million. Additionally, $20.4 million will be allocated for new services—with the breakdown being $3.2 million for paratransit, $3.5 million for micro transit, $12 million for more routes and $1.7 million for improvements on existing routes.

Macomb County is another fully opt-in county and has been one since 1995. In November of 2022 Macomb County also approved a 0.95 millage for transit but for five years; traditionally the millages were for four years. The most recent millage passed by 66 percent; in 2018 the millage passed by a margin of only 23 votes. With the passage of this millage, the funds are to support new routes, increased access to on-demand service and improved average wait times, according to SMART.

Wayne County is now the only opt-out county that SMART services. This November voters of opt-in communities approved a four-year 0.994 mill levy that will raise about $20.2 million in its first year, according to Wayne County. In Wayne County, there are 25 communities that opt-in to SMART services, according to the SMART website. Detroit is not an opt-in community as it has its own transportation network serviced by the Detroit Department of Transportation (DDOT).

DDOT and SMART services do overlap in some areas, allowing users to easily travel to-and-from the state’s largest city on direct routes from certain other suburban communities; many of these stops are located along Gratiot, Michigan and Woodward avenues.

While transit in Macomb, Oakland and Wayne counties received continued support in the November 2022 election, the Ann Arbor Area Transit Authority did too in the August 2022 election. A new 2.38 millage was approved by Ann Arbor and Ypsilanti voters to support TheRide, which is operated by the AAATA. This five-year millage aims to improve and expand public transit service in the area. In addition to the passage of this millage, the Southeast Michigan Council of Governments also granted funds to support increasing transportation services between the cities of Ann Arbor and Ypsilanti, along with Ypsilanti Township.

Between the AAATA, SMART, DDOT, NOTA, WOTA, OPC and then Livingston County’s Livingston Essential Transportation Service (LETS), Monroe County’s Lake Erie Transit service and St. Clair County’s Blue Water Area Transit services there are at least nine different public transportation providers in the seven-county region. Then, there is also the RTA, which is meant to oversee the yet-to-be developed regional services, and has the ability to leverage additional transportation millages if approved by voters (and voted to be placed on the ballot by RTA and county leaders)

So, while the recent transit millage approvals highlight increased support for public transportation in Southeast Michigan, it also seems the infrastructure for our fragmented public transportation network is only strengthening. Various mobility options must certainly be made available to meet the differing needs of the population, but benefits may be had when our public transportation and connectivity options are guided by a regional, forward-thinking mission.

Revisiting the November Election as we Enter the 2023 Legislative Term

First the first time in about 40 years, Democrats will control the upcoming legislative session with Gov. Gretchen Whitmer winning re-election with 54.5 percent of the vote, Democrats winning 20 of the 38 seats in the State Senate and also winning 56 of the 110 seats in the State House of Representatives, according to official Michigan election results.

Prior to the election there was a buzz that Republicans may not only keep control of the legislature but also take control of the Governor seat (and the Secretary of State and Attorney General seats as well). But, that was not the case.

Some facts about the 2022 Gubernatorial Election as it pertains to Michigan, and Southeast Michigan?

Gov. Whitmer won 54.5 percent of the statewide vote and Republican opponent Tudor Dixon won 43.9 percent of the vote, according to official election results. In Southeastern Michigan four of the seven counties in the region voted in favor of Whitmer; those same counties also had a majority percent of voters vote straight party ticket for Democrats over Republicans. The voter counties in the region that voted in favor of Whitmer, and Democrats in general, were Macomb, Oakland, Washtenaw and Wayne counties.

Gov. Whitmer took the highest percentage of votes in Washtenaw County at 75.1 percent; 75.3 percent of Washtenaw County also voted straight party ticket for the Democrat party.

In Macomb County, which Gov. Whitmer also won in 2018 but where former President Donald Trump (R) won in 2016, Gov. Whitmer increased the percentage by which she won from the last time. In 2022 Gov. Whitmer took 51.8 percent of the vote in Macomb County. And, while this county did go blue, it had the lowest percentage of Democrat votes as compared to the other three counties in the region that also went blue. In Wayne County Gov. Whitmer garnered 70.8 percent of the vote and in Oakland County she garnered 61 percent of the vote.

Reports indicate that garnering majority of the votes from Macomb and Oakland counties played key roles in Gov. Whitmer’s win. According to MLive, the last time a candidate won the governor’s election while losing Oakland County was in 1982.

On the other side, of the seven counties in the region it was Livingston County where Dixon garnered the highest percentage of votes at 65.5 percent. In St. Clair County she had 57.8 percent of the vote and in Monroe County she had 55.5 percent of the vote.

St. Clair County had the highest percentage of straight party ticket Republican votes at 64.4 percent.
When examining the results for the State legislature we know that nearly a majority of those who returning to the State legislature are incumbents ( 53 incumbents in the 110 person House of Representatives and 22 incumbents in the 38 person State Senate). Furthermore, of the 53 House of Representatives incumbents, 20 are Democrats and 18 are Republicans. The make up of the 22 State Senate incumbent roster is 11 of whom are Republicans and 11 who are Democrats. Overall though, according to Bridge Michigan, 10 percent of incumbents who ran for re-election this year lost in either the primary or general election. One such incumbent at the Senate level was Mike MacDonald (R-Macomb Township). With the redistricting of legislative seats, MacDonald faced (state legislator) newcomer Veronica Klinefelt (D); Klinefelt garnered 53 percent of the vote and MacDonald garnered 42 percent.
As noted, Macomb County went blue for several state related races, but at the local level the Macomb County Board of Commissioners remains controlled by the Republicans and at the Congressional level a Republican won the race for the new 10th Michigan Congressional District.  

In Macomb County, Congressman-elect John James (R) won 48.6 percent of the vote and his opponent Carl Marlinga (D) took 48.4 percent of the vote in Macomb County. For the entire district, which spans into the Rochester area as well, Marlinga won 48.8 percent of the vote.

With the next legislative term ready to begin, agendas and priorities are already being discussed at the national, state and local levels. Key priorities Drawing Detroit will be giving keen attention to in the coming year include climate change topics such as heat islands, flooding, changing water, carbon and temperature levels, electric vehicle fleets and more.

Right-to-Work, A Michigan Legislative Priority Come 2023?

Michigan’s Right-to-Work Law may very well be a legislative priority come 2023.

The Right-to-Work law was approved in 2012, allowing workers to opt out of paying dues in union represented jobs while still receiving the benefits of being in a union. When Right-to-Work passed Michigan was led by Republicans, but this is about to change in the State.

Following the November General Election there will now be 20 Democrats and 18 Republicans making up the Michigan State Senate and 56 Democrats and 54 Republicans making up the Michigan House of Representatives. Additionally, Democrats continue to hold the top elected seats—Governor, Secretary of State and Attorney General.

With about a month left until the 2023 legislative session kicks off there is speculation that a repeal of this law may be priority for Democrats.

What do we know about unions in Michigan?

First off, organized labor unions were created to advocate for better wages and safer working conditions for employees. In Michigan, some of the largest union organizations include the United Auto Works, the International Brotherhood of Teamsters and the Michigan Education Association.

Since 2010 the percentage of employed individuals in Michigan who are members of unions declined from 16.5 percent in 2010 to 13.3 percent in 2021, according to the Bureau of Labor Statistics.  In 2021 there were about 540,000 union members in Michigan, with an additional 80,000 wage and salary workers also being represented by a union, according to the BLS. The percentage of employees who are in unions in Michigan reached its peak in 1989 when 26 percent of the workforce was in a union. As noted earlier, Right-to-Work was passed in 2012, and union membership has not exceeded the 2012 percent of employee union representation of 17 since then.

The percentage of employed individuals represented by a union has declined in Michigan, but not as much as membership. According to the BLS, in 2021 15.3 percent of employed individuals in Michigan were represented by a union, a decline from the 17.3 percent representation in 2010 and the 16.6 percent representation in 2020.

While union membership and representation has declined over the last decade, the larger argument at the moment (or so it seems) is what would repealing Right-to-Work in Michigan do for the economy?

One argument is that Right-to-Work states have a higher probability of recruiting manufacturing companies, according to a recent Bridge Michigan article. And, while this may be the case, what will be the wages of those jobs and would they attract employees?

In terms of manufacturing jobs, establishments and wages we know that, overall, those have all increased since 2010, as is shown in the charts below with data from the Michigan Department of Technology, Management and Budget.

In 2010 there were 475,671 manufacturing employees in Michigan and by 2021 that number increased to 585,885. There was a dip in the number of employees in 2020; in 2019 there were 625,766 employees and in 2020 that decreased to 584,818. That number is starting to trend upward again.

There has been a steady increase in the number of manufacturing establishments since 2010 as well, with there being 13,860 manufacturing establishments in Michigan in 2010 and 17,837 in 2021, according to the Michigan Department of Technology, Management and Budget.

Finally, the average weekly earnings of manufacturing employees have also increased since 2010 but they have not kept up with inflation. As shown in the third chart below, the average weekly earnings of a manufacturing employee in Michigan in 2010 was $1,149, and by 2021 that increased to $1,379. The earnings in that time frame increased by 16 percent but inflation between 2010 and 2021 affected the dollar by 36 percent. In other words, the wage increases did not keep up with inflation.

As political leaders and organizations begin to layout their legislative priorities for the upcoming year it will be interesting to see what tops the list. Area news outlets are reporting that expanding the Earned Income Tax Credit and gun reform are some of the issues that will make its way to the 2023 legislative sessions. At the national level, according to a New York Times article, applications for union elections this year are on pace to approach their highest level in a decade, and according to an August, 2022 Gallup Poll 71 percent of Americans currently approve of labor unions, and 40 percent of union members say their membership is “extremely important.“

Whether or not Right-to-Work will resurface as a top issue in Michigan remains unknown though.

Small Businesses Growth in Michigan is Occurring, But at What Pace?

The growth of small businesses, or lack thereof, in Michigan varies depending on the sources.

While we know business closures have declined since the height of the pandemic and business applications continue to be submitted, anecdotes around employment in Southeastern Michigan tell a story that larger companies, which often have the capacity to offer higher wages and additional benefits, are gaining and retaining more employees than smaller businesses.

The data that we do know is that, according to a May 2022 press release from Gov. Gretchen Whitmer’s office there are 902,000 small businesses in Michigan which employ 1.9 million individuals.  We also know that unemployment in Detroit and Michigan has seen an overall decline. In September of 2022, according to the Michigan Department of Technology, Management and Budget the unemployment rate for the City of Detroit was 7 percent; the unemployment rate for the State of Michigan was 4.1 percent. These are two of the lowest unemployment rates each area has seen in over two years. When comparing unemployment rates by county between September of 2021 and September of 2022 we again see that unemployment rates for September of 2022 were down from the year prior. Overall, Livingston County had the lowest unemployment rate of 2.1 percent in September of 2022 and Wayne County experienced the largest decline with its unemployment rate changing from 7.3 percent in September of 2021 to 4 percent in September of 2022.

While low unemployment rates are one sign of a strong economy, according to a recent Detroit News article, 88 percent of respondents in a Goldman Sachs survey said small businesses are struggling compared to larger businesses. The reason? According to the survey, 42 percent of respondents said they lost employees to larger businesses that are paying more. With inflation continuing to rise, this is not surprising.

However, despite such challenges laid out by survey respondents, according to the 18th Annual Small Business Association of Michigan Entrepreneurship  Score Card, since 2020 small businesses in Michigan have outperformed the U.S. as a whole in terms of percent growth in businesses open and business revenue.

According to the scorecard, between January of 2020 and Feb. 6, 2022 small businesses in the State of Michigan have opened at a rate of 8.5 percent. In the U.S. small businesses have opened at a rate of 3.1 percent in that time frame. The Michigan rate represents an increase in small business revenue of 24.2% compared to 8% for the U.S., the report stated.

As displayed in the first chart below, the Southeast Michigan Council of Governments (SEMCOG) obtains data for the U.S. Census Bureau on small business applications in Michigan. According to this data, there 730 High-prosperity Business Applications during the week of November 18, 2022 and 250 Small Business Applications with Planned Wages. While the data for each category can shift somewhat dramatically from week-to-week, there is an overall trend of business applications in Michigan increasing since September of 2022 yet decreasing from both earlier in 2022 and since the beginning of the pandemic.

According to SEMCOG, high-Propensity Business Applications (HBA) are applications for a federal Employer Identification Number (EIN) where the characteristics of the application indicate that it is more likely to form a business with payroll. Businesses Applications with Planned Wages (WBA) are a subset of HBA that indicate a first wages-paid date, increasing the likelihood that such a business will have a paid employees.

While the data shows businesses continue to open in Michigan, business closures slowed through April of 2022 (The last time such data was available through SEMCOG) compared to early on in the pandemic. According to SEMCOG data obtained from through the Census Bureau’s Small Business Pulse Survey, 4.3 percent of the 900,000 single-location businesses sample size closed during the week of April 9, 2022. The highest percent closure of this sample size was 9.2 percent during the week of November 20, 2020.

One way to help keep small businesses open is to shop local. This is the goal of Small Business Saturday, which occurs the Saturday after Thanksgiving. This is a campaign that American Express began in 2010 to help support small businesses in the midst of the Great Recession. It has certainly seen success over the years, with 51 million shoppers in the U.S. spending more than $23 billion at small businesses in 2021, according to American Express. However, the real takeaway here should be that for every $1 spent at a small business, it is estimated that $0.68 of those funds remain in the local economy (or, for every $100 spent, $68 remains in the local economy). This is something we should consider as part of our regular shopping habits, and not just one day a year.

Thanksgiving is a Little More Costly This Year

A traditional 10-person Thanksgiving dinner will cost the chef, on average, $64.05 total, or about $6.41 per person. This cost is up 20 percent from last year. Of the key ingredients for Thanksgiving dinner cubed stuffing has experienced the largest percent increase in cost. In 2022 it cost, on average, $3.88 for 14 ounces of cubed stuffing; this is a 70 percent increase in cost from 2021. Pie shells and whipping cream had the second highest percent increase in cost 2021 and 2022 at 26 percent.

The main ingredient for Thanksgiving is obviously turkey, and for 2021 a 16-pound turkey, on
average, costs $28.96, which is about a 20 percent increase from 2021. The only item on the traditional Thanksgiving dinner list to decrease in cost from 2021 is fresh cranberries. Twelve ounces of fresh cranberries cost $2.57 this year, a decrease of 14 percent.

The information provided in this post from the American Farm Bureau Federation.

Deer Numbers in Michigan Continue to Grow

Deer season is open in Michigan once again, and this year it is estimated that there are more deer and fewer hunters. According to the Michigan Department of Natural Resources there are about 2 million deer in Michigan currently (2022), and 10 years ago the deer population was estimated to be about 300,000. And, as the number of deer have increased the number of deer hunting licenses in Michigan have decreased, yet the number off deer-vehicle crashes have increased.

Beginning with hunting license data, the number of hunting licenses issued in the State of Michigan has been declining for several years, at least. According to the Michigan Department of Natural Resources, there were 732,163 hunting licenses issued in 2017 and by 2021 that number declined to 641,588. For 2022, 460,436 hunting licenses has been issued as of Oct. 31, 2022.

According to a 2021 MLive article, two reasons for the decline in hunting is that both access and time is dwindling. In other words, people are growing too busy to spend time to hunt and hunting locations are declining for some too.

So, with the decline in deer hunters there has been an increase in Michigan’s deer population and an in deer-vehicle traffic accidents. In 2021, there were 52,218 deer-vehicle traffic accidents, with the greatest number of accidents happening in November, according to Michigan Traffic Crash Facts. In general, there were more crashes in the winter months when the days are shorter and when rutting season (essentially mating season occurs). Since 2011, 2019 was when there was the greatest number of deer-vehicle accidents at 55,531.

Furthermore, in 2021, of the seven counties in Southeastern Michigan, Oakland County had the highest number of accidents at 1,853. It should be noted, Oakland County also has a higher population than all the other counties except Wayne County. However, Wayne County reported 511 deer-vehicle accidents in 2021. Wayne County also has more densely populated areas.

Not only have deer-vehicle traffic crashes increased overtime, but an increase in deer populations can also damage an ecosystem as the deer can decimate certain plant species (for food), including those in residents’ yards. Concentrated deer populations are also more suspectable to disease. So, the increased visibility of deer, along with the issues they can bring, has brough about outcries from local communities for area leaders to find a fix. In Southfield, voters approved an advisory measure to reduce the city’s deer herd by human, lethal manners. This advisory deer culling measure received 62 percent of the vote in the Nov. 8, 2022 election. Other communities that have taken action to reduce its population include Ann Arbor and Grosse Ile.

The Southeast Michigan Council of Governments also has taken interest in the region’s growing deer population and its impact on residents, traffic and land management. It recently created a survey asking area how communities several questions regarding their experiences with deer in their communities and what their concerns about deer are. The survey is now closed, but SEMCOG leaders are hoping its results will help lead to additional solutions to the area deer problem.

Point in Time Count Shows Homelessness in SE Michigan Declining…Is that Really the Case?

Funding into social service resources are slowly dwindling, and the number of those without permanent shelter may be growing. Throughout Southeastern Michigan, we know that the demand for food at local food pantries/non-profit organizations is increasing (read our recent post about that here), and, so is the need for both temporary and permanent housing, according to area homeless shelters.

Over the last few years we have experienced a global pandemic, and in reaction the federal government distributed one-time funds and approved moratoriums on policies (evictions, water shut offs and more) to help boost social services and protect some of our most vulnerable populations. As the veil of the pandemic continues to lift so are many of protections put in place to help our vulnerable populations (or funding is declining).

According to the U.S. Department of Housing and Urban Development (HUD), an individual is defined as homeless if they lack a fixed, regular, and adequate nighttime residence and their primary nighttime residence is not meant for human habitation, such as under bridges or in vehicles.

The Point In Time Count is a count of people who are experiencing homelessness on one night in January. It provides a snapshot on the homeless population in an area, but it is by no means all encompassing. While the count is unable to account for every person experiencing homelessness, it also differs on the type of homeless population that is accounted for in each area. For the eight different areas examined in the chart below only three looked at the homeless population that was only sheltered on the night of the count (Detroit, Macomb and Oakland counties); three counted the population that was both sheltered and partially unsheltered (Wayne, Genesee and Washtenaw counties); two counted the homeless population that was both sheltered and fully unsheltered (Monroe and Livingston counties).

The data for the Point In Time Counts is collected by volunteers who collect information from emergency shelters, transitional housing and safe havens. There is also an attempt to collect data on the unsheltered population, but this can be more difficult as it generally involves volunteers traveling to places where people experiencing homelessness are expected to be (under bridges, encampments, etc). 

The data below is the Point In Time Counts for the Southeastern Michigan; however data for St. Clair County could not be immediately found but data for Genesee County was included instead.

The City of Detroit has consistently had the highest documented population since at least 2015, according to the Point In Time Count. However, since 2015 the sheltered number of homeless has declined from 2,597 to 1,293 in 2021. None of the other areas in the region had homeless numbers as high as Detroit. In 2021 the area with the second highest documented number was the Pontiac/Royal Oak/Oakland County region with a sheltered only population count of 333. However, in 2021 it is believed the homeless population was closer to at least  1,228, according to data obtained from the Alliance for Housing Oakland County. According to the Point In Time Count data, the Oakland County homeless numbers have also declined.

Overall, according to the Point in Time Count data, each area examined in this blog post has had a decline in its homeless population between 2015 and 2021. Between 2020 and 2021 each area, except Macomb and Livingston counties, experienced a decline. Macomb County had a 79 person increase in its Point In Time County between 2015 and 2021 and Livingston County had a 30 person increase.

The Point In Time Count helps determine the amount of funding distributed to each community to help combat homelessness. In general, it is difficult to gain a fully accurate count because the homeless population because individuals may find temporary housing on-and-off through friends, families, shelters and vehicles and these individuals can be mobile from one place to the next. But even a snapshot count is vital to help fund programs to alleviate the cycle of homelessness, a cycle that may increase as inflation grows.

The only emergency housing shelter in Livingston County recently shuttered. According to a Michigan Radio news article, the Severe Weather Network Livingston County Homeless Shelter closed due to lack of funds and volunteers and the head of the Michigan Coalition Against Housing fears this won’t be an isolated incident. To alleviate the current homelessness issue, and the larger issue at hand, Eric Hufnagel, head of the Michigan Coalition Against Homelessness suggest public-private partnerships that will create affordable housing, allowing more individuals to permanently get out of the homelessness cycle.
The Michigan Campaign to End Homelessness also sees public-private partnerships and the development of more affordable housing as one means to ends homelessness, according to its Three-Year Action Plan to End Homelessness. The four main strategies of this foundation are to

•Increase access to affordable and attainable housing for all Michiganders experiencing homelessness.
•Use cross-sector collaboration to impact the other Social Determinants of Health that lead to housing insecurity.
•Enhance the homeless service delivery system to better serve those in need.
•Increase prevention and diversion efforts to mitigate the risk of becoming homeless.

As with many solutions, the “fix” to homelessness is multi-faceted.

Michigan’s Potential Future with Nuclear Energy

The consumption and production of nuclear energy is not new in Michigan. In fact, according to the most recent data from Energy Information Administration, Michigan produced more nuclear energy in 2020 than any other kind of energy. At that time, Michigan had three functioning nuclear power plants- Fermi 2, Cook and Palisades. In May of 2022 though the Palisades Nuclear Power Plant, which is located on the west side of the state, ceased operations.

Now, however, Palisades’ operations might re-start. Several lawmakers in Michigan want the nuclear plant to re-open, both for energy and economic purposes. On Sept. 9, 2022 Gov. Gretchen Whitmer sent a letter to the US Department of Energy supporting the new owner of Palisades Power Plant’s (Holtec International) federal grant application to the Civil Nuclear Credit program. This program was established to save “premature” retirements of nuclear reactors due to financial hardships. While Michigan lawmakers, such as Gov. Whitmer, believe the nuclear plant is eligible for the program there are several groups, including the Michigan Sierra Club and Michigan Wildlife Conservancy that believe otherwise.

When the Palisades Nuclear Power Plant closed on May 20, 2022 it closed 11 days early because of the performance of a “control rod drive seal,” according to a press release from the Governor’s Office. It was on May 20 that its fuel supply ran out and the power purchase agreement with Consumers Energy expired. The environmental groups say that the plant isn’t eligible for the federal grant program.

Opponents say ineligibility stems from the fact the plant is in fact retired now, according to the Holland Sentinel, and the program is intended for plants that are still operating. According to the Nuclear Regulatory Commission, it has never received a request to return a nuclear plant to the grid after it has been permanently defueled. If Palisades becomes the first this could mean the 600 jobs lost when the plant closed could be brought back.

Proponents say economic development is a factor to consider when seeking to  re-open the plant as well as the amount of energy produced and consumed. They argue its long-term effects on Michigan and beyond should also be considered.

Data is not yet available to determine how the closure has impacted the state’s energy production and consumption for 2022, but according to the Governor’s Office more than 800 megawatts of nuclear energy was produced by the Palisades plant on an annual basis. And, as the charts below show, the amount of nuclear energy produced in Michigan is equal to the amount consumed.

According to the Energy Information Administration, in 2021, coal provided the largest share of Michigan’s electricity net generation (32%), followed by nuclear energy (30%) and then natural gas-fired power (27%). The data in BTUs was not available for 2021, but the charts below show that in 2021 316.7 trillion BTUs of nuclear energy was both produced and consumed in Michigan.

In the last 20 plus years the amount of nuclear energy produces, and consumed, has grown slightly (except for a production dip in 2009). In 2000, 196.9 trillion BTUs of nuclear energy was produced and consumed in Michigan, and by 2020 that number increased to 316.7 trillion BTUs. It will decline substantially now with the closing of Palisades, a loss of roughly 800 megawatts.

While the reasoning behind the closure of Palisades Nuclear Plant was based on business reasons, its reopening offers the possibility of a non-carbon-based source of electricity. Michigan has a heavy reliance on carbon-based energy.  The goal is for the state to be carbon neutral by 2050, have all coal plants closed by 2035 and to use at least 50 percent of renewable energy for consumption by 2030, according to the MiClimate Plan. Nuclear energy is not renewable, but it is a non-carbon-based source of energy. It’s advocate, the Office of Nuclear Energy, argues:
•It does not produce emissions (nuclear energy produces energy through fission);
•It utilizes a relatively small footprint to produce energy than others sources (more than 3 million solar panels are needed to produce the same amount of power as a typical commercial reactor or more than 430 wind turbines, according to the Office of Nuclear Energy);
•Nuclear fuel is dense so it produces minimal waste.
Opponents support the decommissioning of plants, including Palisades. Their reasoning considers first, the radioactive waste that remains on-site. The waste can remain on site for decades and the storage and removal of the waste is a concern because of potential spills, groundwater contamination and more.
In addition, the risk of an accident at a nuclear plant also causes grave concern for those in the plant and the surroundings of the nuclear power plant, including long-term radioactive pollution of the area—just look at Chernobyl. Recent  threats to Ukrainian nuclear plants raise the specter of new ways that nuclear disasters could occur.  Other concerns are that the mining of uranium is controversial, nuclear plants can be viewed as national security threats, and these plants cost an exorbitant amount to build.
With the pros and cons to nuclear energy fairly well known, now the federal government, the new Palisades’ Nuclear Power Plant owner and the State of Michigan must decide whether redeveloping Michigan’s nuclear energy supply is worthwhile.

Michigan’s Energy Consumption Tops its Production

https://forms.office.com/r/WZB2vvRXNt

In Michigan, we consume more energy, overall, than we produce, and the type of energy we produce is more limited than the types of energy sources we consume. For example, according to the Energy Information Administration (EIA), Michigan does not produce any coal for energy. However, in 2020, according to the EIA, 334.4 trillion BTUs were consumed. The coal powered energy consumed in Michigan is brought in from elsewhere, primarily Wyoming and Montana.

The largest energy source produced in Michigan is nuclear energy, with 316.7 trillion BTUs being produced in 2020. The amount of nuclear energy produced in 2020 is nearly a third more than what was produced in 2000; in 2000 196.9 BTUs of nuclear electricity was produced in Michigan. In the last 20 years, the largest amount of nuclear energy produced in Michigan was 344.2 trillion BTUs in 2011.

In 2020 there were three nuclear power plants in Michigan. However, in May of 2022 one of the nuclear power plants shut down. We will dig deeper into Michigan’s nuclear power next week.

While nuclear energy most recently reigned supreme in energy production totals, at one-point, natural gas was the largest energy source in Michigan. The amount of natural gas energy produced in Michigan reached its peak production at 312 trillion BTUs in 2000. Since then, the amount produced has steadily declined. Between 2007 and 2008 the amount of natural gas produced in Michigan declined from 275 trillion BTUs to 162 trillion BTUs. By 2020, the amount produced was 69.9 trillion BTUs. Overall, between 2007 and 2020 the amount of natural gas produced in Michigan declined by 204.7 trillion BTUs.

In 2020, Michigan ranked 19th in the amount of natural gas produced.

Crude oil production has ranged between 45 and 24 trillion BTUs since 2000, with a steady decline happening since 2013. According to the EIA, Michigan ranked 18th out of the 50 states for crude oil production in 2020. In 2020, 24 trillion BTUs of crude oil was produced.  This is a decrease from the 45.9 trillion BTUs produced in 2000.

Crude oil production in the state comes from reserves; in 2020 about 4.5 million barrels of crude oil were produced compared to the 34.7 million barrels that were produced in 1979.  Please note the chart references BTUs, while barrels of crude oil is another measurement used to detail production of this energy source.
The amount of renewable energy produced in Michigan has grown since 2000, outclimbing energy production numbers of crude oil and natural gas. In total in 2020, according to the EIA, 225 trillion BTUs of renewable energy was produced. While this was a slight decrease from 237 trillion BTUs produced two years earlier, it is still an increase overall in the amount of renewable energy produced.

The highest amount of renewable energy produced by a source was from wood and waste since 2000. In 2020 the amount of wood and waste renewable energy produced in Michigan was 99.4 trillion BTUs, a decline from the 119.5 trillion BTUs in 2018.

In 2002, biofuels did not produce any energy, and by 2020 that number increased to 43.1 trillion BTUs. This was a slight decline from the 50.8 trillion BTUs produced.
 
For “other” renewable energy sources, which include wind, solar and hydroelectric energy, there has been a steady increase in production. There was however somewhat of a spike in 2014 when the amount produced shadowed the amount of biofuel energy produced in Michigan. In 2014 there were 58 trillion BTUs of “other” renewable energy produced in Michigan; in 2020 that number increased to 82.5 trillion BTUs.
While there has been somewhat of a shift in the type of energy produced in Michigan, such as a more nuclear and renewable energy being produced and less natural gas, the overall amount produced has remained fairly stable. The gap between the amount of energy produced in Michigan and the amount consumed has also remained somewhat stable, but large. In 2000, there was a 2,559.8 trillion BTU gap between the amount of energy consumed and produced in Michigan. By 2020 that gap only decreased to 1,975.1 trillion BTUs.

As noted last week, Michigan consumes 240.2 trillion BTUs of renewable energy sources, 100.3 trillion BTUs of natural gas and more than three times those amounts in both coal and oil energy sources. With consumption levels where they are at, and the necessary shift to clean energy sources growing greater and greater, Michigan’s energy policies should also shift. There needs to be further encouragement, and enforcement, of creating more renewable energy production sources in the state, with that energy than being used in-state. Michigan should prioritize consuming the clean energy it produces and increasing such production.