Sewage Overflows Continue in Southeastern Michigan as Storm Severity Increases

Summer storms have brought on many issues this year, including flooding and long periods without power. Another affect of the heavy rain though is increased sewage overflow into our local rivers and lakes, which also means increased risk of contaminated waters. The Michigan Department of Environment, Great Lakes and Energy tracks discharges by three different categories: combined sewer overflow (CSO), sanitary sewer overflow (SSO) and retention treatment basin overflow (RTB). Each of these are  discharges from a sewer system which contains untreated or partially-treated sewage. CSOs are discharges from older sewer systems designed to carry both domestic sewage and storm water, collectively referred to as combined sewage. Retention treatment basins often collect and treat this wastewater from CSOs to help avoid untreated overflows into the environment. However, they too can overflow, leading to an RTB overflow. SSOs are discharges of raw or inadequately treated sewage from municipal separate sanitary sewer systems, which are designed to carry sanitary sewage but not storm water.

Below is data on the type of overflows that have occurred in Southeastern Michigan in 2021 thus far. EGLE tracks this information and presents an annual report; the data for this post is the ongoing data for 2021 and has yet to be digested into a comprehensive report. Overall, the data shows that were have been 84 known and reported discharge events in Michigan in 2021. Of those 84, 37 have occurred in Southeastern Michigan. The charts below provide a deeper look at the type of discharge events, their locations and the responsible parties of the discharge events. 

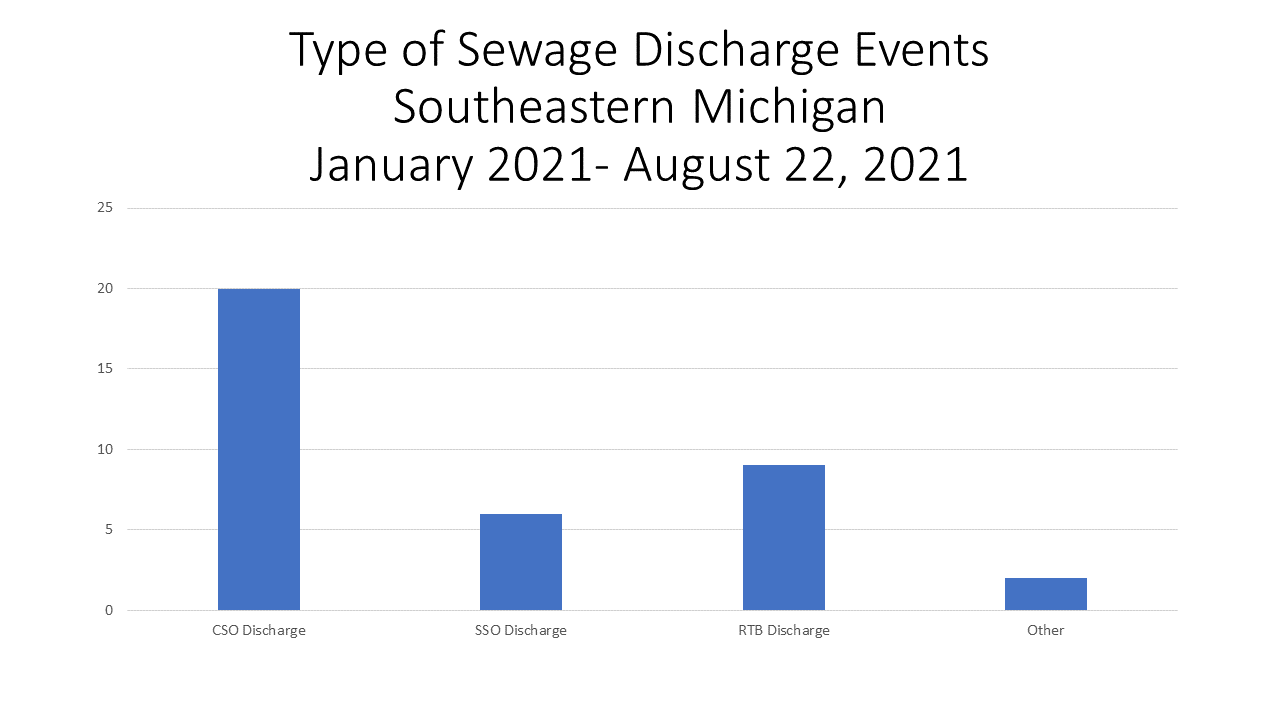
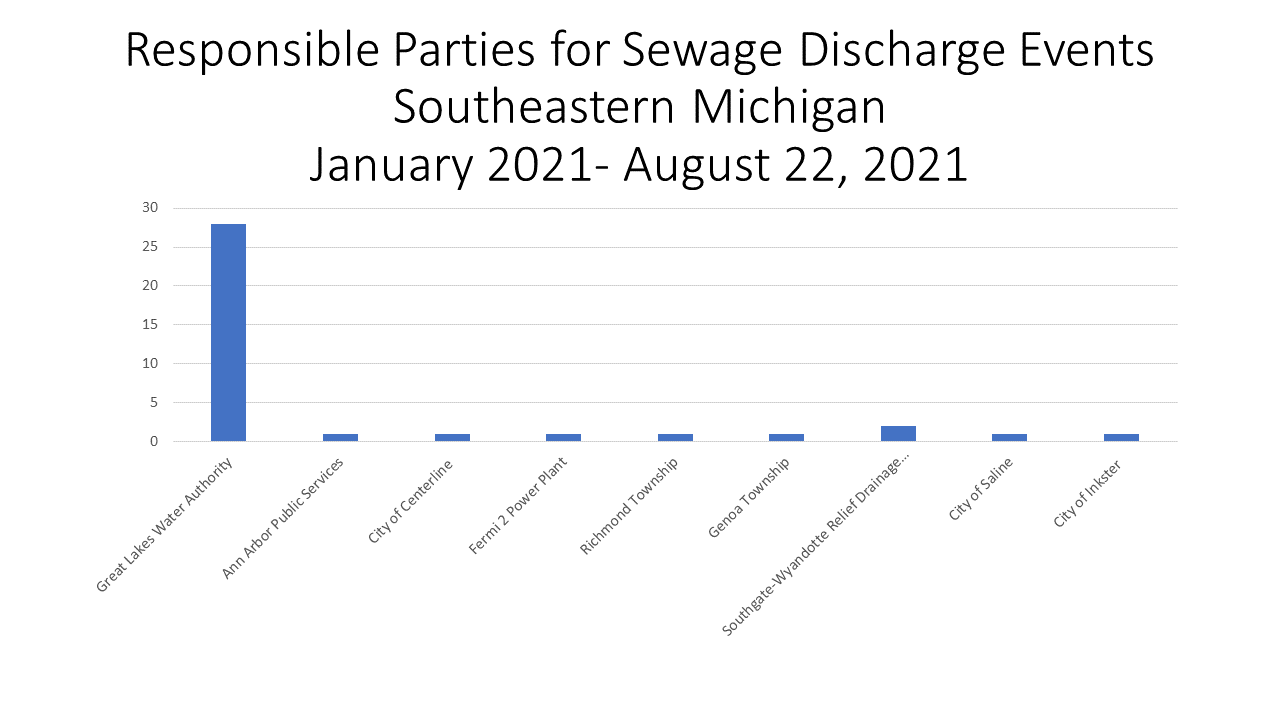
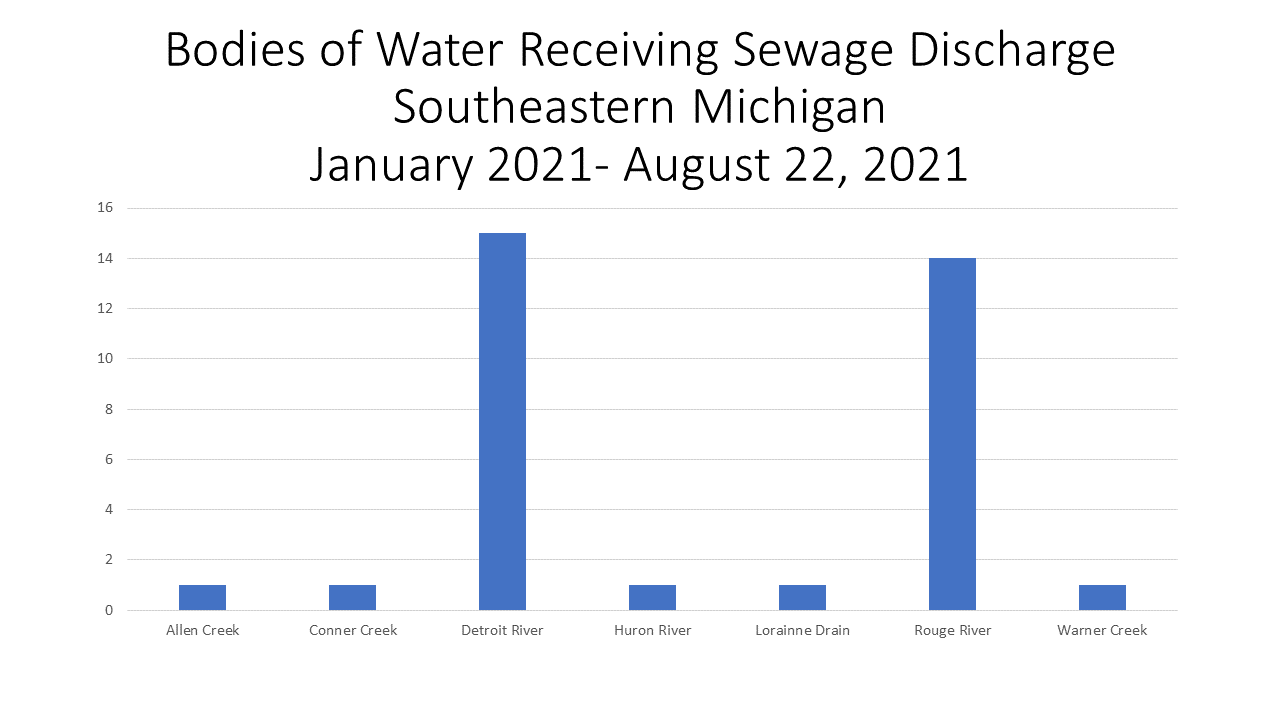
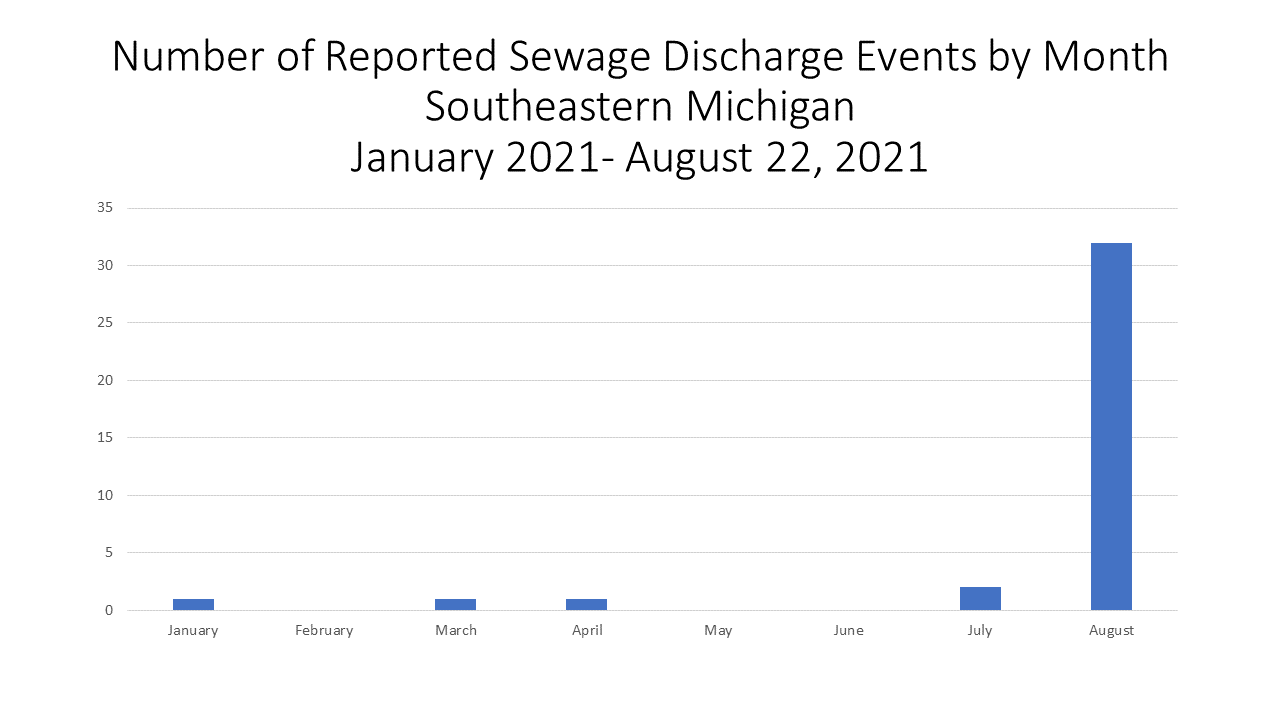
The above data highlights a few different points, including that the Great Lakes Water Authority (GLWA) had the highest number of discharge events in 2021 thus far; CSO discharge events are the most common; the Detroit River and the Rouge River are recipients of the highest number of discharge events; and August has had the most number of discharge events this far in 2021.

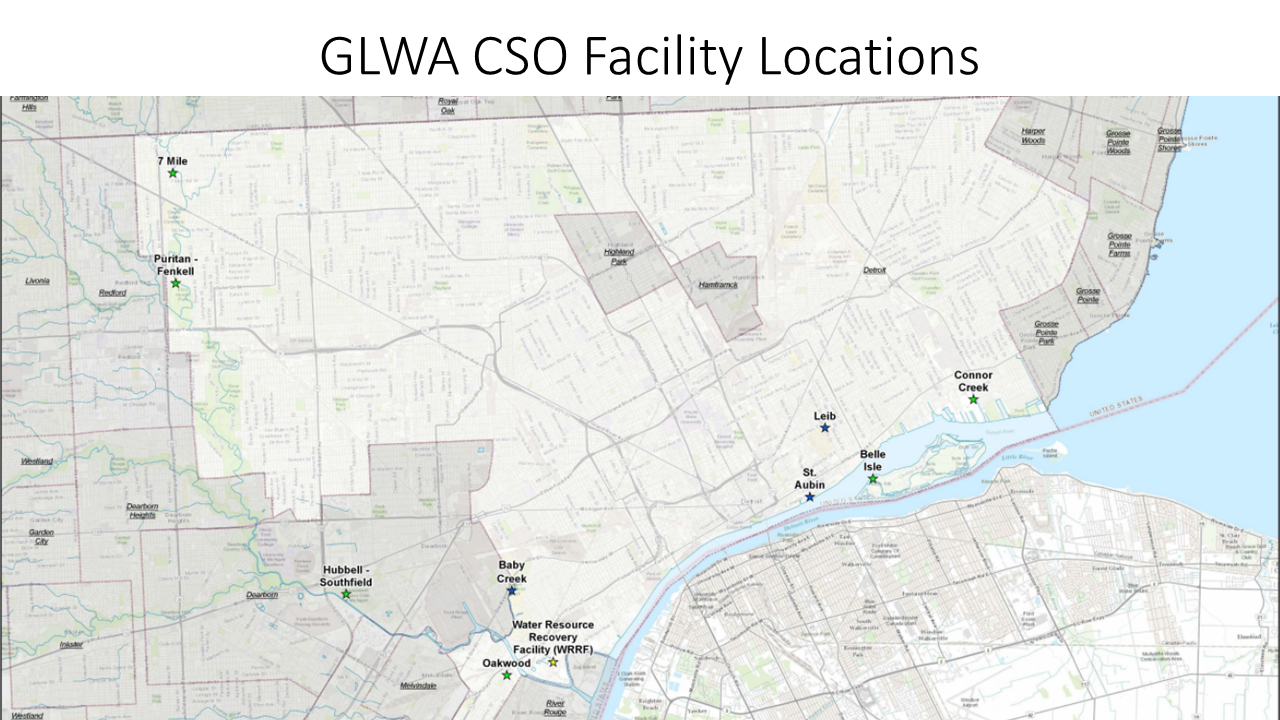
Now, to further break down the data. It should come as no surprise that the GLWA has had the most number of sewage discharge events because of its size. The GLWA is a regional water authority that provides drinking water and sewer service to more than 80 communities in Southeastern Michigan. The GLWA, by way of its formation in 2015, also inherited old infrastructure, which clearly needs updating to help prevent future overflows. For example, the Conner Creek discharge event that occurred during the first major rain storm of the summer, in early July, was a result of a lack redundancies for power. This event was one of the RTB overflow events, as the Conner Creek Pump Station is a CSO basin station, meaning the facility is meant to handle sewage overflow so it doesn’t go into the waterways. However, it does happen, and so far in 2021 there have been 9 such events.

As noted, CSO events occur when the system becomes  overwhelmed by the combined sewage and untreated wastes are directly released into receiving waters, with the Detroit River and the Rouge River being the most common water in Southeastern Michigan. These CSO events are considered intentional because the system was designed to allow overflow into waterways  once capacity of the wastewater treatment plant to store more liquid or process its maximum volume is reached. There are several discharge points in Southeastern Michigan, with the GLWA operating most of them. In total, the GLWA has 9 CSO discharge locations along the Detroit and Rouge Rivers and 62 additional untreated discharge points. Of those 62 untreated discharge points, six  discharge only in the event of an emergency that jeopardizes property (i.e. wide-spread basement flooding). The remainder of the points discharge at varying frequencies. These 62 sites are responsible for about 5 percent of total combined sewer overflow discharge volume. In 2021 there have been 20 CSO events in Southeastern Michigan, 19 of which the GLWA was responsible for and all of which discharged in the Detroit or Rouge rivers.

CSO events are tied to heavy rainfall, which explains why August had the highest number of overflow events. It is predicted that these events will only increase as our climate changes.  This of course is concerning because the overflows are forms of pollutants and release hazardous materials into the environment, causing health, safety and environmental issues.

Ways to help mitigate CSOs include sewer separation, expanding CSO treatment facilities and adding retention basins and investing in green infrastructure (bioswales, rain gardens). Actions are being taken nationally and locally to help better prevent CSOs, but a total overhaul of our water and sewer infrastructure would cost billions upon billions of dollars. So far, the GLWA has invested $1.2 billion in CSO facility upgrades, and while the amount of CSOs has been reduced by 95 percent, they still occur and have long-term affects on the region.

Production of Solid Waste Rises in Michigan

The landfills in Michigan not only hold solid waste produced from Michigan residents, but also from other states and Canada. The first chart below shows how much solid waste has been disposed of in Michigan landfills between 2008 and 2019, total. Between 2009 and 2012 the amount of waste being disposed decreased from about 49 million cubic yards in 2009 to about 44 million cubic yards in 2012. From 2013 to 2018 though the amount of waste being disposed continuously increased. In 2013 there was about 44.5 million yards of cubic waste disposed of into Michigan landfills and by 2018 that number was about 52.5 million cubic yards.

When examining the three different sources that dispose of solid waste into Michigan landfills the data shows that waste from Canada had the largest decrease between 2009 and 2012, according to the Michigan Department of Environmental Quality. In 2009 9 million cubic yards were disposed of into Michigan landfills and 2012 that number was 6.5 cubic yards.  Between 2013 and 2018 though those numbers increased from about 7.5 million cubic yards to 9.5 cubic yards. For the amount of solid waste disposed of in Michigan from instate sources that number rose from about 35 million cubic yards in 2009 to about 40 million cubic yards. For solid waste disposal from other states that amount disposed of never increased above 2.9 million cubic yards between 2009 and 2018.

Overall, the amount of waste generated in Michigan continues to increase while import rates are decreasing, according to the Michigan Department of Environmental Quality.

The chart below shows the total waste disposed in Michigan landfills from each county in Southeastern Michigan. This chart does not necessarily reflect how much waste is disposed in each county, but rather how much waste comes from each county. Wayne County had the highest amount of waste disposal at more than 11 million cubic yards in 2018; this amount was more than twice the amount of any other county in the region. Oakland County had the second highest amount of waste disposed in 2018 at about 4.3 million cubic yards. Livingston County had the lowest amount of waste disposed at about 380,000 cubic yards.

Below is a list of the landfills in Southeastern Michigan and the amount and type of waste disposed in them in 2018. Municipal and Commercial Waste (MCW) was the most common type of waste disposed of in Southeastern Michigan landfills, followed by Industrial Waste (IW).

In Southeastern Michigan there are 13 different landfills, two of which only accept Industrial Waste. The two landfills that only accept Industrial Waste are Detroit Edison Ash Disposal in St. Clair County and the DTE Monroe Power Plant in Monroe County.

Pine Tree Acres, which is a landfill operated by Waste Management in Lenox Township (Macomb County) had the largest amount of waste disposed there in 2018 at nearly 5.1 million cubic yards. Carleton Farms Landfill in Sumpter Township (Wayne County) had the second largest amount of waste disposed there at about 4 million cubic yards.

The City of Livonia accepted the least amount of waste in 2018. According to the Department of Environmental Quality the City of Livonia landfill received 2,700 cubic yards of Municipal and Commercial Waste and 1.8 yards of Industrial Waste.

Overall this post was intended to highlight where waste in Michigan, and the region comes from, what regional counties are producing the most amount of solid waste and how the production of waste in the state continues to rise. Not only does this post shed light on the production of solid waste but it should also be a conversation starter for the need of increased recycling rates. According to the Environmental Protection Agency the recycling rate in Michigan is 15 percent; the national average is 35 percent. While bottle returns in Michigan are at about a 90 percent redemption rate, according to a 2018 Bridge Magazine article, other recyclable items are not returned at nearly such a high rate. There needs to be a mindset change in the State of Michigan, and digging deeper into the data could help facilitate successful public information campaigns.

Unfortunately, data on recycling is not nearly as detailed as the information the state produces on solid waste. For example, information on what communities offer curbside recycling is not readily available, and the last measurement report on recycling in the state was published in 2016, with data from 2014.

There needs to be more information on recycling in Michigan, and the amount of solid waste disposed of in Michigan’s landfills needs to be reduced. Although waste from other states and countries is imported to Michigan landfills, an action that should also be halted, it is the rate at which solid waste in Michigan is being produced and disposed of that is increasing the greatest problem. We need to see a substantial reduction in solid waste disposal, and a parallel increase increase in recycling.  

PFAS Regulations to Tighten in Michigan

Per-and polyfluoroalkyl substances (PFAS) are synthetic chemicals (including PFOA and PFOS) found in everything from packaging to cookware. These chemicals are causing environmental and potential health problems, especially here in Michigan. To better track how these chemicals are affecting the environment and public health the Michigan PFAS Action Response Team was created to research, identify, recommend and implement actions to improve the PFAS situation in the State. Part of this research includes testing the waterways and the public water supply. The first map below shows the total PFAS found in treated public water samples throughout the State in 2018. Three counties in Michigan (Washtenaw, Muskegon and Allegan counties) had between 63-78 parts per trillion for PFAS tested in the public water supply. According to the Environmental Protection Agency the lifetime recommended advisory limit is 70 parts per trillion. In Kalamazoo County the amount of PFAS is far higher than the EPA’s recommended intake and any amount found in every other Michigan county. According to the State of Michigan, 5,955 parts per trillion of PFAS was found in Kalamazoo County. It is believed much of this contamination is from old paper mills in the area, a plastics company and a landfill; at least 115 wells and other sources for drinking water were tested.

The second map below shows the total PFAS found in raw water for public water supplies. For this measurement Kalamazoo County was in with the majority of Michigan’s 83 counties where 0-28 parts per trillion of PFAS was found. Of all the counties in the state, Kent County had the highest amount of PFAS found at 140 parts per trillion.  With the exception of the amount of PFAS found in Kalamazoo County’s treated drinking supply, in general, the amount of PFAS found in raw water testing samples was higher than those found in treated public water samples.


Overall, the maps above show that several counties in Michigan have high amounts of PFAS found in public drinking supplies, and in some cases above the EPA lifetime recommendation. As more information about PFAS is discovered that state needs to take actions to prevent further contamination of our water resources by implementing stricter standards. Just recently the Michigan PFAS Action Response Team proposed the lowest parts per trillion thresholds in water supplies in the county. These numbers, which vary depending on the specific PFAS, are still in draft form though and will likely not be formally recommended until October, with enforceable numbers being set by spring of 2020. Once formalized the contaminant levels would be enforceable under the Safe Drinking Water Act.

Great Lakes Continue to Rise

Water levels in the Great Lakes continue to rise as the rain continues to fall. According to U.S. Army Corps of Engineers, each of the Great Lakes had higher average water levels in the month of May in 2019 than the prior years. Each lake had water levels that were almost a foot higher than the previous year. Additionally, as of June 21, 2019 water levels throughout the Great Lakes continued to reach above average levels, increasing well beyond the May 2018 and May 2019 averages. Between May 2019 and June 21, 2019 water levels in Lake Superior have increased an additional 3 inches, which is the lowest increase of the five water basins the U.S. Army Corps of Engineers tracks as part of the Great Lakes. Lake Ontario experienced the highest increase between the May 2019 average and the recorded water levels on June 21, 2019; the increase in that time frame was 8 inches. Lake Michigan-Huron has had the second highest increase in the last few weeks at 7 inches.

The charts below further show that as of May, Lake Ontario experienced the highest average increase between May of 2018 and 2019 at about a foot and a half. Lake St. Clair’s average increased the least, but was still up 8.4 inches from the 2018 May average.

Such water levels are a result of above average rainfalls for 2019 and below average evaporation rates. For some perspective, as of June 1, 2019 there had been 1.57 inches of rain during the month, compared to 0.57 inches by the same time in 2018. Additionally, the average temperature for the month of June this year is about 68 degrees when last year the average temperature for June was about 72 degrees.

Weather models predict that cooler temperatures and increased amounts of precipitation will become more of the norm for Michigan, as a result of climate change. Such a long-term shift in the state’s climate not only affects water levels in the Great Lakes, but also farming throughout Michigan. This is a topic we will further explore in an upcoming post.

Wayne County Hosts Highest Number of Contaminated Sites in Michigan

The federal Superfund Program was created in 1980 to respond to releases of hazardous substances in the environment. The Superfund Program protects the public and the environment, making communities safer, healthier, and more economically viable.

Superfund sites are some of the most significant and expensive sites of environmental contamination. Superfund sites include all sites in the United States where the Environmental Protection Agency (EPA) has identified contamination with hazardous waste. When the EPA determines that a site requires cleanup, the site is placed on the National Priorities List (NPL). As of 2017, Michigan has 65 sites listed on the NPL. An additional 19 sites that were previously on the NPL have been deleted because all necessary response actions were completed.

NPL sites fit within three categories:

  1. Proposed NPL site,
  2. Current NPL site, and
  3. Deleted NPL site.

A proposed NPL site means that hazardous substances have been identified at the site, and it has been recommended to the federal Superfund Program for clean-up. Current NPL sites are those that have been accepted by the Superfund Program and are undergoing clean-up. The deleted NPL sites are those that have completed the process of clean-up, and they have been deemed protective of public health, and the environment.

Sites in the Superfund Program may be managed in a variety of ways. The EPA, the state, or private parties may implement the cleanup. The Superfund law allows for enforcement actions which make private parties conduct the cleanup if they were responsible for the contamination. Where there are responsible parties, the EPA may take the enforcement lead with the state providing support (36 sites in Michigan). In some cases, the state may take the enforcement lead on particular sites (10 sites in Michigan).

The Michigan Department of Environmental Quality also has sites for remediation called Baseline Environmental Assessments (BEA). BEA sites are facilities with a history of use of chemicals. The sites may be classified into several categories, including Part 201 (i.e., having one or more contaminants) and Part 213 (i.e., having leaking underground storage tanks). Remediation of these sites includes activities to manage and reduce risks of environmental contamination. This may be achieved through activities such as: initial evaluation, interim response, remedial investigation, land and resource use restrictions, and monitoring.

All Contaminated Sites in Michigan by County: BEA, Part 201, Part 213, and Superfund NPL Sites

The map below of the state of Michigan includes BEA, 201, and 213 contaminated sites, as well as Superfund NPL sites. Each color on the map represents the range of BEA, 201, and 213 contaminated sites per county or the actual total. For example, many of the counties with a smaller total number of contaminated sites are designated with a color that is also associated with a range. However, Kent, Macomb and Wayne counties are designated with a color that directly associates to the total number of contaminated sites in that county. The map shows that Wayne County contains the largest number of contaminated sites 7,078 sites. Kent County has 3,499 contaminated sites and Macomb County has 2,315.

All Contaminated Sites in Wayne County by Municipality: BEA, Part 201, Part 213, and Superfund NPL Sites

The regional map below includes BEA, 201, and 213 contaminated sites, as well as active Superfund NPL contaminated sites and deleted NPL sites. Each color on the map represents the range of BEA, 201, and 213 contaminated sites per city (e.g., Highland Park = 124-285 sites). A green circle indicates a deleted NPL site, while a yellow diamond indicates an active NPL site. The map shows that Detroit contains the greatest number of contaminated sites in Wayne County, with a total of 3,648 (the color red does provide a range, based off the range before it, but Detroit is the only city within the last range). Additionally, there is one deleted NPL Superfund site in Detroit and two in Wayne County. There is also an active NPL Superfund site in Wayne County, in Trenton.

Overall, as the second map below shows, a block in Southwest Detroit has the highest number of concentrated contaminated sites. On a larger scale though, the area just west of Woodward Avenue, south of Highland Park, has several blocks where there are at least one to six contaminated sites.

In this post we simply highlighted the counties and municipalities in the state with the highest number of contaminated sites. However, there is more to this conversation than just that. In a coming post we will also be taking a further dive into where much of these sites are located regionally, specifically Detroit, and the link between income and contaminated sites.

Ethanol Fueled Vehicles Most Popular Among Those Powered by Alternative Fuels

With alternative energy sources slowly growing more popular for consumption, there are also certain sources that remain popular to fuel vehicles. The U.S. Energy Information Administration provides data on the number of vehicles that are powered by alternative energy sources. Ethanol is by far the most commonly used alternative fuel source used to power vehicles, followed by electric hybrid vehicles. While the use of some of these alternative fuel sources is growing, most of the fuel sources have experienced a decrease in use in recent years.

Of the alternative fuels sources the U.S. Energy Information Administration provides information on, ethanol was the most highly used fuel source. Ethanol is a renewable fuel made from corn and other plant materials.

In 2004 there were 674,678 vehicles that used ethanol as a fuel source. By 2013 that number reached its peak at more than 2.6 million vehicles using ethanol as a fuel source. While the number of vehicles using ethanol as a fuel source has declined in recent years ( in 2016 about 1.4 million vehicles used it as a fuel source), it still remains the most utilized renewable fuel source for vehicles.

The number of gas-electric hybrid vehicles produced on an annual basis has been increasing since 2004. In 2004 there were 88,272 gas-electric hybrid vehicles and in 2016 that number was 399,367. It was in 2013 when there was the most number of gas-electric hybrid vehicles, that number was 458,994.

The use of diesel-electric hybrid vehicles has not been as popular and has not grown as much as gas-hybrid vehicle. In 2004 there were 419 diesel-electric hybrid vehicles and by 2016 that number had only grown to 1,053. The number of diesel-electric hybrid vehicles peaked in 2009 at 2,223.

The use of electric vehicles didn’t really take off until 2013 when there was an inventory of 130,323. Between 2004 and 2010 though there were no more than 3,200 electric vehicles each of those years. It was in 2011 when the use of electric vehicles began to take off, and by 2016 there were 160,191 electric vehicles.

While compressed natural gas is widely available, its utilization as a fuel source falls below many of the other renewable fuel sources available to vehicles. In 2016 there were 5,730 vehicles fueled by compressed natural gas, a number that is below how many there were in 2004 (7,752). It was in 2013 when there was the most amount of vehicles fueled by compressed natural gas, that number was 9,454.

Michigan’s Energy Production Needs to Shift Toward Renewable Sources

While the types of energy consumed in Michigan vary amongst sources, the energy produced in Michigan is much more limited. For example, no coal powered energy is produced in Michigan. Rather, the coal consumed in the state is brought in from other states, particularly those west of Michigan, on railways.

The information provided in this post from the U.S. Energy Information Administration.

At one point, natural gas was the largest energy source in Michigan, reaching its peak production at 312 trillion BTUs in 2000. Since then, the amount of natural gas produced in Michigan has steadily declined. Between 2007 and 2008 the amount of natural gas produced in Michigan declined from 275 trillion BTUs to 162 trillion BTUs. In 2016, 107 trillion BTUs of natural gas energy was produced.

Crude oil production has ranged between 45 and 32 trillion BTUs since 2000, with various peaks and valleys between then and 2016. According to the Energy Information Administration (EIA), Michigan ranks 19th out of the 50 states for crude oil production. In 2016, 32.1 trillion BTUs of crude oil was produced. This is a decrease from the 45.9 trillion BTUs produced in 2000.

Crude oil production in the state comes from reserves; in 2017 about 5.4 million barrels of crude oil were produced compared to the 34.7 million barrels that were produced in 1979. Please note the chart references BTUs, while barrels of crude oil is another measurement used to detail production of this energy source.

Nuclear energy is the energy source that is produced the most in Michigan. In 2016 there were 330 trillion BTUs produced, up from the 200 produced in 2000. There are three nuclear power plants in Michigan, which produce about 30 percent of the electricity used in the state. While there have been some changes in the amount of nuclear energy produced in Michigan, it has remained at around 325 trillion BTU average for the last 15 years.

The amount of renewable energy produced in Michigan, both from biofuels and other sources, has grown since 2000, but none of those sources total the amount of energy produced by the state’s natural gas or nuclear energy sources. For biofuels, in 2002 there was zero energy production by this source. Since then it has increased to 37.7 trillion BTUs. For other renewable energy sources, which include wind, solar and hydroelectric energy, there has been a slow increase in production, with somewhat of a spike in 2014. In 2014 there were 164 trillion BTUs of renewable energy produced in Michigan; in 2016 there were 156.9 trillion BTUs.

The production of renewable energy in Michigan has been increasing since 2000, although there has been a slight decline in such production since 2014. In 2014, 202.2 trillion BTUs of renewable energy were produced in Michigan, and in 2016 that number slightly decreased to 194.6. However, the 2016 production rate is almost double the amount of renewable energy that that was being produced in 2000; in 2000 110.5 trillion BTUs of renewable energy was produced.

In the state of Michigan, the types of energy that make up renewable energy include biomass, solar, wind, geothermal and hydroelectric energy. Despite increases in consumption, carbon-based energy sources are still consumed far more than renewable energy sources.

While the production of carbon-based energy sources in Michigan is far less than the amount consumed, there is still clearly a heavy reliance on these energy sources. Additionally, renewable energy is consumed more in Michigan than produced (click here to view consumption rates in our last post). With carbon-based energy source consumption and renewable energy source consumption both outweighing the amount produced in the state, it would make sense, on multiple levels, for energy policies to shift toward further encouragement, and enforcement, of creating more renewable energy production sources in the state. Not only would such policies mean increased production of clean energy, but it would also mean decreased reliance on carbon-based energy and energy sources produced outside of the state.

Carbon-Based Energy Sources Continue to Dominate Michigan’s Energy Consumption

In the State of Michigan, petroleum is the most highly consumed form of energy, according to the U.S. Energy Information Administration (EIA). In 2016, 881.4 trillion British Thermal Units (BTU)s of petroleum were consumed in the State of Michigan. This number represents a continued increase of usage since 2012, when it was reported that 787.2 trillion BTUs were consumed. Prior to 2012, use of petroleum remained steady between 2000 and 2005 at about 990 trillion BTUs and then began to drop to the 2012 consumption low point. In the context of this post, petroleum represents the use of motor gasoline, distillate fuel oil, residual fuel and jet fuel. The pattern of decline, then resurgence, is one that follows the economic fortunes of the state with the Great Recession followed by a slow climb out of recession since about 2012.

In the State of Michigan, petroleum is the most highly consumed form of energy, according to the U.S. Energy Information Administration (EIA). In 2016, 881.4 trillion British Thermal Units (BTU)s of petroleum were consumed in the State of Michigan. This number represents a continued increase of usage since 2012, when it was reported that 787.2 trillion BTUs were consumed. Prior to 2012, use of petroleum remained steady between 2000 and 2005 at about 990 trillion BTUs and then began to drop to the 2012 consumption low point. In the context of this post, petroleum represents the use of motor gasoline, distillate fuel oil, residual fuel and jet fuel. The pattern of decline, then resurgence is one that follows the economic fortunes of the state with the Great Recession followed by a slow climb out of recession since about 2012.

Next to petroleum, natural gas was the most commonly consumed energy source. In 2016, 675.9 trillion BTUs were consumed in the State of Michigan. This is a decrease from 763.8 trillion BTUS is 2014 and a larger overall decrease of 854.8 trillion BTUs consumed in 2000, this form of energy remains the second most consumed in the State of Michigan. This is not surprising though, as most of the energy produced in Michigan is natural gas. Here though we are discussing consumption.

The consumption of renewable energy sources in Michigan has steadily increased since 2000, with 208.7 trillion BTUs being consumed in 2016. In 2000, 118.4 trillion BTUs of renewable energy was consumed in Michigan.

The type of renewable energy sources consumed in Michigan include solar, wind, hydroelectric, biomass and geothermal energy sources. Wood and waste biomass and wind energy are the type of renewable energy sources consumed the most in Michigan.

Of the renewable energy sources consumed in Michigan, biomass has the highest consumption rate at 85.6 trillion BTUs in 2016, according to the EIA. Biomass includes organic matter such as wood or crop waste. Consumption of biomass as an energy source has been increasing since 2000 when the consumption was 68.9 trillion BTUs.

The consumption of geothermal as an energy source steadily increased from 2000 to 2011, (from 1.2 trillion BTUs to 5.1 trillion BTUs) and has since leveled off, with 5.2 trillion BTUs being consumed in 2016.

Solar and hydroelectric are the lowest consumed renewable energy sources in Michigan. According to the EIA, 1 trillion BTUs of solar energy consumed in Michigan in 2016; this is an increase from the 0.2 trillion BTUs consumed in 2000. The consumption of hydroelectric energy has yet to reach 1 trillion BTUs. In 2000 0.3 trillion BTUs was consumed and in 2016 0.2 trillion BTUs was consumed. These numbers fluctuated between those time frames though, with the highest consumption of hydroelectric energy being in 2003 at 0.8 trillion BTUs. Overall renewables represent a very small, though slightly increasing proportion of energy consumed.

In 2008 Michigan enacted a renewable energy standard that required the state retail electricity providers, such as DTE, to generate at least 10 percent of their energy sources from renewable energy; that requirement has since been increased to 12.5 percent to be met by 2019. According to DTE, their current residential electric fuel mix is made up of 9.8 percent renewable energy sources. In a future post we hope to further explore the electric fuel mix percentages; we are currently inquiring about time series data.

Overall, we see that consumption of carbon-based energy sources such as coal and petroleum have been decreasing over time, while the consumption of renewable energy sources has been increasing at a slow rate. The data presented here tend to indicate that carbon dioxide producing fossil fuels are likely to continue to dominate energy consumption for many decades, unless Michigan policy makers act on the dangers of climate change to the state’s future environment, economy and children.


Lake Huron has Highest Number of Beach Advisories/Closures

On July 8, 2018 there were 23 beach closures throughout the State of Michigan, three of which were in the Southeastern Michigan region. These were Newburgh Lake in Wayne County, Fox Lake in Oakland County and the Lake St. Clair Metropark Beach in Macomb County. Thus far in 2018, the Lake St. Clair Metropark Beach has been closed for a total of 25 days due to high bacteria levels, according to the Michigan Department of Environmental Quality (MDEQ). The earliest closure for Lake St. Clair Metropark Beach began on May 31, 2018 and lasted for three days. The most recent closure was announced on June 21, 2018 and it remains closed. According to the MDEQ, advisories or closures are most commonly issued due to elevated counts of E. coli in water samples collected from the shoreline of a water body. Health departments use the daily and 30-day geometric mean to determine if a beach closure or advisory should be issued; for E. coli that average is 300 milliliters. E. coli contaminations often occur from storm water, sanitary sewer overflow and wildlife (such as excrement left from Canadian Geese). Below are three charts showing the number of beach advisories/closures (formally referred to as actions) taken between 2012-2017 on beaches monitored along Lake Erie, Lake Huron, Lake Michigan, Lake St. Clair and Lake Superior. It is important to note that not all beaches along the Great Lakes (and Lake St. Clair) are monitored. Local health departments and non-profits receive federal and state grant funding to monitor beaches. Monitoring must occur on beaches for which grant funding is provided for. The first chart below shows the percentage of monitored beaches across the state that had an advisory between 2013-2017. The highest percentage of actions occurred in 2015 at 25 percent; most recently the percentage of actions reported in 2017 was 18 percent. The 10-year average was 21.5 percent.

When looking at the sheer number of actions by lake, Lake Huron has regularly had the most number of advisory/closures since 2013, according to the Michigan Department of Environmental Quality. In 2017, 18 were reported, a decrease from the high of 29 in 2015.

The final chart below details the number of closures and advisories issued for Lake St. Clair Metropark, due to its regularity of closures compared to other monitored beaches in Southeastern Michigan. As noted earlier, Lake St. Clair Metropark often has a Canadian Geese problem, and it is regularly noted in media outlets that the excrement from these birds contribute to the high E. coli levels in the water samples. To deter the number of geese at the beach, the Metropark has enlisted the help of three dogs to chase away the geese.

As the St. Clair Beach Metropark takes steps to deter a contributor to its closures, the State also began using a rapid testing method to identify E. coli contamination faster. The method identifies and measures E. coli DNA and provides results on the same day it is collected; the more traditional method provides results up to three days later. Currently, according to the MDEQ, there are 12 labs in the state able to perform this method.

Deer-Vehicle Crashes in Region Account for 17% of State’s Total

In 2015 in the state of Michigan there were about 1.75 million deer, according to the Michigan Department of Natural Resources. In Southeastern Michigan there were 7,855 deer-vehicle crashes, according to the Michigan State Police.

This was down 509 crashes from 10 years prior. This total number of crashes represented 17 percent of the total number of deer-vehicle crashes in the state in 2015 even though this part of the state represents over 47 percent of the states population.

Below are three time series, based on data provided by the Michigan State Police, showing the total number of crashes in the seven county region, the total of injuries caused by deer-vehicle crashes and the total number of fatalities caused by deer-vehicle crashes.

Oakland County experienced the highest increase in the number of deer-vehicle accidents between 2014 and 2015 at 123. Over the 10 year period, four counties (Monroe, Oakland, St. Clair and Wayne) experienced increases, with Wayne County experiencing the highest at 56. Livingston County experienced the largest decrease in the number of deer-vehicle crashes between 2006 and 2015 at 474.

Washtenaw County is another county that experienced an overall decrease in the number of deer-vehicle crashes between 2006 and 2015 at 125. Between 2014 and 2015 the county also experienced a decrease of 110 crashes. However, the city of Ann Arbor is in the midst of a deer management program to reduce the number of negative deer-human interactions, according to Mlive. Between 2014 and 2015 the number of deer-vehicle accidents in the city increased from 51 to 90, according to Mlive.

slide4

As seen in the next two maps below, injuries caused by deer-vehicle accidents are fairly common while human fatalities are infrequent varying between zero and one for any given county in a year. Between 2006 and 2015 Oakland County regularly had the highest number of deer-vehicle injuries; it also had the highest number of deer-vehicle crashes. The number of injuries appears directly related to the number of accidents.

In 2015 there 70 injuries caused by deer-vehicle related accidents in Oakland County and in Monroe County there were four. Not only does Oakland County have the highest number of injuries from such crashes but it has also experienced the highest increase between 2006 and 2015 at 15. Washtenaw County climbed to a paek in 2010, fell substantially and then climbed slightly by 2015. It experienced the lowest increase in from 2006 to 2015 at 6.

While each county in Southeastern Michigan had at least a handful of injuries caused by deer-vehicle crashes, fatalities from such accidents were much more rare. Between 2006 and 2015 there were zero fatalities caused by deer-vehicle accidents in Wayne County. Unlike Wayne County, every other county in the region had at least one fatality in the 10 year time span. In the years 2009, 2010 and 2014 though there were zero deer related fatalities throughout the region. Livingston County had the highest number of fatalities between 2006 and 2015 at three, one of which was in 2015. Throughout the state of Michigan there were 11 fatalities caused by deer-vehicle crashes in 2015.


slide6

slide7

Although fatalities from deer-vehicle crashes are uncommon, motorists should still be aware of their surroundings when driving. Most deer-vehicle crashes occur in the fall and winter months between dusk and dawn on rural roads. Very few methods of reducing these crashes have been found to be effective, except fencing and drivers slowing their speeds (though they often will not without consistent enforcement).