Basic Amenities Lacking in Southeastern Michigan’s Urban, Rural Communities

The basic amenities many of us take for granted – heating, plumbing, phone service, and full kitchens – are not accessible to everyone. There are occupied homes in Southeastern Michigan that lack one or more of these amenities. While a majority of occupied homes throughout the region do have a heating source, indoor plumbing, phone service, and a full kitchen, the maps below show that the communities with the highest percentage of homes that lack such amenities are typically located in the more rural and urban areas of the region, not suburban areas.

Slide10 Homes without Plumbing

Detroit homes without plumbing

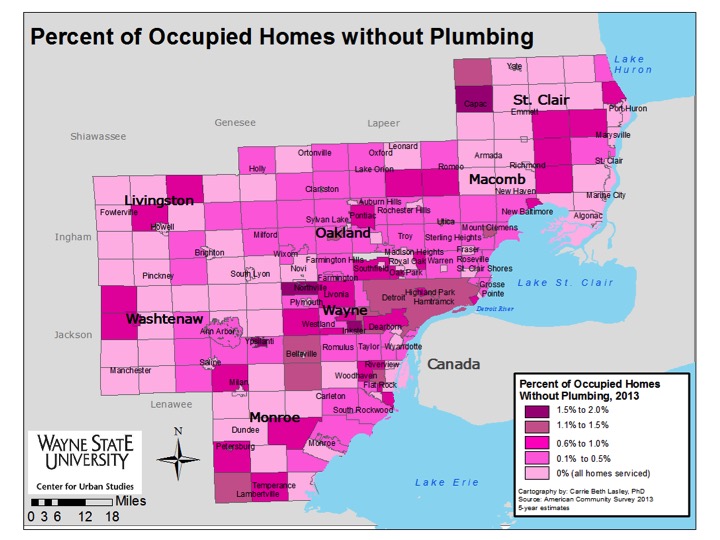
In Southeastern Michigan in 2013, there were only two communities, Inkster (1.5 percent) and Northville Township (1.8 percent), where between 1.5 and 2 percent of occupied homes were without complete plumbing (lacking either a toilet, a bathtub or shower, and/or running water). At a national level, about 1.6 million people are without complete indoor plumbing, according to a 2014 Washington Post article.

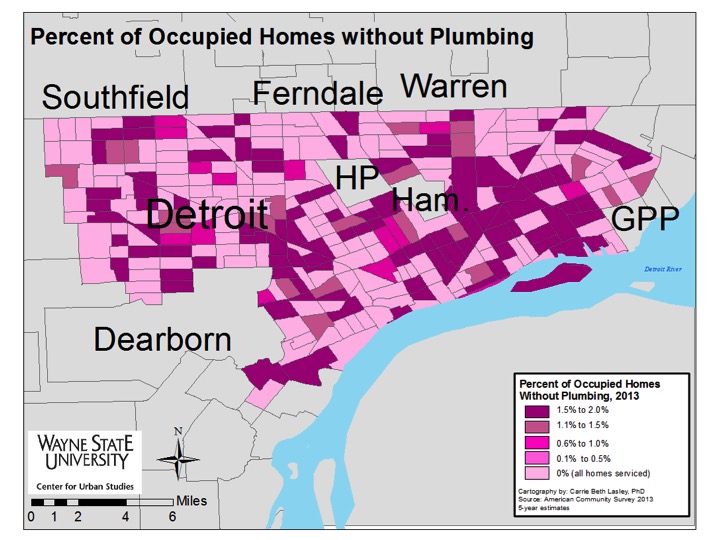
In 2013, 1.2 percent of the occupied homes in the city of Detroit were without complete plumbing facilities and this equated to 93 different census tracts in the city having homes without some type of complete plumbing facility. According to a 2013 post titled “Still Living without the Basics in the 21st Century” from the Rural Community Assistance Partnership, those living in densely populated urban areas and sparsely populated rural communities are more likely to live in a home without complete plumbing facilities, particularly if they live below the federal poverty level. In a post earlier this year, we detailed how a majority of the census tracts in the city of Detroit in 2013 had 50 percent or more of its children living below the poverty line. We also know that the median income in the city was $26,325 in 2013, which fell $26,721 below the national median income.

Homes without heating sources

Detroit homes without Heating sources

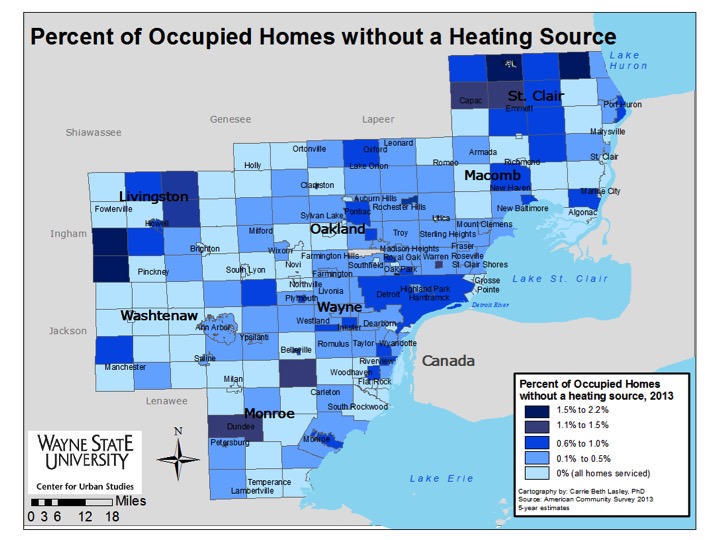
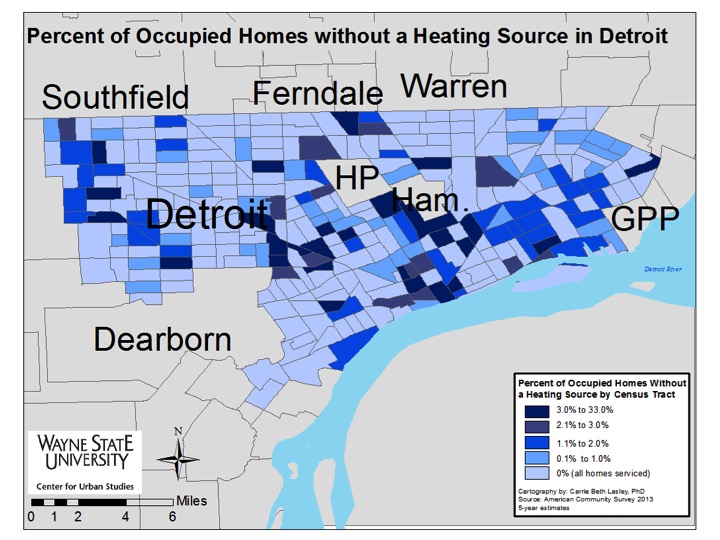
In Southeastern Michigan, the highest percentage of occupied homes without a heating source, meaning they lack heating equipment, were located in the rural communities on the outskirts of the region. In total, there were four communities in the region (two in St. Clair County and two in Livingston County) where between 1.5 percent and 2.2 percent of occupied homes did not have a heating source.

While Detroit wasn’t one of the roughly 55 communities in the region where all occupied homes had a heating source, about 0.6 percent of occupied homes in Detroit were without one. A closer look at the city though shows that up to 33 percent of the occupied homes in some census tracts were without a heating source. There were 27 census tracts throughout the city where between 3 and 33 percent of occupied homes were without a heating source. Seven of these census tracts were located along I-96. Additionally, there were two other clusters of occupied homes – just south of Hamtramck and Highland Park and in the downtown area – with the highest percentage of homes with no fuel source.

For those homes throughout the region that do have a heating source, utility gas was the most common source, followed by electricity.

Homes without phone service

Detroit homes without phone service

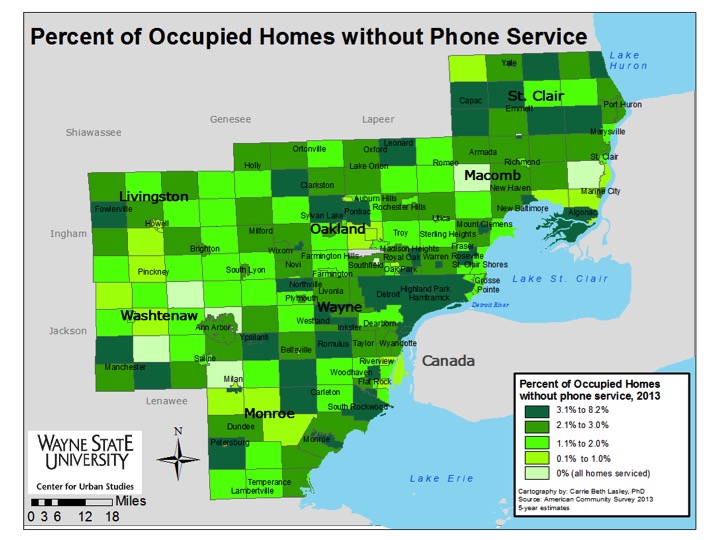
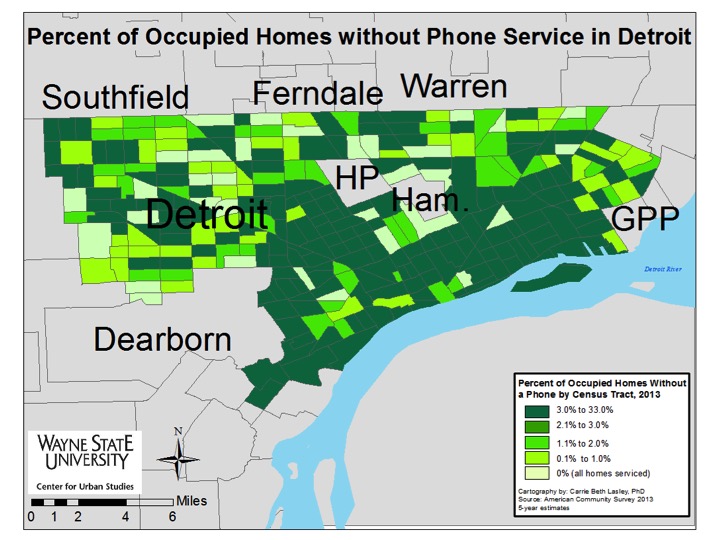
In 2013, up to 8.2 percent of occupied homes in Southeastern Michigan lacked any type of phone service (cell and/or landline), according to the American Community Survey. Those communities with the higher percentages of homes lacking phone service were primarily located in the more urban areas of the region, such as Detroit, Highland Park, and Pontiac, and the rural areas, such as several communities located throughout St. Clair, Livingston, and Monroe counties.

There were eight communities in the region where all occupied households had phone service. Four of these communities were located in Washtenaw County, two were located in Oakland County, one was in Macomb County, and another was in St. Clair County.

The city of Detroit was one of the 32 communities where between 3.1 and 8.2 percent of homes lacked phone service. In total, 4.8 percent of occupied homes in the city were without phone service. A drill down into the city shows that nearly half of the census tracts had between 3 and 33 percent of occupied homes without phone service.

Homes without a full kitchen

Detroit homes without a full kitchen

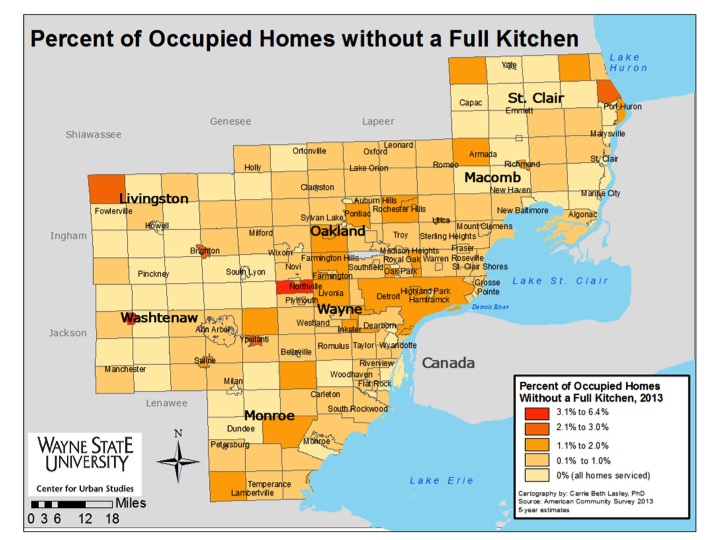
Northville Township and the city of Chelsea were the only two communities in the region where more than 3.1 percent of occupied homes did not have a full kitchen in 2013. In Chelsea, 5.6 percent of the homes were without a full kitchen and in Northville that number was 3.3 percent. According to the Census, having a full kitchen means having a sink with a faucet, a stove or a range and a refrigerator.


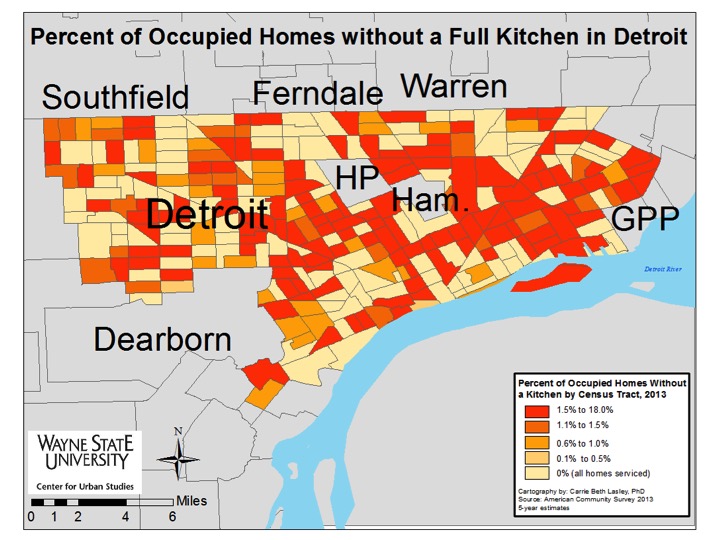
The city of Detroit was one of 22 communities where between 1.1 and 2 percent of homes were without a full kitchen. In Detroit, 1.7 percent of occupied homes were without a full kitchen. When looking at Detroit at the census tract level though we see that in more than 50 census tracts up to 18 percent of occupied homes were without a full kitchen.

While access to a full kitchen, whether it be lacking a stove or refrigerator or both, is a true day-to-day problem for many people, sometimes an occupied home lacks a full kitchen because it is in the process of being remodeled.

Suicide, Substance Use Causing Increased Mortality Rates Among White, Middle-aged Men

Suicide rates are increasing and locally the number of suicides were either highest among those 20-44 or 45-74, as detailed in a recent Drawing Detroit blog post. According to a recent New York Times article, suicide is a cause of death that is not only growing in Southeastern Michigan, but nationally. Throughout the state of Michigan, according to the Michigan Department of Health and Human Services, suicide was the fourth leading cause of death for white males between the ages of 35 and 49 (244 suicides total).

The article details recent research conducted by Princeton Economists Angus Deaton and Anne Case, which concludes that the rising death rates among middle-aged white men are being caused by suicides and issues related to substance use. According to the article, the mortality rate for white Americans between the ages of 45 and 54 with no more than a high school education increased by 134 deaths per 100,000 people. While the Michigan Department of Health and Human Services does not detail mortality rates by race, age and education level explicitly on its website, it does show that the mortality rate from white males between the ages of 45 and 54 increased from 469.7 to 494.4 between 2000 and 2013. Just as the death rate for white American males is increasing nationally, Michigan is also experiencing the plight.

While suicide rates have contributed to the growing mortality rate for this segment of the population, Deaton and Case found that suicide coupled with deaths caused by drug use and alcohol poisoning are what explained the increased mortality rate.

No direct explanations were discovered for the increase in suicide deaths and deaths caused by drug and alcohol use, however, Deaton found that increases in mortality rates for middle aged white men were parallel with the same population’s reports on distress, pain and poor health. This correlation, he said, could be used a rationale for the increase in the type of deaths.


For more on this article click here.

To learn more about suicide rates in Southeastern Michigan click here.

Southeastern Michigan’s Firearm Deaths Ruled Suicide Surpass those Ruled Homicide, Accidental

In Detroit, homicides by firearm far outpace suicide, according to the Michigan Department of Health and Human Services 2013 data. Outside Detroit in each of the seven counties in the region, the reverse holds. Suicide by firearm far exceeds homicide by firearm. Accidental deaths by firearm in Southeastern Michigan in 2013 were far lower than either other category. Wayne County, excluding the city of Detroit, had the largest difference between firearm deaths ruled suicide and firearm deaths ruled homicide; there were 50 more firearm deaths ruled homicide. Macomb County had the second largest difference at 42 and Oakland County’s difference was 39.

In Detroit there were 214 more firearm deaths ruled homicide than suicide.

Firearm deaths ruled accidental was the category with the lowest numbers across the region. Wayne County had the highest number of accidental deaths at three while Livingston, Oakland and Washtenaw counties, along with the city of Detroit, had zero.

When looking at the rate of suicide and homicide deaths by firearm per 100,000 residents we see that suicide had a higher rate in all counties but Wayne in 2013. However, when the number of Detroit suicide and homicide deaths are removed from Wayne County it was in line with its peers in that its rate of suicide death by firearm was higher than its rate of homicide by firearm. At the county level, Macomb County had the highest rate of suicide by firearm at 7.6 and Livingston County had the lowest at 2.7. When not including the Wayne County rate of homicide by firearm with Detroit numbers included, Oakland County had the highest rate of homicide by firearm per 100,000 residents in 2013 at 2.5.

Detroit’s rate of homicide by firearm per 100,000 residents was higher than its suicide rate by firearm though in 2013; the rate of homicide by firearm was 13.6 while the suicide rate by firearm was 4.7.


Slide3

Southeastern Michigan Firearm Deaths

Rate of Suicide by Forearm

2013 Firearm Homicides

In Detroit, homicides by firearm far outpace suicide, according to the Michigan Department of Health and Human Services 2013 data. Outside Detroit in each of the seven counties in the region, the reverse holds. Suicide by firearm far exceeds homicide by firearm. Accidental deaths by firearm in Southeastern Michigan in 2013 were far lower than either other category. Wayne County, excluding the city of Detroit, had the largest difference between firearm deaths ruled suicide and firearm deaths ruled homicide; there were 50 more firearm deaths ruled homicide. Macomb County had the second largest difference at 42 and Oakland County’s difference was 39.

In Detroit there were 214 more firearm deaths ruled homicide than suicide.

Firearm deaths ruled accidental was the category with the lowest numbers across the region. Wayne County had the highest number of accidental deaths at three while Livingston, Oakland and Washtenaw counties, along with the city of Detroit, had zero.

When looking at the rate of suicide and homicide deaths by firearm per 100,000 residents we see that suicide had a higher rate in all counties but Wayne in 2013. However, when the number of Detroit suicide and homicide deaths are removed from Wayne County it was in line with its peers in that its rate of suicide death by firearm was higher than its rate of homicide by firearm. At the county level, Macomb County had the highest rate of suicide by firearm at 7.6 and Livingston County had the lowest at 2.7. When not including the Wayne County rate of homicide by firearm with Detroit numbers included, Oakland County had the highest rate of homicide by firearm per 100,000 residents in 2013 at 2.5.

Detroit’s rate of homicide by firearm per 100,000 residents was higher than its suicide rate by firearm though in 2013; the rate of homicide by firearm was 13.6 while the suicide rate by firearm was 4.7.

There were four counties with an increase in the percentage of firearm deaths ruled suicide between 2008 and 2013. Monroe County had the largest increase at 1,000 percent, which is representative of an increase of 10 firearm deaths ruled suicide. In 2008 there was one suicide in Monroe County and in 2013 there were 11. The other three counties were Washtenaw, Oakland and Macomb. In terms of sheer numbers, Oakland County had the largest increase of firearm deaths ruled suicide between 2008 and 2013 at 27.

Livingston County had the largest percentage decrease of firearm deaths ruled suicide between 2008 and 2013 at 55 percent. In 2008 in Livingston County there were 11 firearm deaths ruled suicide and in 2013 there were 5.

Change of Gun deaths

Livingston, Macomb, St. Clair Counties’ Suicide Rates Top Those Of State, Nation

Nationally, the suicide rate was 12.1 suicides per 100,000 residents in 2013, according to the Centers for Disease Control, and statewide it was 12. 9 per 100,000 people, according to the Michigan Department of Health and Human Services. However, in Southeastern Michigan we had three counties—Livingston, Macomb and St. Clair—that exceeded this rate. Livingston County had the highest rate in the region at 15.4 per 100,000 residents, with 28 suicides in the county in 2013. Macomb County had the second highest rate 14.8 (125) and St. Clair County had the third highest rate at 13.6 (22) in the region. In the seven counties throughout the region, and in the state overall, suicide was ranked as one of the top 10 causes of death in 2013.

While only certain cities throughout the region had suicide numbers available through the Michigan Department of Health and Human Services, we do know that Detroit had the largest overall number of suicides at 57 and Warren had the second highest number at 34; these are the first and third largest cities in the state, therefore when looking at total numbers (not the rate) it is not unexpected that they would also be the highest. The Detroit rate is below the state rate, however, at 12.3.

Southeastern Michigan Suicide Rate

Number of Suicides

Suicides by city

Nationally, the suicide rate was 12.1 suicides per 100,000 residents in

Suicide rates have been climbing at the state-level and in areas throughout the region. Michigan’s suicide rate is currently the highest it has been since at least 1980 (the first year this data is accessible online), according to the Michigan Department of Health and Human Services. From the 2004-2013, Macomb County had a suicide rate higher than that of the state for seven out of 10 years. In 2013, Macomb’s suicide rate was 14.8, an increase from 11.4 in 2004. Oakland County’s rate increased from 9.9 to 12.3 during that time frame (peaking at 13.9 in 2012), and Wayne County’s rate increased from 9.3 to 11.5 between 2013 and 2014.

In Oakland County, the rate peaked at 12.9 in 2012 and only slightly decreased to 12.3 in 2013. Director of Clinical Services for Health Management Systems of America Beth Combs cited the recession as one of the reasons for the national suicide rate climbed in the past 10 years, according to a 2013 Oakland Press article. She said the loss of a job, particularly for men between the ages of 35 and 55, can leave many feeling hopeless. However, a struggling economy does not solely cause one to take their own life, if at all. Suicide can be caused by mental health issues, feelings of hopelessness and/or loneliness, divorce, bullying, violence and several other issues, according to the Michigan Association for Suicide Prevention.

Annual rates for Livingston, Monroe, St. Clair and Washtenaw counties were not included in the below graph because the Michigan Department of Health and Human Services only had five year rolling averages for those counties.

Suicide rates over time

Suicide rates by age group

The suicide rate has nearly doubled for middle-aged Americans in the past decade, according to an Oakland Press article. Above we see that throughout Southeastern Michigan counties in 2013, the number of suicides were either highest among those 20-44 or 45-74 (this is how age categories are broken down by the Michigan Department of Health and Human Services). Livingston, Macomb and Wayne counties had the highest number of suicides in the 20-44 category while Monroe, Oakland, St. Clair and Washtenaw had the highest number in 45-74 category. At the national level, according to the Centers for Disease Control, the age group with the highest suicide rate (19.1) was those between the ages of 45 and 64.

According to the American Foundation of Suicide Prevention, adolescents consistently have lower suicide rates than other age groups.


In Michigan, while support groups for those suffering from suicidal thoughts and survivors of suicide do exist, mental health funding as a whole has been cut. In 2014, according to a Voice News article, Macomb County cut services to about 1,300 people and St. Clair County cut services to about to about 300. Overall, about $100 million was cut from the state’s mental health system in fiscal year 2014. In Macomb County, due to the state and Medicaid funding cuts, the county’s mental health authority cut its Survivors of Suicide (SOS) program and must rely on volunteers to staff its crisis center. Through general fund appropriations Macomb County has been able to re-establish the SOS program by contracting with an outside party. The Oakland County Community Mental Authority has taken a different route to promote suicide awareness prevention and support by a securing a five-year, $200,000 grant from the Substance Abuse and Mental Health Service Administration.

Despite monies being found outside of state funding to support suicide prevention, support and awareness programs we must be aware that rates are increasing locally and throughout the state as state funding for mental health services is declining.

Refocusing Housing Policy in Detroit: Moving to Healthy Housing

The majority of families in Detroit face the risk of death, injury, illness and loss of their children’s mental capacity every day because of hazards in their homes. Based upon highly detailed analyses of homes, it is clear that homes are causing burns, falls, asthma, allergies and lead poisoning.

A detailed survey of Detroit homes, conducted by the Center for Urban Studies at Wayne State University, found that over 62 percent of nearly 500 randomly selected homes have at least one high risk hazard that is likely to lead to poor health outcomes. [1] Of these, 4.2 percent of the homes have three or more hazards in these high risk categories. These dangerous housing conditions, combined with high unemployment and continued crime, are driving people to leave the city in droves.

Recent estimates show Detroit is continuing to lose residents at fast clip, about 1,155 residents[2] a month.

The City is working hard on unemployment (and the improvement of the economy as a whole is helping) and on increased and smarter policing. But on housing for existing residents, far more needs to be done, not just by the City, but by the State and the Federal Government.

To stop this decline and avoid the health consequences of dangerous homes, Detroit and policy makers need to focus far more efforts on providing safe and healthy homes.

As of July 2014, Detroit had a total of 252,173 occupied housing units.[3] However, our best estimates—very generous–are that only around 500 a year are being substantially improved to make them healthy and safe places to live, while just over 800 new housing units were built last year.[4] This is an estimated total of 1,300 homes being produced per year. At this pace, it will be many decades before vast majority of Detroit’s residents can live in safe and healthy homes.

What is a reasonable goal for creating healthy homes for Detroit’s children? A modest goal would be to house all of Detroit’s 193,150 children[5] in safe housing within 10 years. Approximately 3 percent of households (or around 6,000 children) already reside in housing built later than 1980[6] and, in most cases, this is relatively safe housing.[7] A total of about 79,400 households with children live in pre-1980 housing, and we estimate 38 percent are in houses that have only minor hazards[8]. That means 49,259 households are living in homes where one or more major hazard puts them at risk every day. Having nearly 50,000 households plagued with one or more hazards is unacceptable, which is why the families residing in these homes need either new or rehabilitated housing, and they need it soon.

Within 10 years—a short time in the policy world—policy makers should be able to address these needs. To avoid deaths, injuries, illness and loss of mental capacity caused by home environments, Detroit needs at least 4,900 new or rehabilitated homes a year. That is 3.8 times the number we estimate that is being produced now. And this is only the number necessary to protect families with children, not other vulnerable populations such as the elderly.

We need to massively expand renovation and construction, specifically, in these ways:

  • First, concentrate on housing with children, the most vulnerable among us, for rehabilitation;
  • Let’s give families with children a priority to relocate to subsidized housing that has been built after 1980 or that has been re-built and remediated, including lead abatement.
  • Make homes healthy through small investments. Some homes can be made healthy for an investment of substantially less than $5,000. The Green & Healthy Homes Initiative Detroit-Wayne County has shown this can be done. We need to do more of this.
  • Work to improve and remove hazards from current houses, rather than new construction. In cases where the abatement of lead hazards is necessary, the work can cost an average of $20,000,[9] still a fraction of the cost of a new construction.
  • Use code enforcement to force rental owners to substantially improve homes. Progress is being made here, but the number of code inspectors, cut sharply in the midst of Detroit’s fiscal difficulties, needs to be expanded substantially.
  • Ensure all new construction in Detroit includes affordable units.
  • Increasingly the private sector is rehabilitating homes in Detroit. These rehabilitations should pass all standards, especially including the removal of asbestos and lead-based paint. Currently, private sector rehabilitations do not have to pass all standards among governmental and lending organizations that control the sale and rehabilitation of many of these homes.
  • Leverage local and state resources, ranging from public entities to non-profit and for-profit organizations, to develop a robust rehabilitation program. Mayor Duggan has made a good start here with his zero interest loan program, but many families cannot meet the income and other requirements required by this program. We need grant programs to assist these low income homeowners.
  • Many thousands of families are living in homes that have black mold and other major damage from the August, 2014 floods across Detroit and other communities in Southeast Michigan. FEMA and other agencies need to invest in these homes to protect people from major health problems.

Healthy Homes Risk Assessments 

These maps below are based on a random sample of 500 homes spread broadly across Detroit. At each house assessors completed a Healthy Homes Rating System assessment that examined 29 potential hazards. This rating system is a HUD-endorsed rating instrument that assesses both the probability of injury and extent of injury from a hazard.  Three of the most frequently occurring and severe hazards were excess cold, mold and dampness and lead paint. The following three maps portray of the areas of Detroit that had the highest levels of hazards.

Lead

HHRSMold Cold


[1] This data is collected using the Healthy Homes Rating System (http://portal.hud.gov/hudportal/HUD?src=/program_offices/healthy_homes/hhrs). According to this system, a “high-risk” hazard is identified by a rating of A, B or C on a scale of A-J, A being highest likelihood of serious injury or death and J being minimal risk.

[2] This calculation is based on the April 1, 2010 estimate based on the Census and a 2014 estimate from SEMCOG, broken down into a monthly estimate by simple division across the months.

[3] SEMCOG Community Profile, City of Detroit (http://www.semcog.org/Data/Apps/comprof/people.cfm?cpid=5)

[4] At best only several hundred houses a year are being improved to systematically reduce health hazards. It is important to note, however, that about 806 new housing units were constructed in Detroit last year.

[5]U.S. Census Bureau, Demographic and Housing Estimates, 2013 American Community Survey 1-Year Estimates, Detroit city, Michigan (http://factfinder2.census.gov/faces/tableservices/jsf/pages/productview.xhtml?pid=ACS_11_5YR_DP04)

[6] U.S. Census Bureau, Households and Families, 2013 American Community Survey 1-Year Estimates, Detroit city, Michigan (http://factfinder.census.gov/faces/tableservices/jsf/pages/productview.xhtml?pid=ACS_13_1YR_S1101&prodType=table), U.S. Census Bureau, Households and Families, 2013 American Community Survey 1-Year Estimates, Detroit city, Michigan (http://factfinder.census.gov/faces/tableservices/jsf/pages/productview.xhtml?pid=ACS_13_1YR_DP04&prodType=table) This is probably an underestimate as we were unable to obtain of precise occupancy data for post-1980 housing.

[7] It is also important to know that lead paint was banned for use in residences in 1978 and taken off the shelves in 1980.

[8] This estimate is based on the results from the Healthy Homes Rating System being conducted in Detroit.

[9] This cost may include the replacement of all windows within the home as this is a major source of lead.

Seven percent of Detroit’s Liquor License holders located less than a half mile from an elementary school

In 2012, there were about 1,130 establishments in the city of Detroit with liquor licenses, of which nearly 7 percent were located within 0.1 mile of an early learning center or elementary school. In viewing the maps below, we see that the highest concentration of liquor license holders was within the Central Business District, with a medium density of the license holders spanning out into the lower Woodward Avenue, Corktown, and Lower East Central areas.

In Michigan there are several types of liquor licenses which can be obtained. These include licenses needed to sell just beer, those need to sell beer and liquor at a golf course, a hotel, a bar and at a private event. Additionally, brewpubs, distilleries, wholesalers (both those in state and those out of state bringing goods in), winemakers, and stores selling beer and/or liquor need a license. All liquor licenses in the state of Michigan are issued by the Michigan Liquor Control Commission.

According to a study by the Pacific Institute, a high concentration of liquor stores holders can may be related to several public safety and health problems, ranging from high rates of alcohol related hospitalizations, to pedestrian injuries, to high levels of crime and violence. According to data from the Federal Bureau of Investigation we know that Detroit’s crime rate was 2,122.9 per 100,000 residents in 2012, while the state of Michigan’s was 454.4 per 100,000 residents.

The above density map shows where the liquor licenses in Detroit are located and how some areas have a higher concentration of such licenses. As already stated, the highest concentration was in the Central Business District, where there is a combination of bars, restaurants, and liquor stores.

In the map below, we see where liquor license holders were located, along with what the poverty rates. The majority of the liquor license holders ( 683 or 60 percent) were located in census tracts where the poverty rates ranged between 25.1 and 50 percent. Although the Central Business District had the highest concentration of liquor license holders, the poverty rate in these census tracts was 25 percent or lower. Throughout the entire city there were 205 liquor license holders in census tracts where the poverty level was 25 percent or less.

Of the 1,129 liquor license holders in the city of Detroit, 79, or 7 percent, were located within 0.1 mile of an elementary school or early learning center.

According to the Pacific Institute study, a high concentration of liquor stores (in this post we look at liquor license holders) can lead to several public safety concerns, particularly crime.

In addition to crime being mentioned in the Pacific Institute study, it also discussed how the location of schools near liquor stores can affect the overall health and well-being of the community and the children within those communities. Although there are likely many suggestions on how to better a communities wellbeing, some solutions for Detroit officials may include: enforcing zoning ordinances to restrict nuisance activity by liquor stores or establishments that hold a license, using economic development strategies to transition current liquor stores into places for residents to access healthy foods, and working with the state to re-determine how many liquor licenses the city of Detroit should actually hold and/or what policies should be in place preventing the location of liquor license holders within a certain proximity to schools.

More than 50 percent of Wayne County children on Medicaid

Medicaid and MI Child are two different programs that provide children in the state of Michigan with the opportunity to have health care coverage. Medicaid is a federal health care coverage program that provides services to about 43 million children nationally; it is jointly funded by the federal government and each state. In Michigan, a child is automatically referred to the Healthy Kids Medicaid Program (Michigan’s child Medicaid program) if their family’s annual income is at or below 150 percent of the Federal Poverty Level, according to the Michigan Department of Community Health.

MI Child is Michigan’s version of the Child Health Insurance Program (CHIP), a federal initiative created by Congress in 1997 that is offered to uninsured children, ages 19 and below, of working parents. This program is also jointly funded by the federal government and states but its match rate, according to Medicaid.gov is typically about 15 percent higher than Medicaid; according to the Michigan League for Public Policy funding for this program is currently at risk. According to the Michigan League for Public Policy, this program was created to provide children with quality healthcare when their family earns too much to qualify for Medicaid but cannot afford private coverage. To qualify for MI Child, the child must have no comprehensive health insurance and the parents must have a gross adjusted income between 160-212 percent of the Federal Poverty Level, according to the MI Child Manual. For a family of four to be eligible for MI Child, the annual income limit is $47,700, according to the Michigan Department of Community Health.

In the maps below we see that there is a higher percentage of children covered by Medicaid in Southeastern Michigan than on MI Child. Also, while Wayne County had the highest percentage of children on Medicaid, Macomb County had the highest percentage of children with MI Child as their health insurance coverage plan. Overall though, each county had a higher percentage of children with Medicaid coverage than with MI Child coverage. This means that among those who applied for government health care coverage for their child, there was a higher percentage of families with income levels at or below 160 percent of the Federal Poverty Level than families with a gross income level between 160-212 percent of the Federal Poverty Level.

In the seven county region of Southeast Michigan, Wayne County had the highest percentage of children with Medicaid coverage in 2013, according to the Michigan League for Public Policy. In total, 55.5 percent of children aged 19 and under in Wayne County received Medicaid coverage in 2013. This amounted to about 258,000 children. The county with the second highest percentage of children receiving Medicaid coverage in the region in 2013 was St. Clair (42 percent or approximately 16,250 children).

Livingston County had the lowest percentage of children receiving Medicaid coverage with 18.5 percent in 2013. That same year, 40.8 percent of Michigan children received Medicaid coverage.

As noted, MI Child is Michigan’s version of the CHIP initiated by Congress in 1997 to provide healthcare to children who don’t qualify for Medicaid but whose families cannot afford private insurance. In the region, the percentage of children with MI Child coverage is smaller than those with Medicaid. For example, Macomb County had the highest percentage of children with MI Child coverage in the region in 2013 at 2.4 percent. During the same time period, 35.8 percent of Macomb County children received Medicaid coverage. Of the counties examined, Washtenaw County had the lowest percentage of children aged 19 and under receiving MI Child coverage in 2013 at .9 percent.

More affluent school districts in Southeastern Michigan have higher immunization waiver rates

In recent weeks news has broken about outbreaks of diseases many have thought were eradicated. From a mumps outbreak in the NHL to a measles outbreak at Disney World, in which the pattern includes seven different states with a whooping cough outbreaks, and a measles outbreak much closer to home in Grand Traverse and Leelanau counties- we are seeing that these diseases are indeed making a comeback, and many believe it is because of the growing number of children not being immunized.

While there have been no such outbreaks as mentioned above, immunization rates do vary in Southeastern Michigan, with some school districts having rates lower than the minimum thresholds needed to prevent the spread of disease. This is problematic, as low immunization rates threaten herd immunity and puts both vaccinated and non-vaccinated individuals at risk.

What is herd immunity?

The phrase “herd immunity” refers to protecting a community from disease by having a critical mass of its population immunized. Rather than just protecting the person vaccinated, vaccines can protect the entire community by breaking the chain of an infection’s transmission. However, for this to be successful, a certain number of people have to be vaccinated.

Epidemiologists have determined a basic threshold for infectious disease transmission by calculating both a “basic reproduction number” (R0), which represents how many people in an unprotected population one infected person can pass the disease along to – basically, a single person with mumps can pass it along to between 4 and 7 non-vaccinated people, while a single person with the measles could pass it along to between 12 and 18. The higher this R0 value is, the higher the percentage of vaccinated people in the population has to be, in order to prevent the spread of these illnesses. Therefore, in order to prevent an outbreak of measles, for instance, in a school district, 89-94% of students would have to be immunized.

diease

Photo credit © Tangled Bank Studios; data from Epidemiologic Reviews, 1993.

Furthermore, it is important for the population to be immunized in order to protect the health of those who cannot be vaccinated, such as infants and people with weakened immune systems. When large chunks of the community are not protected against these diseases, it is these groups of people whose health with be the most affected.

What are the immunization rates in Southeast Michigan schools?

Rates vary from well above minimum threshold numbers for even the most contagious diseases (Hazel Park and Southfield schools both have rates of 98%) to far below the threshold for any sort of protection (Madison Public Schools has the lowest, at only 70% vaccinated). However, it is important to note that not all school districts track vaccination rates uniformly – Inkster Public Schools, for instance, is reporting a 100% vaccination rate, but that’s based on an interview with a very small sample of students and may not be accurate.

Note: Data unavailable for Willow Run Schools (white area), as it was absorbed into Ypsilanti Schools this year.

One interesting trend present in the map is how more affluent districts seem to have lower vaccination rates than their less affluent counterparts, suggesting that non-vaccination is more of a trend in middle- to upper-income communities (although this certainly does not hold true for all). One important fact about herd immunity is that being vaccinated yourself (or vaccinating your children) matters less when the population isn’t immunized. For example, an unvaccinated student in Hazel Park would have less of a chance of catching a vaccine-preventable illness than a vaccinated student in neighboring Madison Heights, since it would be exceedingly difficult for disease to spread in a population that is nearly universally protected against it.

What is Michigan doing to boost vaccination rates?

As of January 1, 2015, the Michigan Department of Community Health changed their rules on obtaining an exemption waiver for vaccinations. Starting this year, parents will still have the right to refuse inoculations, but first they have to be educated by a local health worker about vaccines and the diseases they are intended to prevent, and sign a universal state form that includes a statement of acknowledgement that they understand they may be putting their own children and others at risk by refusing shots.

Currently, Michigan is one of 20 states that allow such an exemption. With this being the case, it was still easier to obtain a waiver here than it is elsewhere – for instance, Arkansas and Minnesota require a waiver form to be notarized, and Vermont requires parents who opt out to renew their waiver each year, instead of just for kindergarten, sixth grade, and in the event of a school transfer.

There is a definite correlation between the ease of getting an exemption waiver for vaccinations and the percentage of students who obtain waivers, as one study (Blank, Caplan & Constable, 2013) found that states with an easier process had waiver rates twice as high as those with more complicated ones. Therefore, by tightening these restrictions, Michigan’s vaccination waiver rates may decrease, and vaccination rates may increase.

Sources

http://www.pbs.org/wgbh/nova/body/herd-immunity.html
http://www.mlive.com/news/index.ssf/2014/12/vaccination_rule_change_propos.html
Blank, N.R., Caplan, A.R. & Constable, C. (2013) Excempting schoolchildren from immunizations: States with few barriers had highest rates of nonmedical exemptions. Health Affairs 32(7): 1282-1290. http://content.healthaffairs.org/content/32/7/1282.abstract


Monroe County had highest rate of heroin deaths in 2012

Drug overdose death rates have risen steadily since 1970, increasing fivefold since 1990. According to the Center for Disease Control, the most common drugs associated with these deaths are heroin, cocaine and opioid painkillers. Of the three, heroin causes the highest number of deaths in Southeast Michigan, according to the Center for Disease Control.

[Footnote: From CDC: http://www.cdc.gov/homeandrecreationalsafety/pdf/poison-issue-brief.pdf ]

Slide03Slide04

While Wayne County had the highest number of heroin deaths recorded in 2012 (62), when adjusted for population Macomb and Monroe counties had the highest rates (rates were calculated using 2012 population estimates from the American Community Survey).

Heroin is inextricably linked to opioid use, as many heroin users start with abusing opioid prescriptions and then graduate to illicit drugs. In the last 20 years, there has been a tenfold increase in the medical use of opioid painkillers, and with this expansion, there has been an increasing rate of opioid overdoses. In Southeast Michigan, Wayne County had the highest number of opioid deaths and Monroe County had the highest rate.

[From CDC: http://www.cdc.gov/mmwr/preview/mmwrhtml/mm6339a1.htm

From CDC: http://www.cdc.gov/homeandrecreationalsafety/pdf/poison-issue-brief.pdf]

Slide06Slide07

In the mid-2000s, a number of policies were enacted throughout the United States aimed at decreasing opioid misuse. Michigan created a law in 2010 to discourage the practice of “doctor shopping” in order to obtain prescription drugs, while some drugs, like OxyContin, were retooled to deter abuse by making them more difficult to crush. Since the mid-2000s, heroin death rates have increased dramatically.

[From State of Michigan: http://www.nascsa.org/news/midrshopperlaw12.10.pdf

New England Journal of Medicine: http://www.nejm.org/doi/full/10.1056/NEJMc1204141]

Slide09Slide10

While the trends for the opiate death rates are sporadic, this is likely due to the low number of deaths recorded during the time period, where a single instance can cause a huge uptick. However, there were visible upward trends in Wayne, Macomb and Monroe counties, with smaller upward trends in Washtenaw and St. Clair counties.

The heroin trends, however, are more pronounced, with a clear increase occurring between 2005 and 2012. One interesting point of note is that although Wayne County had the highest number of heroin deaths its rates generally remained consistent. Macomb, Monroe, and St. Clair counties, on the other hand, start the millennium off with generally low rates that noticeably spiked, and continued to remain high. However, for both heroin and opiate deaths Macomb County decreased from 2011-2012.

From 2000-2012, heroin accounted for 1,764 deaths in the Southeast Michigan area, opiates accounted for 534, and cocaine accounted for 500. Wayne County had the highest number of cocaine related deaths in 2012, with 39. However, when adjusted for population, St. Clair County had the highest rate, followed closely by Wayne, Macomb and Monroe counties.

Slide12Slide13

One item of note is that across all drugs, Oakland County consistently had the lowest overdose rates. Further research as to why that is may be useful. Polices that have been suggested to reduce overdose deaths include enhanced use of antidotes like naxalone, better access to treatment programs, and Good Samaritan 911 laws (where people reporting overdoses are given immunity), among others, although the effects of these programs have yet to be adequately studied.

Footnotes:


Highland Park has highest percentage of Supplemental Security Income recipients

Supplemental Security Income (SSI) is administered on a monthly basis by the federal government to the disabled, blind, or those above the age of 65. It is only provided to such recipients in these categories who have a limited income, with the purpose of aiding in the purchasing of food, clothing and shelter (for more info-click here). In 2014, the monthly SSI benefit rate increased to $721 for an individual and $1,082 for a couple; these increases were reflective of an increase in the Consumer Price Index, according to the Social Security Administration.   Thus an individual receiving SSI in 2014, would receive an annual income of $8,652.

This post examines the percentage of residents who received SSI in 2012 throughout the seven-county region of southeast Michigan. At that time, an individual’s monthly benefit was $698 and a couple’s was $1,048. In examining the percent of residents throughout the region who collect SSI, it is also helpful to understand the percentage of residents age 65 or older in each community and county. To view this information, please click here for our previous post.

Slide03Slide04Slide05Slide06

As noted earlier, SSI recipients must be either legally disabled, blind, or above the age of 65, and have limited incomes. The first map shows that Washtenaw County had the lowest percent of residents who received SSI in 2012. There were only four municipalities’ in that county where more than 4.01 percent of the population received SSI checks, and none of those communities had more than 8.01 percent of the population collecting SSI. It is important to note that Washtenaw County also had the lowest population of residents aged 65 or older in 2012. According to American Community Survey data, 10.3 percent of Washtenaw’s County was 65 years of age or older in 2012.

Macomb and St. Clair counties had the highest population of those 65 years of age and above in 2012 at 14.4 percent and 14.6 percent, respectively. However, both of these counties had fewer municipalities with more than 4.01 percent of the population collecting SSI benefits than Wayne County. Macomb had eight municipalities and St. Clair had 10 municipalities with more than 4.01 percent of the population receiving SSI benefits. Wayne County, where seniors comprised 12.7 percent of the population, had 22 communities with more than 4.01 percent of residents receiving SSI in 2012. In St. Clair County, the city of Memphis had the highest percent of residents collecting SSI benefits at 12.8 percent. In Macomb County, Richmond Township had the highest percentage of residents receiving SSI benefits at 5.1 percent.

The second map above breaks down the percentage of residents in each community who collect SSI benefits by census tract. For example, in St. Clair County, both the city of St. Clair and Casco Township are split in half with the percent of residents who collect SSI benefits. For both of these municipalities, one half has 4 percent or less of the population collecting SSI benefits while the other half has between 4.01 and 8 percent of the residents collecting SSI benefits. One reason for this may be that those census tracts with a higher percent of the population collecting SSI benefits house facilities such as nursing homes.

Slide08Slide09

In 2012 in Wayne County, there were five different municipalities where more than 10 percent of the population collected SSI benefits. Highland Park had the largest percentage at 19.2 percent. The City of Detroit was also one of the top five municipalities; 11.9 percent of that population collected SSI benefits in 2012. During that same year, 12.5 percent of Wayne County’s population, 14.3 percent of Highland Park’s population and 11.5 percent of Detroit’s population were 65 years of age or above.

The final map shows the percent of residents receiving SSI in each census tract in Detroit and the surrounding areas. There were five tracts where 32.1 percent or more of residents collected SSI benefits.