Average Life Expectancy in Southeastern Michigan Varies Greatly

We know that one of the outcomes of poverty and the consequent lack of high quality medical care is a shorter life. How big is that difference in Southeastern Michigan? It turns out that new data from the U.S. Centers for Disease Control gives us an idea. That data, at the Census Tract level, shows that average life expectancy ranges from 62 in some inner city Detroit tracts to 90 in some suburban tracts.

As the second first map below shows, most of Livingston County was in the 76-80 years of age range, although there are 18 Census Tracts in Livingston County where the average life expectancy is between 86 to 90 years of age. It is in Wayne County where all the Census Tracts are located, with the exception of one, with the lowest average life expectancies. As the second map shows, in the City of Detroit, there are 14 Census Tracts where the average life expectancy is between 62-65 years of age. Additionally, there are about 40 Census Tracts where the average life expectancy is between 68-70. Most of these Census Tracts are located west of Highland Park, with several located along Grand River Avenue. The only other Census Tract in the region with an average life expectancy below 66 years of age is in Monroe County in the City of Monroe.

The extremes of the data are attenuated when we examine county averages as shown in the third map. The average life expectancy in Southeastern Michigan at the county level ranges from 74.5 years of age to 79.6 years of age. The average life expectancy in the U.S. is 78.8 years of age. At the county level, Livingston County has the highest average life expectancy at 79.6 years of age.

While there is no specific information on what causes low life expectancy in any specific area, a Michigan Department of Health and Human Services spokesman said higher life expectancies are often related to higher education and access to health care and healthy food. In future posts we will examine what may cause the lower life expectancies in the Detroit area.

Southeastern Michigan Net Out-of-State Net Migration Far Lower than County-to-County Migration

Just as our previous post showed all seven counties in the Metro-Detroit region were gaining residents from other Michigan counties, additional data shows that growth goes beyond Michigan residents. According to 2015 Census data (the most recent migration data available), all counties in the seven county region had an overall net growth of residents, with the exception of Washtenaw County. According to the data, Washtenaw County had a net migration loss of five residents; there were 523 new residents who moved to Washtenaw County from outside of Michigan and 528 Washtenaw County residents who left the state for another. According to the data, Oakland County had the largest net gain of out-of-state residents at 1,661; 3,825 out-of-state residents moved to Oakland County in 2015 and 2,164 left Oakland County for another state. The only other county that had a net gain of more than 1,000 new residents was Wayne County. In total, 6,542 out-of-state residents moved into Wayne County in 2015 and 5,154 Wayne County residents left the state, meaning there was a net growth of 1,388 residents.

In comparing migration patterns between county-to-county in Michigan (previous post) and those moving in and out of the state, the data clearly shows migration within the state is much more common. For comparison, in 2016 there were 33,148 people who moved to Wayne County from other areas in Michigan while there were 6,542 out-of-state residents moved into Wayne County in 2015. In-state migration appears to be much easier for residents, but, as this post highlights, out of state migration into the seven county region is higher than those leaving the area for outside of Michigan.

Washtenaw County Sees Highest Percentage on In-State Population Influx

In 2016, Washtenaw County had the highest percentage of residents move into its boundaries in Southeastern Michigan, according to Census data. According to the data, 5.7 percent of the Washtenaw County population (or 20,213 people) was made up of residents who moved there from other counties in the State of Michigan in 2016. The large share of Washtenaw County residents that attend the University of Michigan from other counties in the state may help account for this result.

On the opposite end of the spectrum, Wayne County had the lowest percentage of Michigan residents moving into the county from elsewhere in the state in 2016. According to the data, 1.9 percent of Wayne County’s population was made up of people who moved there from elsewhere in the State of Michigan. But, despite Wayne County having the lowest percentage of residents from elsewhere in Michigan move into its boundaries, it had the second highest overall number of people moving there. In total, there was an estimated 33,148 people who moved to Wayne County in 2016 from other areas in Michigan.

Oakland County was the only county in the region with a higher number of Michiganders who moved inside its boundaries in 2016. According to the Census data, there were 42,748 people from Michigan, outside of Oakland County, who moved to Oakland County in 2016. This number made up 3.5 percent of the Oakland County population.

In terms of sheer volume, Monroe County had lowest number of people move there from elsewhere in the state at 4,004 people; this was equivalent to 2.7 percent of its population.

While the map above shows the percentage of Michiganders who moved into a Southeastern Michigan county from elsewhere in the state in 2016, the map does not represent the net gain, or loss, of the migration in each county. Next week we will be diving deeper into the county-to-county migration in Southeastern Michigan to better understand how, and if, counties in the region are growing.

Southeastern Michigan’s Population Slightly Increases, Auto Sales and Unemployment Decreases

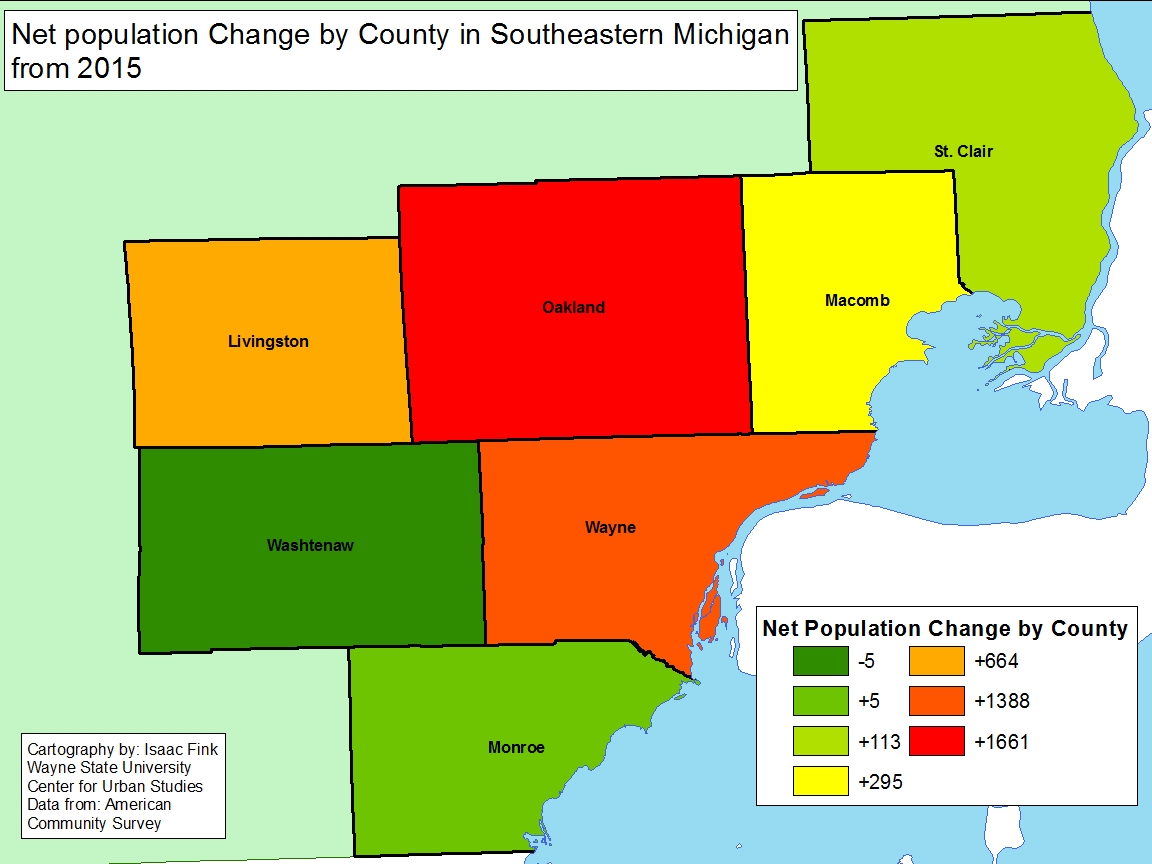
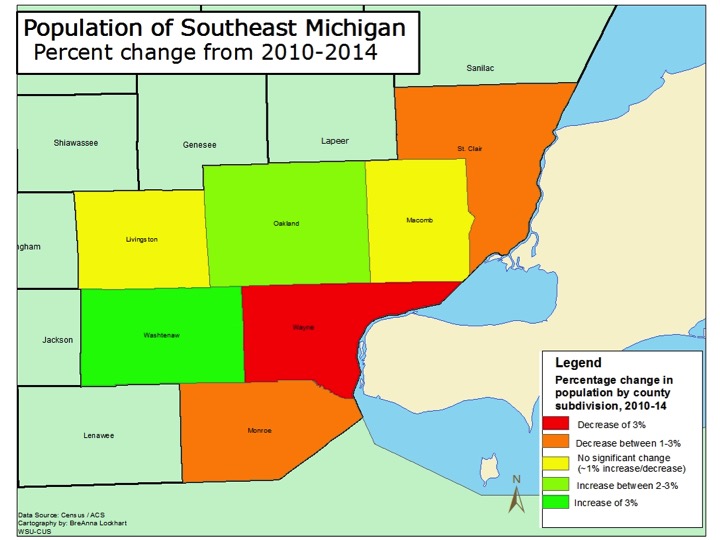
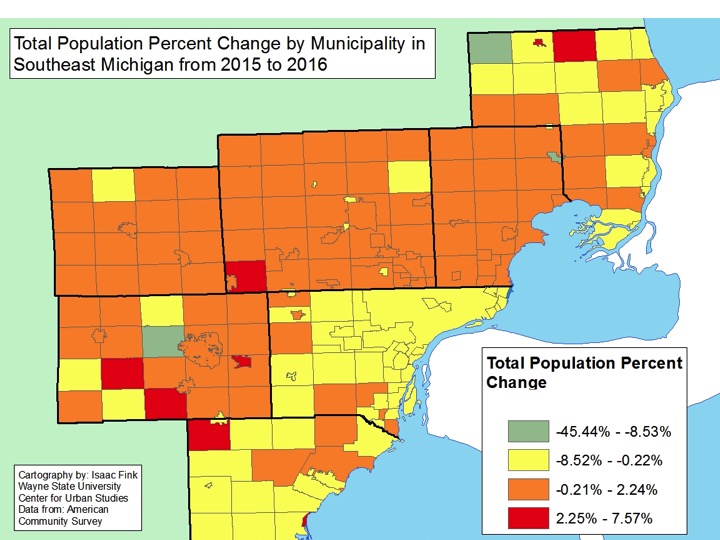
  • Detroit and Wayne County suffered the loss of populations between 2015 and 2016, while some of the region’s outermost communities experienced growth;
  • The unemployment rate decreased at the State and local levels(monthly);
  • Regionally, Livingston County’s unemployment rate remains the lowest;
  • The Standard and Poor’s Case-Shiller Home Price Index for the Detroit Metropolitan Statistical Area shows home prices continue to increase monthly and annually while national mortgage rates are became higher than those throughout the State and the City of Detroit.
  • Auto sales took a dip between 2016 and 2017, while employment in auto manufacturing increased

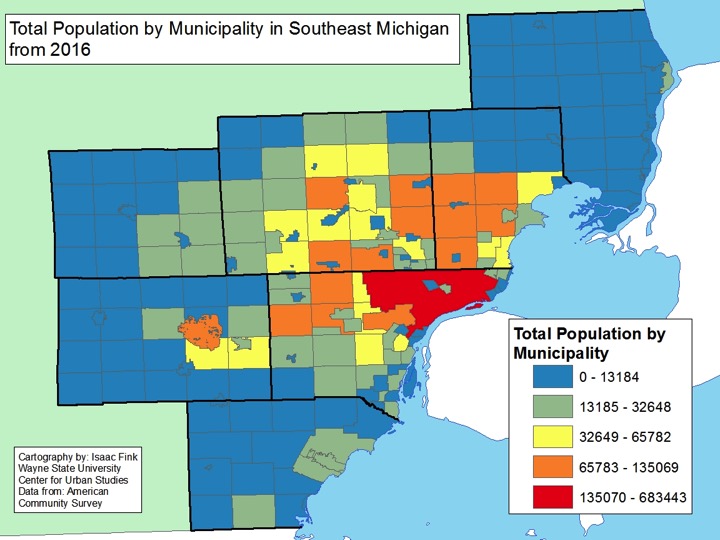
The City of Detroit remained the most populated City in Michigan, according to 2016 Census data. However, Detroit’s population numbers continued to decline. In 2016, it was reported that the City of Detroit had a population of 683,443 and in 2015 the population was at 690,074. This 6,631 person population loss was equivalent to nearly a 1 percent loss in population. Aside from Detroit remaining as the most populated city regionally, and statewide, the other four of the top five most populated cities in Southeastern Michigan were: Warren (135,069), Sterling Heights (131,674), Ann Arbor (118,087) and Clinton Township (99,193). Of all the five communities, Detroit was the only City to lose residents. Of the 210 communities for which data was available was available for, 98 lost residents between 2015 and 2016.

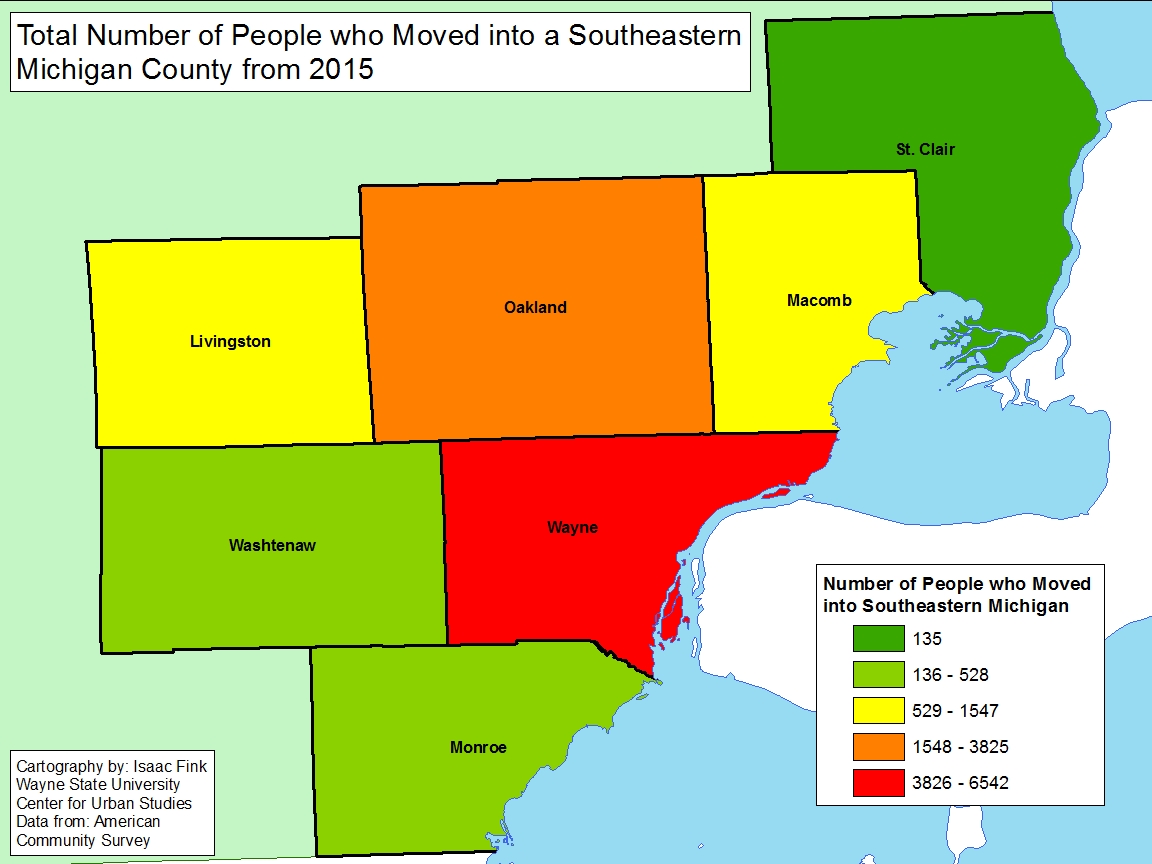
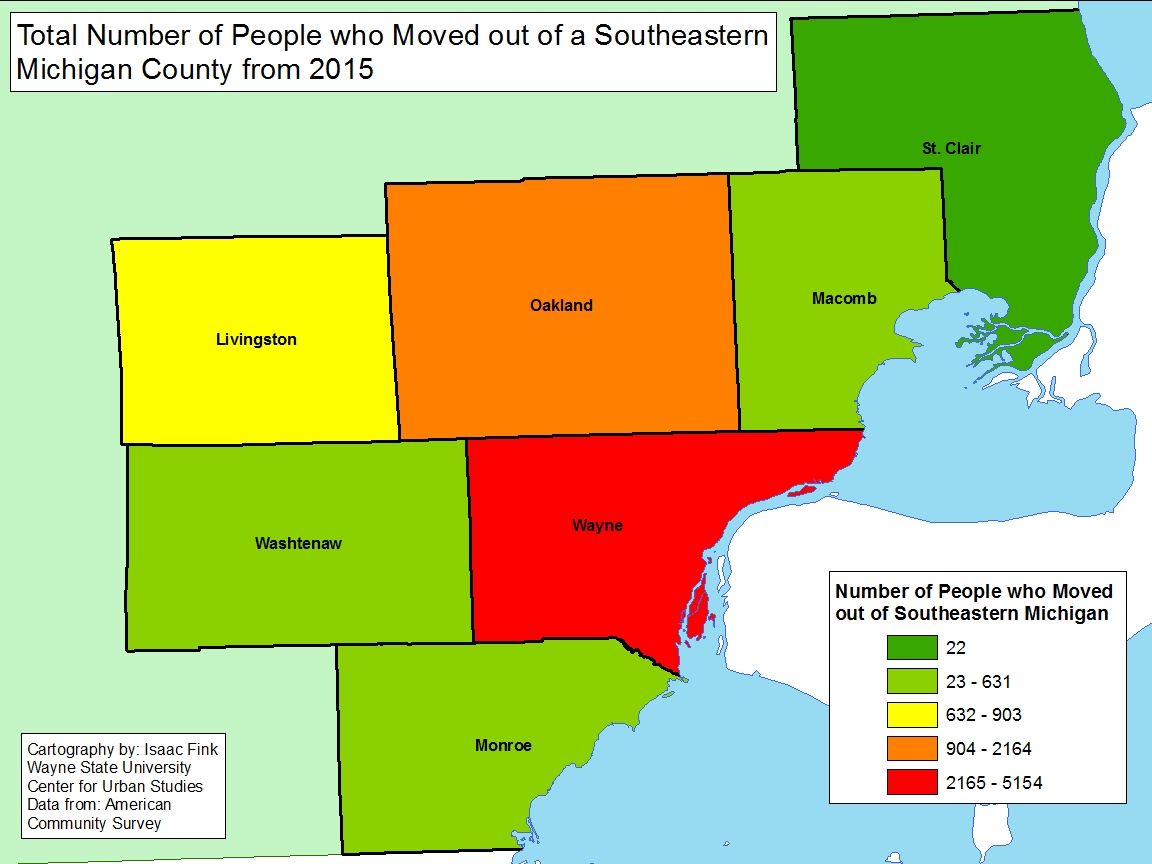
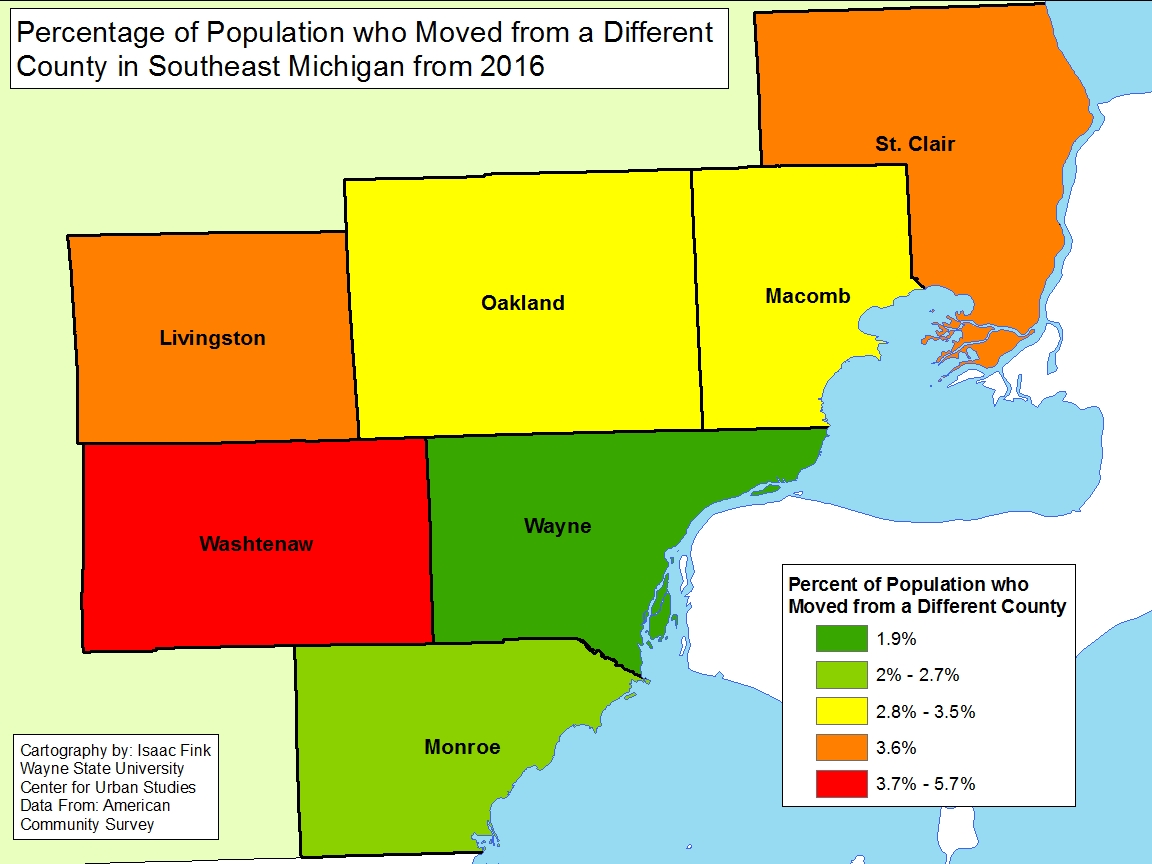
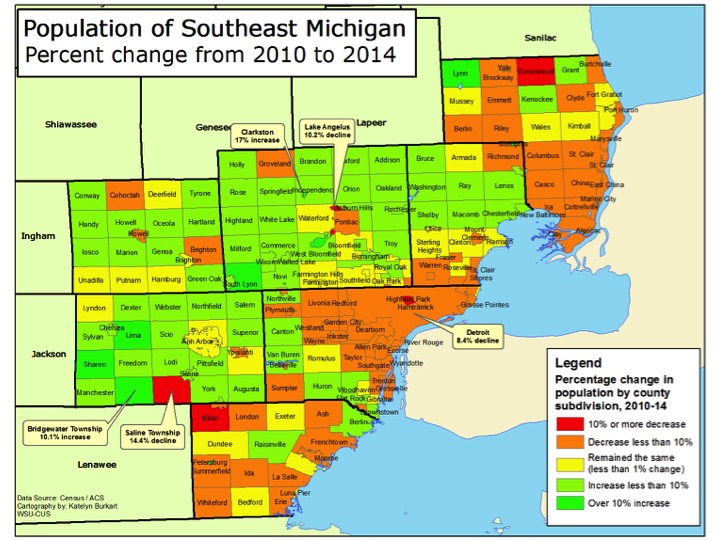
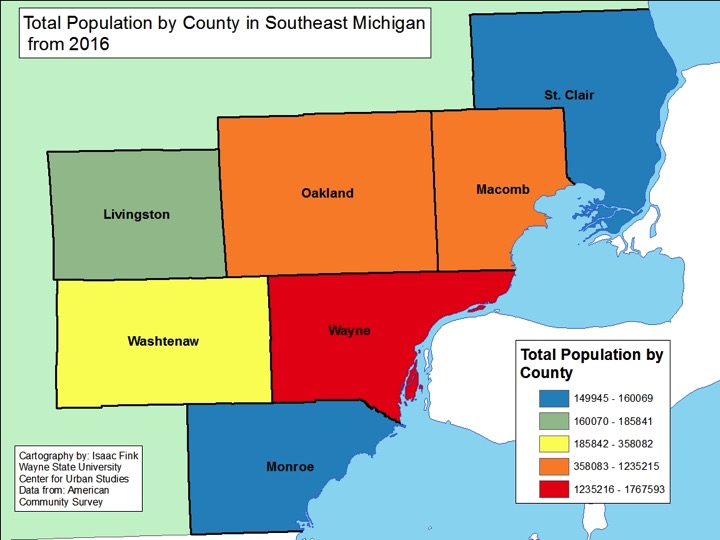
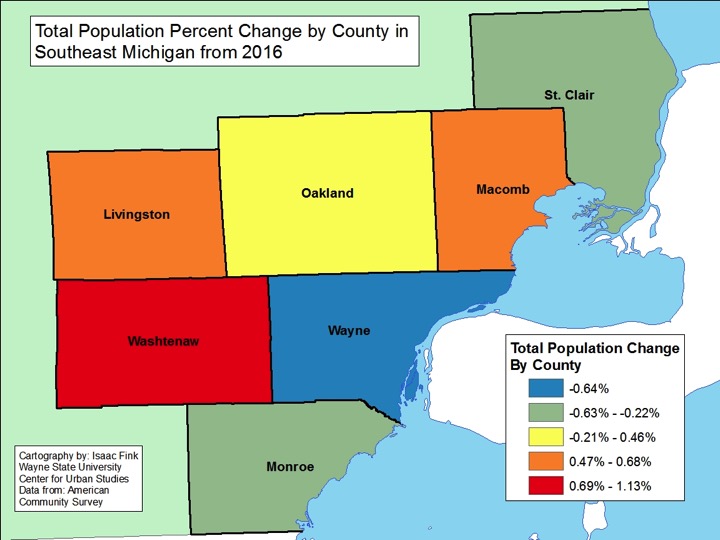
Overall, while population gain, and loss, between cities wasn’t extreme, the trend of some of the region’s most rural communities growing continued. For example, Greenwood Township in St. Clair County grew by about 800 people, which was about an 8 percent increase. In terms of percent change, the top 10 communities that experienced growth, ranging from percent change increases of 5.8 to 1.8 percent, were all located outside of the region’s urban centers, with the exception of Ypsilanti. This narrative is further strengthened by the fact that, at the County level, four counties that grew in population between 2015 and 2016. Those four were Oakland, Washtenaw, Livingston and Macomb counties. As the map shows, majority of the communities in these counties experienced no more than a 0.21 population loss, if a loss occurred at all. In terms of percent change, Washtenaw County grew the most at 1.13 percent, which was equivalent to an additional about 4,000 people calling Washtenaw County home. Conversely, Wayne County experienced the greatest population loss in the county at -0.64 percent, which was equivalent to about a 11, 375 people leaving the county between 2015 and 2016. Despite the population loss, Wayne County remains the most populated county in the region with 1,767,593 residents.

When examining the bigger picture, the data shows that, as a whole, Southeastern Michigan grew by about 3,700 residents between 2015 and 2016. In 2016 there were 4,716,448 residents and in 2015 there were 4,712,709.

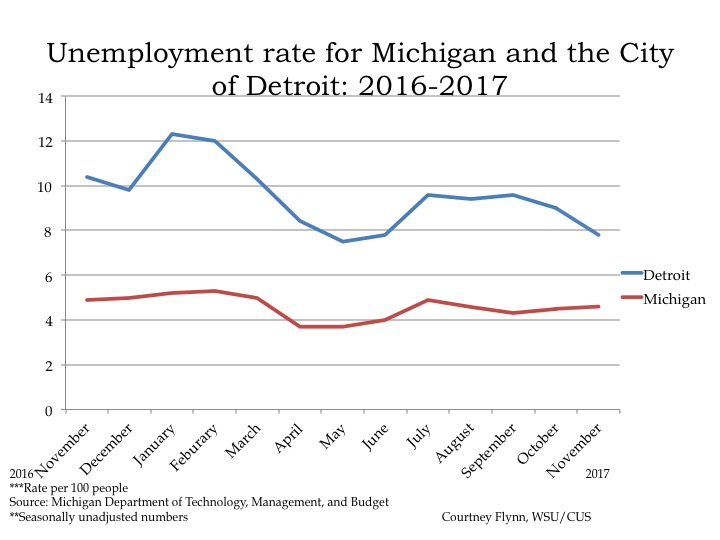
In November of 2017 the unemployment rate for the State of Michigan was 4.6, a slight increase from the October unemployment rate of 4.5, according to the most recent data provided by the Michigan Department of Technology, Management and Budget. The State unemployment rate for November was 0.3 points below what it was in November of 2016.

The City of Detroit unemployment rate was reported to be 2.6 points lower in November of 2017 than what it was reported at in November of 2016. For November 2017 the unemployment rate was reported at 7.8; in 2016 it was reported to be 10.4.

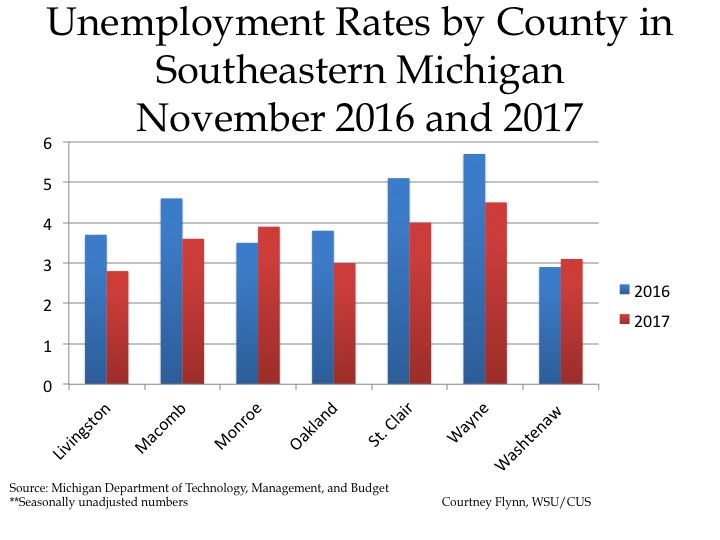
The chart above displays the unemployment rates for each of the seven counties in Southeastern Michigan for November of 2016 and 2017. Wayne County had the highest unemployment rates for both 2016 and 2017 (5.7 and 4.5 percent, respectively). In November of 2017, Livingston County had the lowest unemployment rate at 2.8 while Washtenaw County had the lowest rate in 2016 at 2.9. By November of 2017, Washtenaw County’s unemployment rate increased to 3.1. In November of 2017, Washtenaw and Monroe counties were the only two in the region that had unemployment rates higher than in November of 2016.

Wayne and St. Clair counties were the only two in the region with unemployment rates at or above 4 percent in 2017.

Wayne County had the largest unemployment rate decrease between November 2016 and 2017 at 1.3. In November of 2017 Wayne County had a unemployment rate of 4.5, and in 2016 that rate was 5.7.

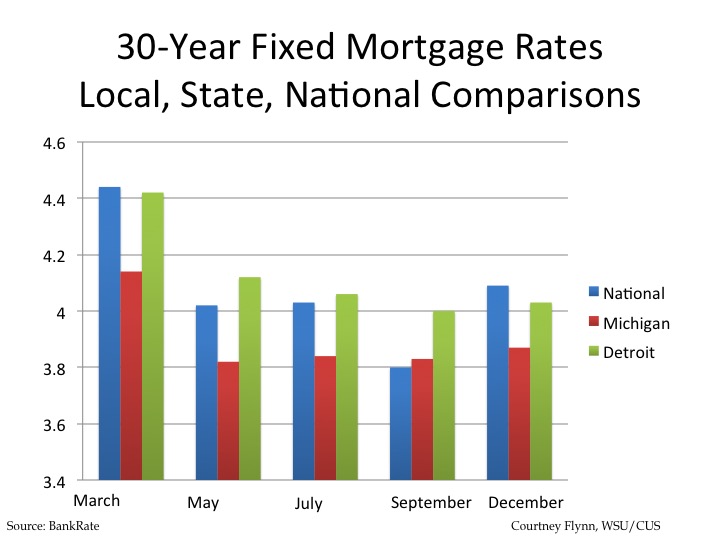
Data on the national, state and local average 30-year mortgage interest rates show rates increasing across all three from September to December. These rates were provided by bankrate.com, which does a national survey of large lenders on a weekly basis. As a 30-year fixed rate mortgage is the most traditional form of home financing, we chose it to show the rate differences.

It was the national interest rate with the highest average for in December of 2017 at 4.09, which was 1.1 points higher than the last time we examined this data, which was in September of 2017 .

In December of 2017 Detroit’s average 30-year fixed mortgage interest rate was 4.03, a rate that was higher than the state average. It showed an increase after declining from March through September.

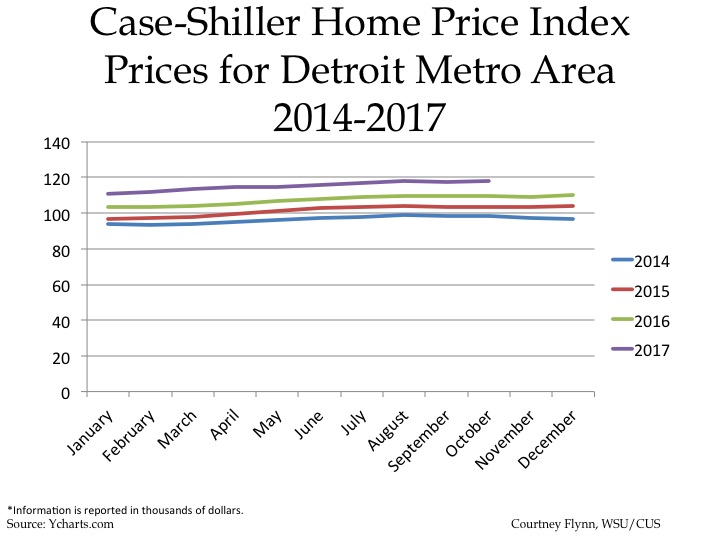
The above charts show the Standard and Poor’s Case-Shiller Home Price Index for the Detroit Metropolitan Statistical Area. The index includes the price for homes that have sold but does not include the price of new home construction, condos, or homes that have been remodeled.

According to the index, the average price of single-family dwellings sold in Metro Detroit was $117,850 in November 2017; this was $1,170 higher than the average family dwelling price in May. Also, the November 2017 price was an increase of $8,060 from June of 2016 and an increase of $14,440 from November of 2015 and an increase of $20,560 from November of 2014.

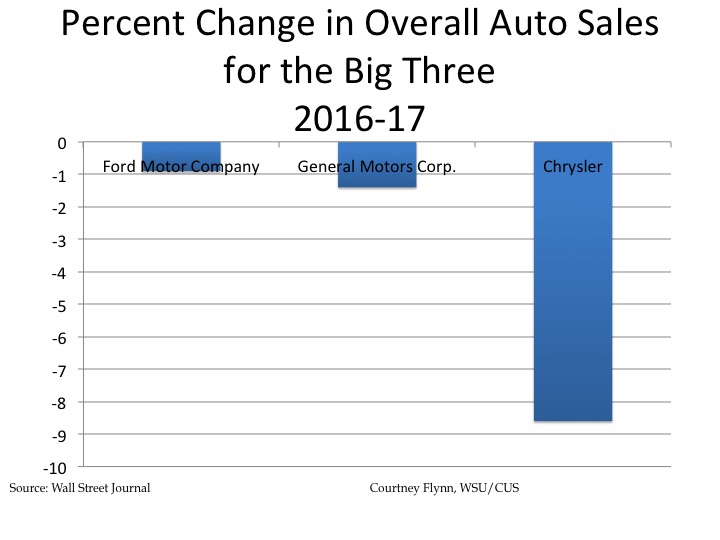
According to data from a recent Wall Street Journal article, overall year-to-date auto sales for the Ford Motor Company, General Motors and Chrysler all declined between 2016 and 2017. This data includes sales of domestic and import cars and trucks. Chrysler suffered the biggest hit, according to the data, with an 8.9 percent total decrease in sales. Ford suffered a .9 percent decrease in sales and General Motors suffered a 1.4 percent decrease.

Of all the automotive companies, American and international, General Motors had the largest percent of market share in 2017 at about 17 percent with about 3 million sales.

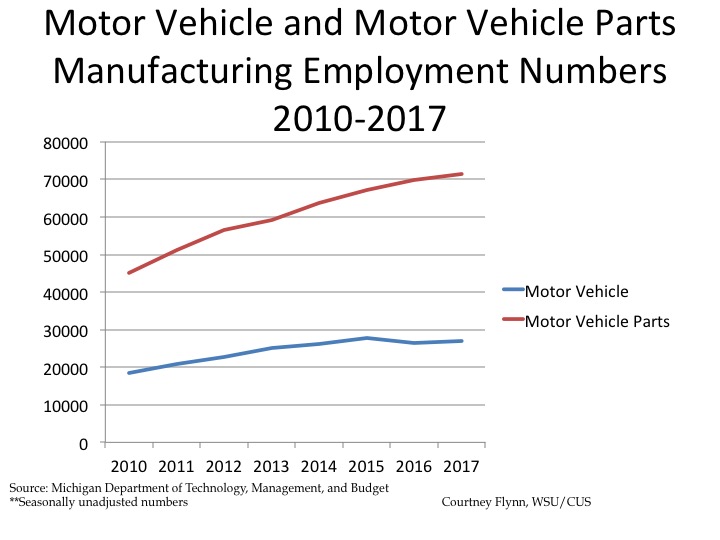
Between 2010 and 2017 employment in both the motor vehicle and motor vehicle parts manufacturing employment sectors has grown in the Detroit Metropolitan Statistical Area. In 2010 there were 45,100 employees in the motor vehicle employment manufacturing sector and 18,400 in the motor vehicle parts manufacturing sector for an over all total of 63,500. By 2017 there 71,500 employees in the motor vehicle manufacturing employment sector, a number that has steadily increased over the last eight years. For the motor vehicle parts manufacturing sector there were 27,100 employees. The total across both sectors in 2017 was 98,600. So, compared to 2010, these two have increased overall by 35,100, more than 50 percent. However, the rate of increase for vehicle manufacturing has slowed, while the rate for parts manufacturing has stabilized, after a slight drop.

Detroit Vacancy Rate Remains at 22 Percent

There were only 26 fewer vacant Detroit properties between June 2016 and June 2017, according to the U.S. Postal Service. This was a tiny decrease compared to the total number number of Detroit addresses of 396,416, but it was a decrease in vacancies. The vacancy rate in the City of Detroit remained just above 22 percent.

There were two other decreases that were probably more important. First, there was a substantial decrease in the total number of addresses, likely indicating that more vacant properties are now vacant lots. Overall, between June of 2017 and June 2016 the total number of addresses decreased by 5,388. By June of 2017 there were 396,416 total addresses counted by the U.S. Postal Service, and of these, there were 88,329 vacant addresses. Of the 396,416 total addresses, 353,140 were residential addresses and 80,296 of those were residential vacancies, meaning the residential vacancy rate was 22.7.

Second, although the decrease in the number of vacant addresses was small between June of 2016 and 2017, the decline in the number of “no stat” addresses was much larger; that number decreased by 3,515 in the last year. There is substantial ambiguity in that number, though it likely indicates some improvement in the housing market. Mail carriers denote properties as being either “vacant” or “no-stat.” Carriers on urban routes mark a property as vacant once no resident has collected mail for 90 days. Addresses are classified as “no-stat” for a variety of reasons. Addresses in rural areas that appear to be vacant for 90 days are labeled no-stat, as are addresses for properties that are still under construction. Urban addresses are labeled as no-stat when the carrier decides it is unlikely to be occupied again any time soon — meaning that both areas of high growth and severe decline may have no-stat addresses.

The maps below show the Detroit address vacancy rates by Census tract for June 2017 and the change in vacancy rates between June 2016 and June 2017. In total, there were about 65 Census Tracts in Detroit with total vacancy rates above 34 percent. The Census tract with the largest vacancy rate between June 2017 and June 2016 was located in a pocket of Census tracts along I-96 where the vacancy rates did not drop below 38 percent. The vacancy rate for this Census tract 54.3 percent. When looking at the second map the data shows that the largest vacancy rate increase for a Census tract was located in Southwest Detroit; the vacancy rate increase for that Census tract was 8.4 percent. The map also shows the largest vacancy rate increases were primarily concentrated in an area just east of Hamtramck and on the western side of the city near I-96.

Overall, the story this data shows is that the number of homes in the City is decreasing, and the number of vacant homes is slightly decreasing, though the exact number is ambiguous, given the uncertainty surrounding “no-stat” numbers. The decline in “no-stat” numbers is, however, consistent with recent population estimates. According the U.S. Census Bureau, between 2015 and 2016 the City of Detroit has lost about 3,541 residents; its population in 2016 was reported to be 672,795.

Oakland, Washtenaw Counties Have Highest Foreign-Born Populations in Southeastern Michigan

Of the four major counties in Southeastern Michigan, both Oakland and Washtenaw counties had the highest percentage of foreign-born populations in 2015, according to the American Community Survey. Oakland County ranked just above Washtenaw County though; the foreign born population percentage in Oakland County was 11.8 percent and in Washtenaw County it was 11.6 percent. In Oakland County there are three municipalities where more than 20.1 percent of the population was foreign born in 2015, while in Oakland County there was only one municipality.

Of all the municipalities in the region though it was Hamtramck with the highest percentage of foreign-born residents at 46.6 percent.

The U.S. Census Bureau defines a foreign-born person as “anyone who was not a U.S. citizen at birth. This includes respondents who indicated they were a U.S. citizen by naturalization or not a U.S. citizen. Persons born abroad of American parents or born in Puerto Rico or other U.S. Island Areas are not considered foreign born.”

Slide03 Slide04

In Macomb County in 2015, 10.6 percent of the population was foreign-born, with the city of Sterling Heights having the largest foreign-born population. In Sterling Heights 25.8 percent of the population was foreign-born; this is equivalent to 33,598 people in the city. Of those residents, 58.7 percent were naturalized U.S. citizens and the remainder (41.7%) were not U.S. citizens.

Aside from Sterling Heights, Warren and Shelby Township had amongst the highest foreign-born populations at 12.1 percent and 13.5 percent, respectively.

All of northern and eastern Macomb County had less than 5 percent foreign-born populations.

Slide06

In Oakland County, it was the western side of the county where majority of the municipalities had less than 5 percent of their populations made up of foreign-born residents. The city of Troy had the highest percentage of foreign-born residents in Oakland County at 25.8 percent, followed by West Bloomfield Township at 20.9 percent and Novi at 20.8 percent.

In Troy, 52 percent of the foreign-born residents were naturalized U.S. citizens and the remainder were not U.S. citizens. Between Troy, Novi and West Bloomfield Township, Novi had the highest percentage of non-U.S. citizens at 55 percent.

Slide08

In Washtenaw County, Ann Arbor Township had the highest percentage foreign-born residents at 21.8 percent. This percentage was the equivalent to about 971 people in the charter township. Of these people, 49 percent were naturalized U.S. citizens and the remainder were not U.S. citizens. The city of Ann Arbor and Pittsfield Township followed Ann Arbor Township in terms of foreign-born populations. The percentage of foreign-born residents residing in Ann Arbor was 17.9 percent and in Pittsfield Township was 18. percent. These percentages were equivalent to 20,762 foreign-born residents in Ann Arbor and 6,753 in Pittsfield Township.

Slide10

In Wayne County, Dearborn and Hamtramck had the highest percentage of foreign-born residents at 26.4 percent and 46.6 percent, respectively. In Dearborn, of the 25,410 foreign-born residents 65 percent were naturalized citizens. In Hamtramck, of the 9,589 foreign-born residents, 45 were naturalized U.S. residents.

In Detroit, the foreign-born population made up about 37,000 residents but was equivalent to 5.1 percent of the population.

Slide12

Vacancy Rates in Detroit Remain Stagnant

In the City of Detroit in September 2016 the total percentage of vacancies was 21.9 percent, according to the U.S. Postal Service. This vacancy percentage was nearly unchanged from the 22 percent total vacancy rate the U.S. Postal Service reported in June of 2016. Similarly, when looking at the percentage of residential vacancies and business vacancies in the City these too nearly went unchanged between June and September. The U.S. Postal Service reports that the September 2016 residential vacancy rate was 22.4, down 0.1 percent. The September 2016 business vacancy rate was 25.9, up .02 percent from June.

Overall, in the month of September there were 87,762 reported total vacancies, 80,002 of which were residential, 7,670 of which were businesses and 104 of which were considered “other.” Between June and September, the total 0.1 percent vacancy decrease was equivalent to a decrease of 579 vacant addresses; there was a decrease of 641 vacant residential addresses and an increase of 62 vacant business addresses.

The first two maps below show, by Census Tract, the total number of vacancies and the total percentage of vacancies. The Census Tract with the highest number of total vacancies is on the east side, just north of Belle Isle. This Census Tract had 906 vacancies, which was 50.6 percent of the total number of structures in that Census Tract.

As the first map shows, majority of the Census Tracts with vacancies above 400 were located either on the cities east side, or just west of the downtown area of Detroit. When looking at the total percentage of vacancies in Detroit by Census Tract we see there is a slight shift in which Census Tracts have among the highest amount of vacancies in terms of percentage versus total numbers. This is directly related to the total number of structures in each Census Tract. For example, just east of Hamtramck there is a Census Tract with 229 vacant addresses, a number that does not put in amongst the Census Tracts with the highest vacancy numbers. However, these 229 vacant addresses in that Census Tract mean there is a 42.9 percent vacancy rate. Just south of that Census Tract is another where there are 307 vacancies which make up 18 percent of the structures there.

slide4

slide5

When comparing the total number of vacancies between September 2015 and 2016 we see that there are several Census Tracts that experienced an increase in the total number of vacancies. It was a Census Tract just north of Highland Park that experienced the greatest increase at 7.8 percent. Vacancy increases over the last year occurred the most on the City’s east side, however they were not isolated there.

Overall, while there were Census Tracts with vacancy rate increases there was a total decrease of 5,446 vacant addresses between September 2015 and September 2016.

In addition to these changes, in September of 2016 there was a decline in the number of “no stat” addresses; that number decreased by 2084 in the last year. Mail carriers denote properties as being either “vacant” or “no-stat.” Carriers on urban routes mark a property as vacant once no resident has collected mail for 90 days. Addresses are classified as “no-stat” for a variety of reasons. Addresses in rural areas that appear to be vacant for 90 days are labeled no-stat, as are addresses for properties that are still under construction. Urban addresses are labeled as no-stat when the carrier decides it is unlikely to be occupied again any time soon — meaning that both areas where property is changing to other uses and areas of severe decline may have no-stat addresses.

slide7

Wayne County’s population loss remains the largest in the region—2010 to 2014

Between 2010 and 2014 Oakland and Washtenaw counties were the only two counties in the seven-county region that experienced a population change increase. According to U.S. Census Data, Oakland County’s population increased from 1.2 million in 2010 to 1.24 million in 2014 and Washtenaw County’s population increased from about 345,000 to 357,000. In Oakland County, three communities-Clarkston, Orchard Lake and South Lyon-experienced more than a 10 percent population increase. In Washtenaw County, there were also three communities-Bridgewater, Sharon and Lima townships-that experienced a population increase above 10 percent between 2010 and 2014.

In the same time frame, Wayne County experienced a 3 percent population decrease. In 2010 Wayne County’s population was about 1.82 million and in 2014 it was about 1.79 million. Of the communities that make up Wayne County, Highland Park had the largest population decrease at 13.5 percent; in 2010 the city’s population was 11,776 and in 2014 it was 10,375. Detroit’s population change was a decrease of 8.4 percent between 2010 and 2014. In 2010 Detroit’s population was 713,777, and in 2014 it was 680,250 . At the Census Tract level we see that most of the population loss above 10 percent occurred in neighborhoods along the eastside of the City of Detroit. Compared to the 43 Census Tracts in Detroit that lost more than 10 percent of its populations between 2010 and 2014 there were 24 Census Tracts that experienced a 50 percent or more population increase. Overall, at the Census Tract level, more areas in the City of Detroit experienced population increases than decreases, however, the number of people lost in certain Census Tracts is what caused the overall population decrease.

Slide3

Slide4

Between 2000 and 2010 there were larger decreases (as might be expected given the longer time period) and smaller increases in population across the seven county region. Again, Wayne County had the largest population decrease of the seven counties. In 2010 Wayne County’s population was recorded at about 2 million and in 2010 it was about 1.82 million. The more rural counties-Livingston, Washtenaw and Macomb-experienced population increases above 4 percent between 2000 and 2010. At the more local level, only four communities-Independence Township, Sylvan Township, Detroit and Highland Park-experienced population decreases above 20 percent. Most of the population loss throughout the region was concentrated around Detroit and its inner-ring suburbs. When discussing the communities that experienced population increases above 20 percent, Livingston County, which had the highest population increase between 2000 and 2010 of the seven counties, had the largest number of communities with such high population increases. In Wayne County, which experienced an overall population decrease, only three communities-Northville, Woodhaven and Brownstown-experienced population increases above 20 percent. Two of those communities-Woodhaven and Brownstown-are located in the southern portion of Wayne County, and Northville is located in the northwestern portion of the county.

Slide7

Slide8


Washtenaw County gains 770 residents while Livingston loses more than 1,000

Last week, we explored migrations in and out of the tri-county region using 2012-13 IRS tax returns. This week, we highlight the remaining four counties in Southeastern Michigan (Livingston, Monroe, St. Clair and Washtenaw) where there was a total net gain of 32 residents. All counties, except Livingston, experienced net gains. Washtenaw County had the highest net gain of residents at 770, while Livingston County had a net loss of 1,085. Even with such gains and losses, the data presented in this post shows that majority of the migration in and out of a these counties occurred within the state’s boundaries.

WashtenawCountInMigration

WashtenawCountyOutMigration

Washtenaw County experienced a net increase of 770 new residents, according to 2012-13 tax returns. The IRS data shows that, there were 9,596 tax returns filed by new Washtenaw County residents and 8,826 filed by former Washtenaw County residents. Former Wayne County residents contributed the most to the population influx with 2,529 of them moving to Washtenaw County. Oakland County contributed the second highest number of new residents at 891, followed by Livingston County at 649. In total, of the 9,596 new residents who moved into Washtenaw County, 5,881 were from other Michigan counties. From outside of Michigan, Cook County, Illinois (where Chicago is located) contributed the highest number of new residents at 344; Los Angeles County in California contributed 130 new residents to Washtenaw County.

When viewing the number of residents who left Washtenaw County for elsewhere, 2,225 residents moved to Wayne County (Washtenaw County had a net gain of 304 residents from Wayne County). Additionally, Washtenaw County lost 915 residents to Oakland County (a net loss of 24), and 536 residents to Livingston County (a net gain of 113). In total, Washtenaw County lost 5,785 residents to other Michigan counties, for a net gain of 96.

From outside of Michigan, Washtenaw County lost 284 residents to Cook County, Illinois (net gain of 58). Washtenaw also lost 142 residents to Los Angeles County, California (a net loss of 12).

LivingstonCountInMigration

LivingOut

Livingston County lost 4,452 residents, according to 2012-13 IRS data, while gaining 3,367, for a net loss of 1,085 residents. Among the new Livingston County residents, 1,027 were from Oakland County, 536 from Washtenaw County, and 469 from Wayne County. In total, 3,285 Michigan residents moved to Livingston County during the 2012-13 time frame. Cook County, Illinois contributed the highest number of new residents to Livingston County, at 44 from an out-of-state county.

While Livingston County gained the largest number of residents from Oakland County, it also lost the most residents to the same county: it lost 1,292 residents, for a net loss of 265 residents to Oakland County. Livingston County lost 903 of its residents to Wayne County (a net loss of 434) and 649 of its residents to Washtenaw County. In total, 4,157 former Livingston County residents moved elsewhere in the state, for an in-state net loss of 872. Outside of Michigan, Cook County, Illinois gained former Livingston County residents at 37, for a net loss of 7.

MonroeCountyInMigration

MonroeOut

Monroe County had a net gain of 143 residents, according to 2012-13 IRS tax returns. This rural county lost 2,350 residents to other counties while gaining 2,493 new residents. Monroe County’s largest population gain came from Wayne County at 852 residents; its second largest gain was from Lucas County, Ohio (Lucas County, which borders Monroe County, is home to Toledo) at 738. Wayne County and Lucas County were also the two counties that gained the most former Monroe County residents. Monroe lost 879 residents to Wayne County (net loss of 27) and 694 residents to Lucas County (a net gain of 141).

In total, Monroe County gained 1,564 residents from other Michigan counties and lost 1,485 residents to other Michigan counties for a net gain of 79 residents.

StClairCountyInMigration

StCOut

St. Clair County lost 2,232 residents and gained 2,192 residents, according to 2012-13 tax returns. The highest population gain for the county came from Macomb County with 1,001 residents, followed by Oakland County at 249. There were 141 former Wayne County residents who moved to St. Clair County. Pasco County, Florida (Tampa Bay area) contributed the largest number of new out-of-state residents to St. Clair County (28).


More former St. Clair County residents moved to Macomb County than anywhere else (1,194), resulting in a net loss of 193 residents to Macomb County. Oakland County gained the second highest number of St. Clair County residents at 210 (net gain) of 39. In total, 2,034 residents moved to St. Clair County from other Michigan counties and while 2,124 moved out, for a net loss of 90 residents. Maricopa County (Phoenix area), Arizona was the out-of-state county that gained the highest number of former St. Clair County residents at 25.

Overall, across Southeastern Michigan, there was a net gain of 5,770 residents. However, majority of the migration in and out of each county in the seven county region occurred between neighboring counties.


IRS Tax returns show Wayne County nets population gain

At first glance of filed 2012-13 IRS tax returns, it appears that, combined, Wayne, Oakland and Macomb counties gained about 5,500 residents. However, a deeper look into this information shows that majority of those leaving one county for another are actually just moving over the county line. Of the three counties, Wayne County was the only one to experience a net gain, while Oakland County was nearly equal in the number of residents leaving and moving in and Macomb County experienced a net loss.

The information provided in this post is from 2012-13 filed IRS tax returns.

Wayne County In Migration

Wayne County Out Migration

According to the 2012-13 tax returns, Wayne County lost 26,264 residents and gained 34,320, for a total net gain of 8,056. Former Oakland County residents were responsible for majority of the gain at 10,402, followed by Macomb County residents at 6,625 and Washtenaw County at 2,225. From out of state, Illinois’ Cook County (where Chicago is located) contributed the most number of new residents to Wayne County at 449.

While Wayne County gained the most number of Oakland County residents, it also lost majority of its residents to Oakland County as well. Wayne County lost 8,074 to Oakland County. Macomb County gained the second largest number of former Wayne County residents at 4,407. Outside of Michigan Cook County, Illinois gained the largest number of Wayne County residents at 355. Other counties across the country that gained more than 100 Wayne County residents were Clark County, Nevada (Las Vegas area, 126 people), Los Angeles County, California (172), San Diego County, California (138), Broward County, Florida (Ft. Lauderdale/Miami metropolitan area, 113) and Maricopa, Arizona (Phoenix area, 211 former Wayne County residents).

Oakland County in migration

Oakland County out migration

Oakland County lost nearly as many residents as it gained in 2012, according to the 2012-13 tax returns. According to the data, there were 29,124 tax returns filed by new Oakland County residents and 30,001 filed by former Oakland County residents. Of those that left, Wayne County received the most at 10,402, followed by Macomb County at 5,499. In terms of out-of-state migration, Cook County again received the highest number of residents at 600. Additionally, Los Angeles County, California (251) and Maricopa County, Arizona (214) also received a high number of residents from Southeastern Michigan. While Oakland and Wayne County residents had similar migration patterns when they left Michigan, we do see that there was a greater presence of Oakland County residents in northern California and Oregon.

Of the 29,124 residents gained in Oakland County, former Wayne County residents contributed to about a third of that number (8,074) and Macomb County residents contributed and additional 5,688 residents. From out of state, there were 592 former Cook County, Illinois residents who moved to Oakland County.

Macomb County in migration

MacOut

According to 2012-13 filed tax returns Macomb County had a net loss of 1,452 residents, with 15,925 new tax returns being filed for the county and 17,377 being filed by former residents. Wayne County received the highest number of former Macomb County residents at 6,625, followed by Oakland County at 5,668. Cook County, Illinois and Maricopa, Arizona were the only two counties outside of Michigan to receive more than 100 former Macomb County residents (140 and 129, respectively).

Macomb County gained more Oakland County residents than Wayne County residents, according to 2012-13 filed tax returns. During this time period 5,499 former Oakland County residents relocated to Macomb County and 4,409 former Wayne County residents relocated there. From outside of Michigan, Maricopa County, Arizona contributed the most number of residents at 160, followed by 145 Cook County, Illinois. Macomb County experienced a net gain of residents from both Maricopa County, Arizona and Cook County, Illinois.

While majority of the migration within the tri-county region took place between neighboring counties, the 2012-13 tax returns do show that Michiganders were leaving the state, particularly to places like Arizona, Florida, California and Illinois. However, the information also shows that there was out-of-state migration in the tri-county region at that time too, and in some cases it meant there was a net gain.

Next week, we will examine migration patterns for the remaining counties that make up Southeastern Michigan.