High rental burden evident through Southeastern Michigan

In Southeastern Michigan, there were 11 communities with a median rental cost above $1,200 per unit, yet none of these municipalities had more than 46 percent of their tenants paying more than 35 percent of their income on gross rent. Regionally, the median household income ranges between about $75,000 and $100,000 at the municipal level. According to the U.S. Department of Housing and Urban Development, no more than a third of a household’s income should go toward rent. To highlight how a community’s median income compares to the percentage of rent of that income a household pays we have made three different maps:

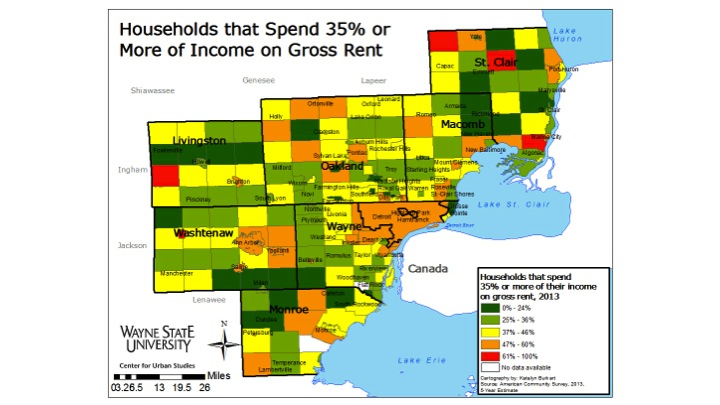
  • Households that spend 35 percent or more of income on rent
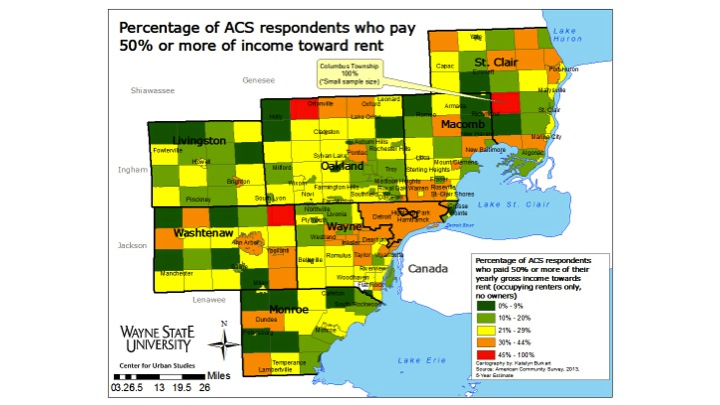
  • Households that spend 50 percent or more of income on rent
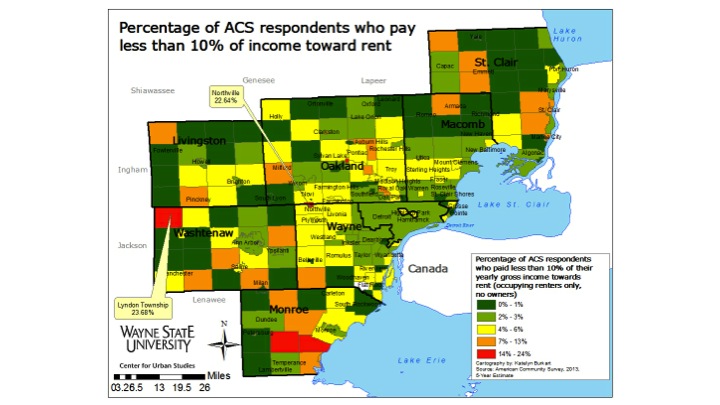
  • Households that spend 10 percent or less of income on rent


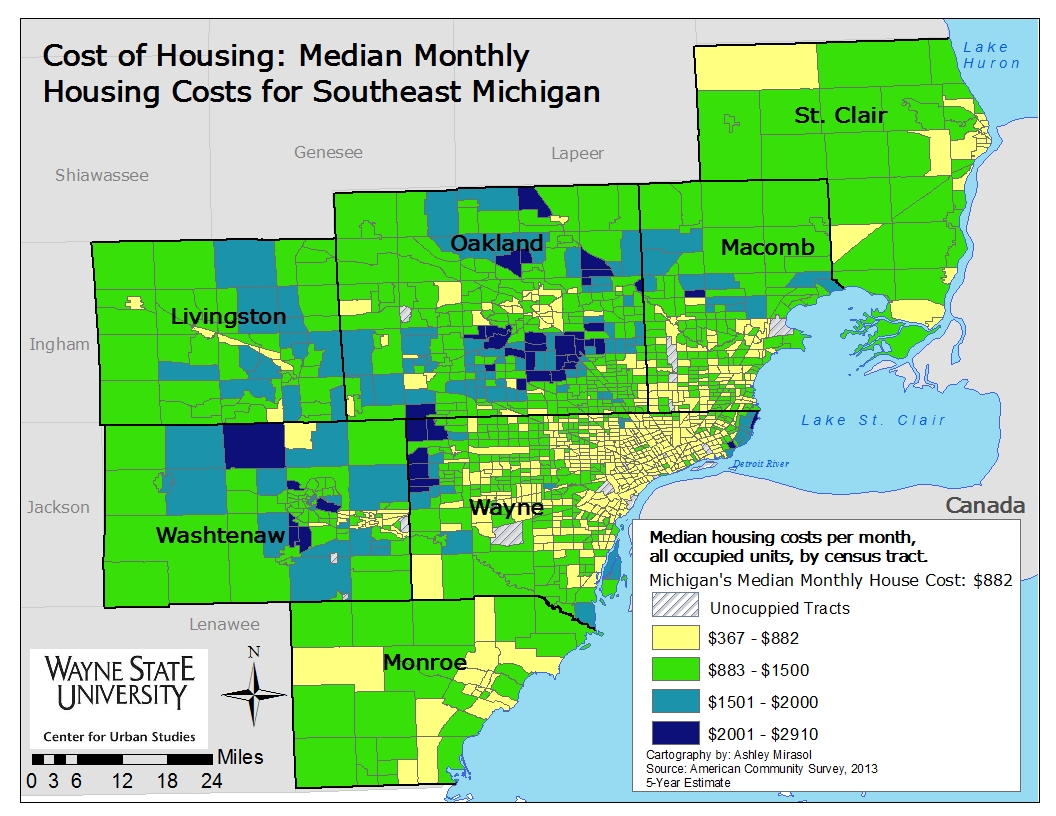
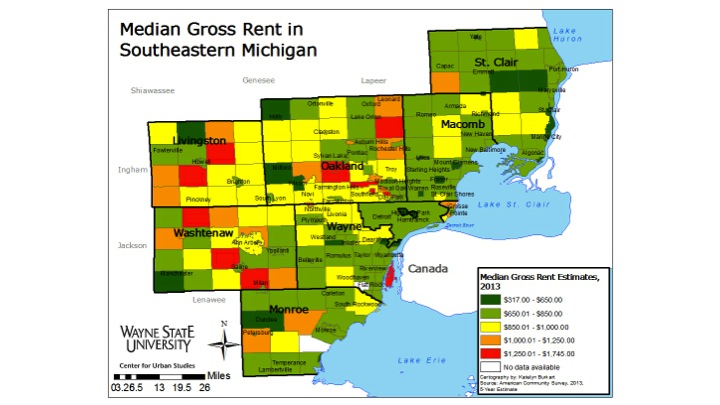
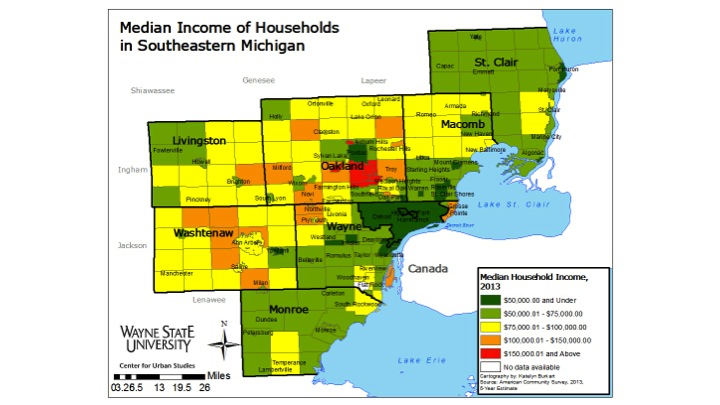
First though, two basic maps showing median gross rent at the municipal level and median income at the municipal level are below. Gross rent is defined by the U.S. Census Bureau as the “amount of the contract rent plus the estimated average monthly cost of utilities (electricity, gas, and water and sewer) and fuels (oil, coal, kerosene, wood, etc.) if these are paid for by the renter.”

Overall, Lodi Township in Washtenaw County had the highest median gross rent in Southeastern Michigan at $1,571. Two other Washtenaw County townships, Dexter and York, also had median rental costs above $1,200. At the county level, though, it was Livingston County with the highest median rental costs at $917. Howell and Genoa townships in Livingston County had median rental costs of $1,202. Only one community in Wayne County, Grosse Ile Township, had a median rental cost above $1,200 ($1,201). Wayne County had the lowest overall median rental cost at $777.

When looking at the median-income map we see the same communities, with the exception of those in Livingston County, with the highest median rental costs also have some of the highest median incomes. For example, the median income in Lodi Township is about $107,000 a month. A third of that would be about $36,000 a year spent in rent, or close to $3,000 a month. While Lodi Township did have the highest median rental cost in the region at $1,571, that is nearly half of what that one-third threshold would be. In the city of Detroit though, the median household income is $26,325 annually, or about $2,200 a month. With a median gross rent cost of $761, that is almost exactly a third of the average renters’ income. The difference between the highest median income and lowest median income in the region is 100 percent while the difference between the highest median gross rent and lowest median gross rent is 138 percent. This shows us that average rent prices are not in proportion to average incomes.

Slide03

Slide04

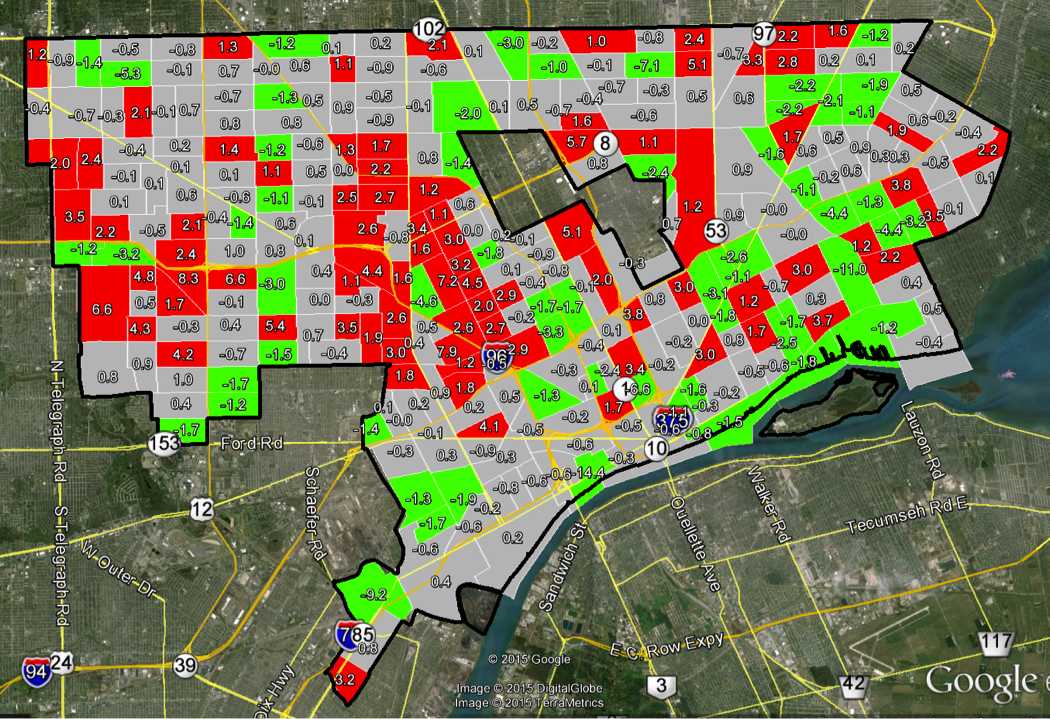
In Southeastern Michigan there are 22 communities, or about 10 percent of the region, in which 24 percent or fewer of renters pay less than 35 percent of their income to gross rent. We see that majority of the region’s renters set aside between 25 percent and 46 percent of their income for gross rent costs. There were only five communities in the region where 61 percent or more of the renters spent 35 percent or more of their income on rent. When increasing that threshold to 50 percent, there were only three (Groveland Township, Salem Township and Columbus Township) communities in the region where 45 percent or more of renters spent more than half of their income on rent. When an individual or a family spends for than 30 percent of their gross income on rent this is called rent burden and according to the National Center for Children in Poverty about 80 percent of low income households with children experience it.

Excluding Columbus Township because of the small sample size, the median income for both Groveland and Salem townships range between $75,000 and $100,000 while the median rent ranges between $650 and $1,000.

Slide06

Slide07

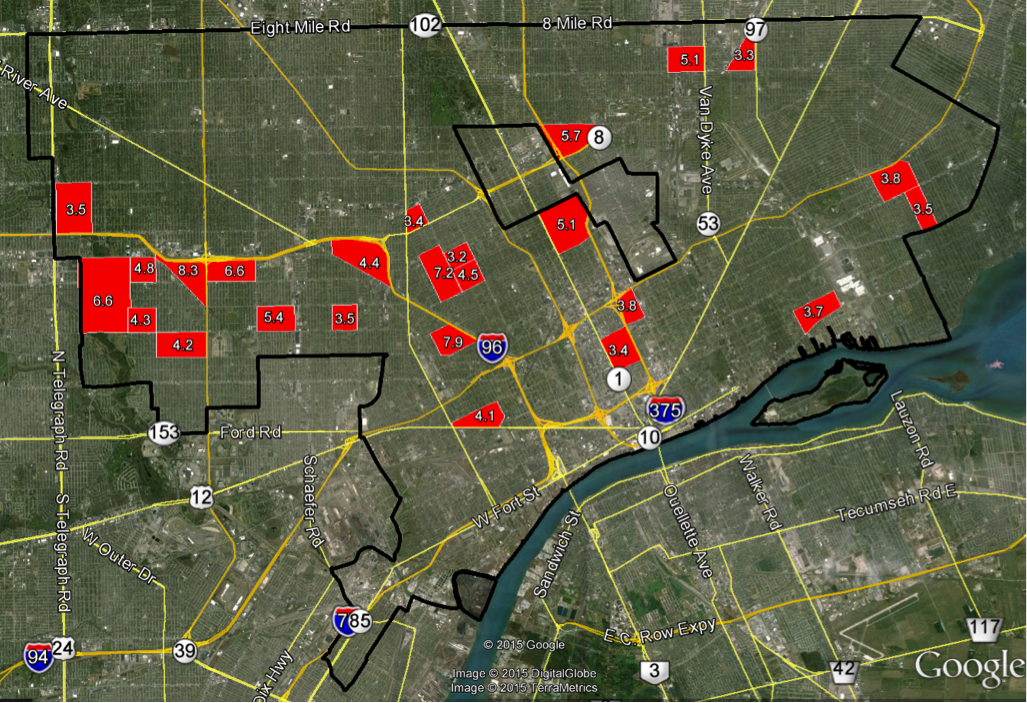
Only four communities in Southeastern Michigan had 14 percent of more of renters paying less than 10 percent of their income toward rent in 2013, according to the American Community Survey. Lyndon Township in Livingston County had the highest percentage at 23 percent and Northville, which is on the border of Wayne and Oakland counties, had 22.64 percent. The other two communities were located in Monroe Township.

Slide09


According to the National Center for Children in Poverty urban areas typically experience higher rates of rental burden. However, in Southeastern Michigan we see that there were also several rural communities, such as Groveland Township, where tenants also experienced rental burden.


Lowest median housing costs concentrated in Detroit, surrounding communities

In Michigan, the median monthly housing cost in 2013 was $882, but in the Southeastern Michigan region that cost ranged from about $3,000 a month in areas of Oakland County to about $360 a month in areas of Wayne County.

In the map below we see that Detroit, some of the inner-ring suburbs, and areas along major highways (I-94, I-96) had the highest concentration of median monthly housing costs below that of the state’s in 2013. On the opposite end of the spectrum, the areas with the highest median monthly housing costs were primarily located throughout Oakland County (Bloomfield, Birmingham, etc.) and Washtenaw County (Ann Arbor, Dexter, Lyndon Township).

According to the 2013 American Community Survey, which provided the data for this post, the median monthly housing costs were calculated by dividing “the monthly housing costs distribution into two equal parts: one-half of the cases falling below the median monthly housing costs and one-half above the median. Medians are shown separately for units ‘with a mortgage’ and for units ‘not mortgaged.’ Median monthly housing costs [were] computed on the basis of a standard distribution.”

SE Michigan

In taking a closer look at the tri-county region, we see that 679 census tracts had a median monthly housing cost below $882 in 2013. And, while this trend spanned out into the southern portion of Macomb County (Warren-Eastpointe areas) and southwest of Detroit, there were only about a handful of census tracts in the portion of Oakland County that borders Wayne County where the median monthly housing cost was $882 or less. These areas in southern Oakland County are located in the Hazel Park-Ferndale-Oak Park area.

housingcostTRICOUNTY

Detroit had the largest number of census tracts where the median housing cost per month was at or below the state average of $882 in 2013. There was one census tract in Detroit (Palmer Woods area) where the monthly median housing was nearly double the state average (this tract includes Palmer Woods).

As seen below, median housing costs of $882 and below also spanned into the central portion of Wayne County, in areas such as Inkster, Dearborn and Romulus. With the exception of Sumpter Township, the most western portions of Wayne County had median monthly housing costs of $883 and more. Areas such as Northville and Canton had amongst the highest median housing costs in the county, ranging between $2,001 and $2,709. The only other area in the county with such high median housing costs were the Grosse Pointes.

This week, we took a look at overall median housing costs in region. In the following weeks, we will begin to explore what percentage of an individual’s income goes toward their rent or mortgage.

housingcostWAYNE

Refocusing Housing Policy in Detroit: Moving to Healthy Housing

The majority of families in Detroit face the risk of death, injury, illness and loss of their children’s mental capacity every day because of hazards in their homes. Based upon highly detailed analyses of homes, it is clear that homes are causing burns, falls, asthma, allergies and lead poisoning.

A detailed survey of Detroit homes, conducted by the Center for Urban Studies at Wayne State University, found that over 62 percent of nearly 500 randomly selected homes have at least one high risk hazard that is likely to lead to poor health outcomes. [1] Of these, 4.2 percent of the homes have three or more hazards in these high risk categories. These dangerous housing conditions, combined with high unemployment and continued crime, are driving people to leave the city in droves.

Recent estimates show Detroit is continuing to lose residents at fast clip, about 1,155 residents[2] a month.

The City is working hard on unemployment (and the improvement of the economy as a whole is helping) and on increased and smarter policing. But on housing for existing residents, far more needs to be done, not just by the City, but by the State and the Federal Government.

To stop this decline and avoid the health consequences of dangerous homes, Detroit and policy makers need to focus far more efforts on providing safe and healthy homes.

As of July 2014, Detroit had a total of 252,173 occupied housing units.[3] However, our best estimates—very generous–are that only around 500 a year are being substantially improved to make them healthy and safe places to live, while just over 800 new housing units were built last year.[4] This is an estimated total of 1,300 homes being produced per year. At this pace, it will be many decades before vast majority of Detroit’s residents can live in safe and healthy homes.

What is a reasonable goal for creating healthy homes for Detroit’s children? A modest goal would be to house all of Detroit’s 193,150 children[5] in safe housing within 10 years. Approximately 3 percent of households (or around 6,000 children) already reside in housing built later than 1980[6] and, in most cases, this is relatively safe housing.[7] A total of about 79,400 households with children live in pre-1980 housing, and we estimate 38 percent are in houses that have only minor hazards[8]. That means 49,259 households are living in homes where one or more major hazard puts them at risk every day. Having nearly 50,000 households plagued with one or more hazards is unacceptable, which is why the families residing in these homes need either new or rehabilitated housing, and they need it soon.

Within 10 years—a short time in the policy world—policy makers should be able to address these needs. To avoid deaths, injuries, illness and loss of mental capacity caused by home environments, Detroit needs at least 4,900 new or rehabilitated homes a year. That is 3.8 times the number we estimate that is being produced now. And this is only the number necessary to protect families with children, not other vulnerable populations such as the elderly.

We need to massively expand renovation and construction, specifically, in these ways:

  • First, concentrate on housing with children, the most vulnerable among us, for rehabilitation;
  • Let’s give families with children a priority to relocate to subsidized housing that has been built after 1980 or that has been re-built and remediated, including lead abatement.
  • Make homes healthy through small investments. Some homes can be made healthy for an investment of substantially less than $5,000. The Green & Healthy Homes Initiative Detroit-Wayne County has shown this can be done. We need to do more of this.
  • Work to improve and remove hazards from current houses, rather than new construction. In cases where the abatement of lead hazards is necessary, the work can cost an average of $20,000,[9] still a fraction of the cost of a new construction.
  • Use code enforcement to force rental owners to substantially improve homes. Progress is being made here, but the number of code inspectors, cut sharply in the midst of Detroit’s fiscal difficulties, needs to be expanded substantially.
  • Ensure all new construction in Detroit includes affordable units.
  • Increasingly the private sector is rehabilitating homes in Detroit. These rehabilitations should pass all standards, especially including the removal of asbestos and lead-based paint. Currently, private sector rehabilitations do not have to pass all standards among governmental and lending organizations that control the sale and rehabilitation of many of these homes.
  • Leverage local and state resources, ranging from public entities to non-profit and for-profit organizations, to develop a robust rehabilitation program. Mayor Duggan has made a good start here with his zero interest loan program, but many families cannot meet the income and other requirements required by this program. We need grant programs to assist these low income homeowners.
  • Many thousands of families are living in homes that have black mold and other major damage from the August, 2014 floods across Detroit and other communities in Southeast Michigan. FEMA and other agencies need to invest in these homes to protect people from major health problems.

Healthy Homes Risk Assessments 

These maps below are based on a random sample of 500 homes spread broadly across Detroit. At each house assessors completed a Healthy Homes Rating System assessment that examined 29 potential hazards. This rating system is a HUD-endorsed rating instrument that assesses both the probability of injury and extent of injury from a hazard.  Three of the most frequently occurring and severe hazards were excess cold, mold and dampness and lead paint. The following three maps portray of the areas of Detroit that had the highest levels of hazards.

Lead

HHRSMold Cold


[1] This data is collected using the Healthy Homes Rating System (http://portal.hud.gov/hudportal/HUD?src=/program_offices/healthy_homes/hhrs). According to this system, a “high-risk” hazard is identified by a rating of A, B or C on a scale of A-J, A being highest likelihood of serious injury or death and J being minimal risk.

[2] This calculation is based on the April 1, 2010 estimate based on the Census and a 2014 estimate from SEMCOG, broken down into a monthly estimate by simple division across the months.

[3] SEMCOG Community Profile, City of Detroit (http://www.semcog.org/Data/Apps/comprof/people.cfm?cpid=5)

[4] At best only several hundred houses a year are being improved to systematically reduce health hazards. It is important to note, however, that about 806 new housing units were constructed in Detroit last year.

[5]U.S. Census Bureau, Demographic and Housing Estimates, 2013 American Community Survey 1-Year Estimates, Detroit city, Michigan (http://factfinder2.census.gov/faces/tableservices/jsf/pages/productview.xhtml?pid=ACS_11_5YR_DP04)

[6] U.S. Census Bureau, Households and Families, 2013 American Community Survey 1-Year Estimates, Detroit city, Michigan (http://factfinder.census.gov/faces/tableservices/jsf/pages/productview.xhtml?pid=ACS_13_1YR_S1101&prodType=table), U.S. Census Bureau, Households and Families, 2013 American Community Survey 1-Year Estimates, Detroit city, Michigan (http://factfinder.census.gov/faces/tableservices/jsf/pages/productview.xhtml?pid=ACS_13_1YR_DP04&prodType=table) This is probably an underestimate as we were unable to obtain of precise occupancy data for post-1980 housing.

[7] It is also important to know that lead paint was banned for use in residences in 1978 and taken off the shelves in 1980.

[8] This estimate is based on the results from the Healthy Homes Rating System being conducted in Detroit.

[9] This cost may include the replacement of all windows within the home as this is a major source of lead.

Region’s oldest homes primarily concentrated in Detroit

Vacancy data shows that the region’s oldest homes face higher rates of abandonment. And Detroit has the biggest challenge in this regard. However, data in this post shows that many suburban and rural communities also have an aging housing infrastructure. These homes will require increasing amounts of investment to remain safe and habitable. The maps below show that a number of communities had an average housing stock of greater than 50 years old. For instance, the city of Detroit’s average year that a house was built was 1939. In the maps below we see that majority of the region’s housing stock was built between 1972 and 1991, but that Wayne County and the Woodward Corridor has older housing on average than other areas.

SEMCOG Housing Age


Slide04

housingDETROITmediantr (1)

Throughout the seven-county region, with the exception of the city of Detroit, we see that the median age of the housing stock is between 24 and 43 years (meaning they were built between 1972 and 1991). This fact corresponds with the beginning of population loss in Detroit (1960s), when residents began to move in large numbers to the suburbs. Other regional communities, such as Royal Oak, Pontiac and Livonia, neared their population peaks in the 1970s (view our previous post on the growth and decline of the region’s population here).

In addition, the maps shows us that Detroit’s median housing age is between 64 and 76 (meaning they were built between 1939 and 1951). It was during 1950 when Detroit’s population peaked at 1.8 million, so it is logical to think that a large portion of its housing stock was built leading up to that population peak.

Other areas where the median age of housing ranges between 64 and 76 years of age include Port Huron, Pontiac, Hamtramck and Highland Park. Hamtramck and Highland Park experienced population growth through the 1930s, largely as a result of the Dodge Main Plant and Highland Park Plant automotive facilities being built in those respective cities. Pontiac was also home to an automotive plant and experienced population growth during the same time as Detroit. Pontiac is also the county seat for Oakland County.

(For more information regarding the population growth of the municipalities mentioned above and the reasoning behind such growth click here).

HousingyearTRICOUNTY1939 (2)

housingyrDETROIT1939

The city of Detroit had the largest total number of of homes built before 1939, with nearly 120,000 still standing, representing 32.8 percent of the city’s housing current housing stock. However, the majority of the region had 30 percent or less of its housing stock built prior to 1939 at the city level. Older communities such as Hamtramck, Highland Park, Romeo, Ferndale, Pontiac and Plymouth had significant older housing stocks when compared to other suburbs.

Another area where more than 50 percent of the housing stock was built prior to 1939 was Mount Clemens, one of the region’s oldest cities (it was established in 1818 and became a city in 1879). Mount Clemens is the county seat for Macomb County and was popular vacation spot for many throughout the late 1800s and early 1900s because of its mineral baths.

Slide10

Metro-Detroit Housing afte 2000

Detroit Housing after 2000

Throughout the seven-county region, we see only a small percentage Census tracts with more than 10% of homes built after 2000. The Canton area in western Wayne County had the highest percentage of newer homes as of 2013, with more than 70 percent of the area having housing stock built after 2000. In Detroit, there are census tracts near Belle Isle, Corktown and on the West Side that are more than 20 percent homes built after 2000.

Other areas in the region where more than 50 percent of the housing stock was built after 2000 are Macomb Township (which has been named one of Macomb County’s fastest growing community), Shelby Township, Holly, Howell, Monroe and communities surrounding Ann Arbor.

Overall, while there are some newly developed areas in the region, the majority of Southeastern Michigan’s housing stock was standing long before 2000. In addition, the newly developed areas tend to be outside suburbs.

Detroit’s vacancies decline, according to US Postal Service

The most recent (June 2015) quarterly statistics from the U.S. Postal Service showed a decline in the number of vacant addresses in the city of Detroit. The total number of vacant addresses decreased by 1,936 from 92,464 to 90,528 for the period March 2015 to June 2015. The total number of residential addresses increased by 831 from 361,171 to 362,002. The total vacancy rate declined from from 22.8% percent to 22.3 percent.

However, the number of addresses classified as “no-stat” increased sharply by 1,563. Mail carriers denote properties as being either “vacant” or “no-stat.” Carriers on urban routes mark a property as vacant once no resident has collected mail for 90 days. Addresses are classified as “no-stat” for a variety of reasons. Addresses in rural areas that appear to be vacant for 90 days are labeled no-stat. So are addresses for properties that are still under construction, and urban addresses that the carrier decides are unlikely to be occupied again any time soon — meaning that both areas of high growth and severe decline may be labeled no-stat.

Source: United State Postal Service via HUD, March 2015.

June 2015 Address Vacancy Rates by Census Tract

(percentage of all addresses that are vacant)

Change in Address Vacancy Rates: June 2015 versus June 2014

(percentage point change)

Red = Increase in address vacancy rate

Green = Decline in address vacancy rate (improvement)

Top 25 Best Performing Neighborhoods for June 2015 versus June 2014

The map below illustrates the Detroit neighborhoods showing the largest percentage point reductions in their address vacancy rate. A reduction in the vacancy rate may result from an increase in occupancy or by way of demolition activity (which also reduces the number of vacant addresses). Concentrated demolition activity in the McNichols/Gratiot area has reduced the address vacancy rate but these areas still rank among the highest in the city at nearly 40 percent vacant.

For a map of demolitions, see the City’s Demolition Data Lens page at https://data.detroitmi.gov/view/vcn9-abmp

Top 25 Worst Performing Neighborhoods for June 2015 versus June 2014

The highlighted neighborhoods showed the largest increases in their vacancy rates between June 2014 and June 2015. Sixteen of the top 25 census tracts which showed increases in address vacancy are located on the west side of the city. Two eastside neighborhoods near Van Dyke and Outer Drive also showed sharp increases in address vacancy.


Michigan’s CPL application process being modified

Each county in Michigan has a gun board which uses its discretion to determine if Concealed Pistol License (CPL) applicants meet the qualifications to obtain or renew their license. Each gun board has a representative from the County Prosecutor’s Office, the County Sheriff’s Department, and the Michigan State Police (MSP). Until December 1, 2015 it is at the discretion of each county gun board to determine if an applicant is fit to obtain or renew a CPL. While each gun board has the authority to request applicants to appear before it, Macomb County is the only county in the state to require all new applicants to appear before its gun board.

On December 1, 2015, however, this present system will change.

Under legislation signed by Gov. Rick Snyder in March (Public Act 3 of 2015), county gun boards in the state of Michigan will cease to exist after November 30, 2015. Instead, local control will shift to the state. The County Clerk’s Office will still process and distribute licenses, but the MSP will determine whether or not an applicant is fit to hold a CPL. According to the new law, the MSP will verify the requirements an individual must meet in order to obtain a CPL by using the law enforcement information network and the national instant criminal background check system. Should the MSP find that an individual is not qualified to have a CPL, that information will be relayed to the County Clerk’s Office.

According to Gov. Rick Snyder, these changes will allow for a more unified process that will “better support the rights of firearm owners.” Opponents, however, have criticized the change because of the loss of local control over the process. To read more on this issue, click here.

While any person is able to apply for a CPL the state has the right to deny such requests for a variety of reasons. This process, which will be slightly modified beginning Dec. 1, 2015, is intended to protect the public and prevent potential misuse of a firearm.

The map below shows the percent of CPL applications denied by each county in the Southeastern Michigan region in 2013. As shown, Wayne County had the highest denial rate at 4.5 percent while St. Clair County had the lowest denial rate at .8 percent.

To obtain a CPL in the state of Michigan there is a list of requirements that must first be met. These requirements, according to the state of Michigan, include:

  • Being at least 21 years of age;
  • Michigan residency for at least 6 months prior to application;
  • Successful completion of a pistol safety training course;
  • No felony convictions;
  • No convictions of specific misdemeanors (including domestic violence);
  • No personal protection orders filed against the applicant;
  • No diagnosed mental illnesses at the time of the application

For a complete list of requirements, visit this site.

CPL Licenses Denied

As seen above, in 2013, Wayne County had the highest CPL denial rate in the region at 4.5 percent while St. Clair County had the lowest denial rate at .8 percent. While there is no specific reason given for Wayne County’s rate of CPL denials, we do know that in 2012 Wayne County had the highest probation, incarceration, and prison rates in the seven-county region. A person will be denied a CPL if they have a felony or certain misdemeanors.


General Law Townships predominant government structure in Southeastern Michigan

In this post we examine the types of government structures that exist in Southeastern Michigan. Throughout Michigan there are five types of municipalities including: Mayor-Council and Manager-Council (both of which are for cities), Charter Township and General Law Township, and villages. In addition to showing what type of government structures exist in Southeastern Michigan in a map below, we also detail how those different structures work and offer some reasons a community chooses one structure rather than another.

Wayne County has the largest number of municipalities with a Mayor-Council form of government, while the more rural communities on the outskirts of the region are predominantly General Law Townships. In total, there are 22 municipalities with a Mayor-Council form of government, in this form the mayor serves as the chief administrator for the city), 10 of which are located in Wayne County. It is General Law Townships though that are the most common form of government in the region, with 72 communities being organized as one of Michigan’s earliest form of governments.

Charter Townships make up 19 percent (41) of government structures in Southeastern Michigan while Council-Manager forms of government makeup 29 percent (65) of the types of government structure that exists in the region. There are 20 villages in the region.

While Wayne County has more communities that operate with a Council-Manager form of government, and the largest number of cities, General Law Townships predominate along the outer edges of the region.

The Differences

As noted, General Law Townships are the most common form of government structure in Southeastern Michigan; all townships are General Law Townships unless incorporated in a Charter Township. General Law Townships were given the option to receive a Charter Township status beginning in 1947 when the State Legislature approved the Charter Township Act. This classification, according to the Michigan Township Association, allows for a more streamlined administration.

According to the Michigan Township Association, townships (both general law and charter) can only exercise powers given to them by state law. All townships are required to collect taxes, administer their local elections and perform property assessments. They also have the option to enact and enforce ordinances, offer local fire and police protection services, and operate parks and recreation programs, among other things, according to the Michigan Township Association. Additionally, all townships are governed by a Supervisor, Clerk, Treasurer and two or four trustees.

In terms of levying millages, General Law Townships are allocated at least 1 mill from the 15/18 mills that counties, townships, public schools and intermediate school districts receive, according to the Macomb Township website. Charter Townships though do not receive this same millage allocation. Rather, if they were chartered by a referendum, they can levy up to 5 mills. But if a township was chartered by a board resolution after 1978, then the voters must vote on whether or not a proposed 5 mills can be levied. Under either circumstance, townships can also levy up to 10 mills, but this must be approved by the voters, according to the Macomb Township website.

Townships are part of Michigan’s early history and began to be created in 1790 throughout the Midwest region as a way to help govern land throughout what is now the Midwest region, according to the National Township Association. In the Midwest, according to the National Township Association, townships are typically more rural, as we saw with majority of the General Law Townships being located on the outskirts of the seven-county. Also, according to the Michigan Township Association, a Charter Township status can help prevent a township from being annexed by a neighboring city. Several weeks ago we took a look at how the city of Detroit became the size it is today through annexation. When looking at the map in this post we see that the only township touching the Detroit border is Redford Township and that is a Charter Township. Additionally, we see that throughout Macomb, Oakland and Wayne counties, where the majority of the region’s cities are located, the majority of the cities border Charter Townships, as opposed to General Law Townships.

Cities

Unlike townships, cities must not only perform the same state mandated functions as townships, but they must also provide their own services, such as snow plowing, police and fire services (these services can be contracted out or shared between municipalities). According to the Michigan Municipal League, cities are given a greater amount of independence in how they regulate, in large part because of the Home Rule City Act; this allows cities to enact a charter which provides the framework for how that particular city functions.

The City of Detroit is the most recognizable example of the Strong Mayor type of city government in the region. A Strong Mayor type of government is one in which the mayor acts as the city’s top administrator, serves on a full-time basis, and has the authority to appoint and remove top officials. He or she also typically has some sort of veto power, but the council is the acting legislative body, according to the Michigan Municipal League.

In the Council-Manager form of government the council appoints a chief administrative officer, often known as the City Manager. This person is professionally trained on the day-to-day operations of a city and is often looked to for recommendations by the council regarding policy making.

Villages

In addition to townships and cities, there are also villages in the state of Michigan. Villages, which are the least common structure of government in Southeastern Michigan, also come in two forms: General Law and Home Rule. General Law villages, which are the most common, have a village president, which is an elected position, but it is the department heads who typically oversee the day-to-day administrative functions of the municipality. With a Home Rule Village, the president does not need to be elected by the citizens but can be appointed by the council; this person is often referred to as the village manager, according to the Michigan Municipal League.

Metro-Detroit’s home prices increasing

  • From May 2015 to June 2015, the unemployment rate across the state and in the city of Detroit’s decreased (monthly);
  • The Purchasing Manager’s Index for Southeast Michigan increased from May 2015 to June 2015 (monthly);
  • Commodity Price Index increased from May 2015 to June 2015 for Southeast Michigan (monthly);
  • Standard and Poor’s Case-Shiller Home Price Index for the Detroit Metropolitan Statistical Area shows home prices are about $3,000 higher than this time last year.

According to the most recent data provided by the Michigan Department of Technology, Management, and Budget, the unemployment rate for the state of Michigan decreased from 5.9 percent in May to 5.8 percent in June. During this same period, unemployment in the city of Detroit also marginally increased from 13 in May percent to 13.1 percent in June. However, it is 3.3 percentage points lower than where it was in June of 2014.

From May to June, the number of people employed in the city of Detroit increased by about 900, leading to a total of 212,107 people employed in June. Since March, the number of people employed in the city has increased by 2,690. In the last year, the month of March had the lowest number of people employed in the city of Detroit.

The above chart shows the number of people employed in the auto manufacturing industry in the Detroit Metropolitan Statistical Area (MSA) (Detroit-Warren-Livonia) from June 2014 to June 2015. From May to June the number of people employed in this industry increased by 1,600, to a total of 108,500. The June number is the highest employment number this industry has had in the last year.

The Purchasing Manger’s Index (PMI) is a composite index derived from five indicators of economic activity: new orders, production, employment, supplier deliveries, and inventories. A PMI above 50 indicates the economy is expanding.

According to the most recent data released on Southeast Michigan’s Purchasing Manager’s Index, the PMI for June 2015 was 66.1, an increase of 0.3 of a point from the prior month. It was also an increase of 19.0 from June of 2014.

The Commodity Price Index, which is a weighted average of selected commodity prices, was recorded at 60.7 points in June 2015, which was 4.4 points higher than the previous month and 4.2 points lower than June 2014.

The above charts show the Standard and Poor’s Case-Shiller Home Price Index for the Detroit Metropolitan Statistical Area. The index includes the price for homes that have sold but does not include the price of new home construction, condos, or homes that have been remodeled.

According to the index, the average price of single-family dwellings sold in Metro Detroit was $101,930 in May 2015. This was an increase of $3,040 since May of 2014 but a decrease of $1,082 from April of 2015.

Seven percent of Detroit’s Liquor License holders located less than a half mile from an elementary school

In 2012, there were about 1,130 establishments in the city of Detroit with liquor licenses, of which nearly 7 percent were located within 0.1 mile of an early learning center or elementary school. In viewing the maps below, we see that the highest concentration of liquor license holders was within the Central Business District, with a medium density of the license holders spanning out into the lower Woodward Avenue, Corktown, and Lower East Central areas.

In Michigan there are several types of liquor licenses which can be obtained. These include licenses needed to sell just beer, those need to sell beer and liquor at a golf course, a hotel, a bar and at a private event. Additionally, brewpubs, distilleries, wholesalers (both those in state and those out of state bringing goods in), winemakers, and stores selling beer and/or liquor need a license. All liquor licenses in the state of Michigan are issued by the Michigan Liquor Control Commission.

According to a study by the Pacific Institute, a high concentration of liquor stores holders can may be related to several public safety and health problems, ranging from high rates of alcohol related hospitalizations, to pedestrian injuries, to high levels of crime and violence. According to data from the Federal Bureau of Investigation we know that Detroit’s crime rate was 2,122.9 per 100,000 residents in 2012, while the state of Michigan’s was 454.4 per 100,000 residents.

The above density map shows where the liquor licenses in Detroit are located and how some areas have a higher concentration of such licenses. As already stated, the highest concentration was in the Central Business District, where there is a combination of bars, restaurants, and liquor stores.

In the map below, we see where liquor license holders were located, along with what the poverty rates. The majority of the liquor license holders ( 683 or 60 percent) were located in census tracts where the poverty rates ranged between 25.1 and 50 percent. Although the Central Business District had the highest concentration of liquor license holders, the poverty rate in these census tracts was 25 percent or lower. Throughout the entire city there were 205 liquor license holders in census tracts where the poverty level was 25 percent or less.

Of the 1,129 liquor license holders in the city of Detroit, 79, or 7 percent, were located within 0.1 mile of an elementary school or early learning center.

According to the Pacific Institute study, a high concentration of liquor stores (in this post we look at liquor license holders) can lead to several public safety concerns, particularly crime.

In addition to crime being mentioned in the Pacific Institute study, it also discussed how the location of schools near liquor stores can affect the overall health and well-being of the community and the children within those communities. Although there are likely many suggestions on how to better a communities wellbeing, some solutions for Detroit officials may include: enforcing zoning ordinances to restrict nuisance activity by liquor stores or establishments that hold a license, using economic development strategies to transition current liquor stores into places for residents to access healthy foods, and working with the state to re-determine how many liquor licenses the city of Detroit should actually hold and/or what policies should be in place preventing the location of liquor license holders within a certain proximity to schools.

Southeastern Michigan’s Charter Authorizers rank below state averages academically

In Southeastern Michigan there were 15 charter school authorizers during the 2013-14 that were included in the state’s Top-to-Bottom (TtB) list; only one of which was ranked among the best (above 80). The TtB list is an accountability system that ranks Michigan schools based on student performance in math, reading, writing, science, social studies and graduation rates (24 total charter school authorizers were included throughout the state). This list allows for schools to be compared on the same scale, regardless of size. The charts below presents each authorizer’s portfolio as a single entity, rather than by individual schools, by a methodology developed by the Michigan Department of Education’s Bureau of Assessment and Accountability. Like schools and districts throughout the state the charter school authorizers are ranked on a scale of 1-100, 100 being the highest ranking.

It was the Washtenaw Intermediate School District (ISD) that ranked at 85, being the only charter school authorizer to rank above 80 in the region. The only other charter school authorizer to even rank of above 50 in the region was Wayne Regional Education Service Agency (RESA), which ranked at 52.

The Educational Achievement Authority, which authorizes several schools is the city of Detroit (click here for locations) was ranked the lowest authorizer in the region and among the lowest in the state with a ranking of 1 (Kellogg Community College and Muskegon Heights School District also received a 1).Top-to-Bottom Rankings

The Overall Performance Index uses an achievement index, which is a weighted average of two years of achievement data, and achievement gap index, which is a weighted average of two years of top/bottom 30 percent of students’ achievement data, according to the 2014 Michigan’s Charter School Authorizer Reporter. The negative scores show that authorizers whose performance index fell below the state average.

The only two authorizers that performed above the state average in the region were the Washtenaw ISD and Wayne RESA. The Washtenaw ISD ranked the third highest for its performance index score (.91) among the 24 authorizers. On the other end the Education Achievement Authority (-1.74) and the Detroit City School District (-1.57) ranked among the lowest authorizers, both in the region and throughout the state. The Muskegon Heights School District (-1.83) and Kellogg Community College (1.75) had the lowest performance index scores in the state.

An achievement gap smaller than the state average is represented by a positive number and means that students in the top 30 percent of state standardized test scores perform at levels closer to the bottom 30 percent, according to Michigan’s Charter School Authorizer Report. It has also been described as the performance gap in a subject between the top 30 percent and bottom 30 percent of a student body. A positive number means that gap is smaller than the state average and a negative gap means that number is larger than the state average.

The achievement gap accounts for 25 percent of the TtB rankings and below we see that six of the authorizers with charter schools in the region have an achievement gap smaller than the state average. Authorizers with small achievement gaps, such as the Education Achievement Authority and Highland Park City Schools, are more likely to have a concentration of low or high proficiency rates, according to Michigan’s Charter School Authorizer Report.

In the five charts below we see the percentage of students deemed proficient on the 2013 Michigan Education Assessment Program for the five subject areas students are tested on (math, reading, writing, science and social studies). The authorizers represented above all had charter schools existing in the region during the 2013-14 academic year. The Washtenaw ISD was the only authorizer in the region with students outperforming the state in all subject areas. Wayne RESA was the only other authorizer in the region with students outperforming the state on the 2013 MEAP; this authorizer outperformed the state average in reading.

The Detroit Community School District had the highest percentage of economically disadvantaged students at 88 percent. Eighty-five percent of students in the Highland Park, Educational Achievement Authority and schools authorized by Saginaw Valley State were economically disadvantaged. Schools authorized by Northern Michigan University had the lowest percentage of economically disadvantaged students at 27 percent.

The Michigan Authorizer report references the correlation between poverty and the percentage of African American students to proficiency rates on state standardized tests. There were no authorizers with schools in the region where more than 10 percent of the student population was economically disadvantaged that ranked above 50 on the TtB list.

When reviewing the above information with our previous post we know that majority of charter schools in the 2013-14 academic year in the region were located in the City of Detroit and that the city also had the highest number of closed charter schools at 28. Additionally, we know Central Michigan University had the largest number of schools closed in the region. Although Central Michigan University didn’t rank lowest on the TbT list, it didn’t rank high. With a TbT ranking of 21 Central Michigan’s MEAP proficiency rates were all below the state average (9% below state average for math and reading; 5% below the writing average; 6% below the science average; 7% below the social studies average). Central Michigan University was 19 percent above the state average for economically disadvantaged students.

Of the authorizers with schools in the city only Wayne RESA had students outperformed the state standard, and that was in math. Still, when only looking at authorizers in the city of Detroit Wayne RESA had the largest number of shuttered charters at 8.

While standards for Michigan charter schools have gained more attention in recent years, the above information highlights that the charter school authorizers in the region fall below state standards when it comes to educational assessment. Former State Superintendent Mike Flanagan did say the state would suspend charter authorizers if they did not offer “high quality education options and cultivate better outcomes, especially for low income children.”

In June of 2014 it was announced that 11 charter authorizers were at risk of being suspended by the Michigan Department of Education. These authorizers were: Detroit Public Schools, Eastern Michigan University, the Education Achievement Authority, Ferris State University, Grand Valley State University, Highland Park Schools, Kellogg Community College, Lake Superior State University, Macomb Intermediate School District, Muskegon Heights Public Schools and Northern Michigan University. In 2015, 7 of those authorizers were removed from the list; those remaining are: Detroit Public Schools, the Education Achievement Authority, Highland Park Schools and Eastern Michigan University. What qualifications those authorizers had to meet to be removed from the list are unknown though, according to a Free Press article.