Michigan’s Unemployment Benefits Lowest in the Region

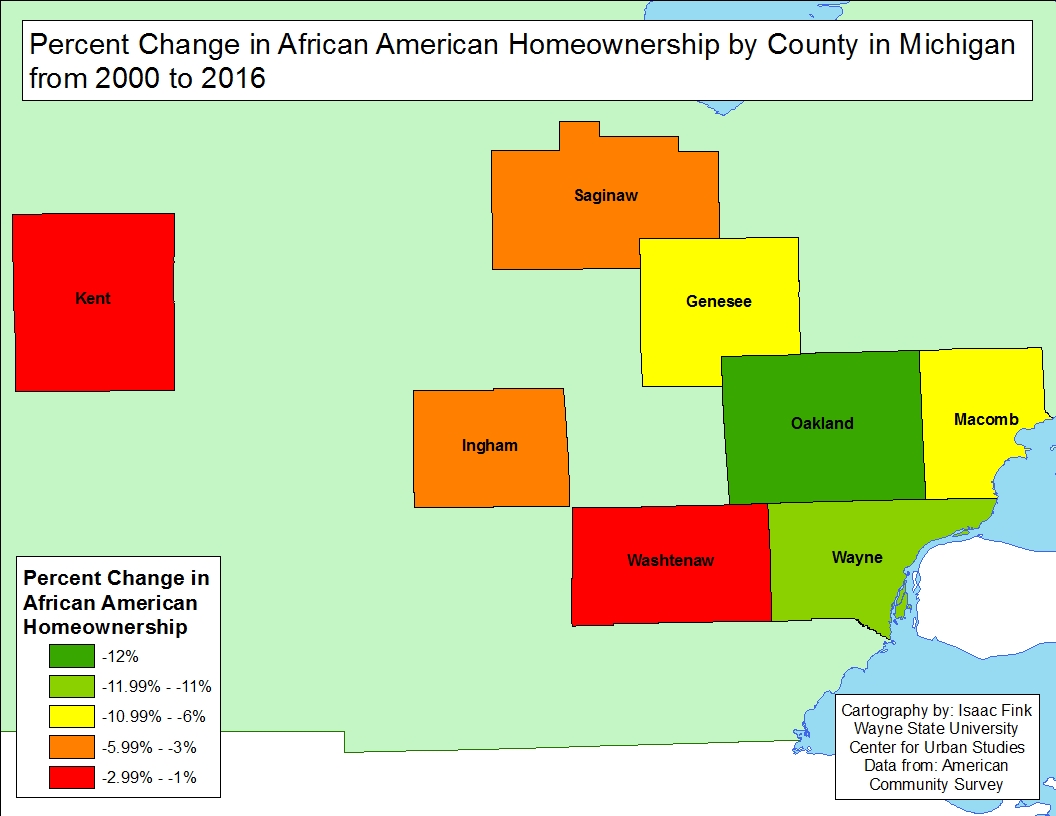
The national average for weekly unemployment benefits in the United States is $468; $362 per week is what is provided in Michigan. Michigan has the lowest unemployment benefits of any state in the Great Lakes region and ninth lowest in the nation. In addition to the unemployment amount being $362 a week, that amount is traditionally paid for 20 weeks (it has currently been extended to 26 weeks due to the COVID-19 pandemic). Even with extended and additional unemployment benefits, families in Michigan continue to financially struggle.

According to the most recent Kids Count report, 56 percent of adults living in a household with children have reported losing income as of Nov. 9, 2020 in Michigan. The same report states that only 4 percent of adults living in a household with children in Michigan are receiving their full pay and not using leave for time not working, while 92 percent who are off work are not receiving any pay for their time off.

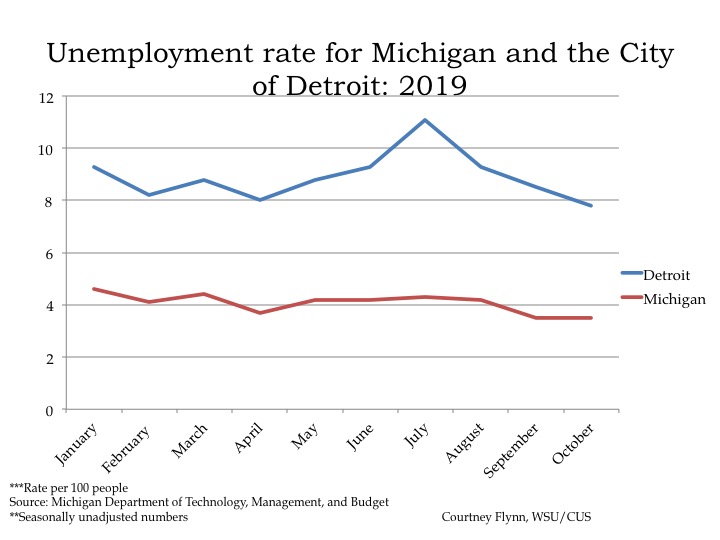
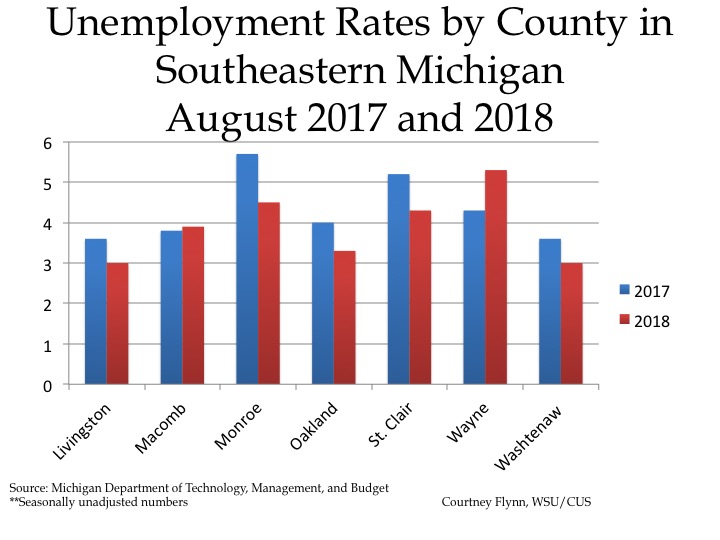
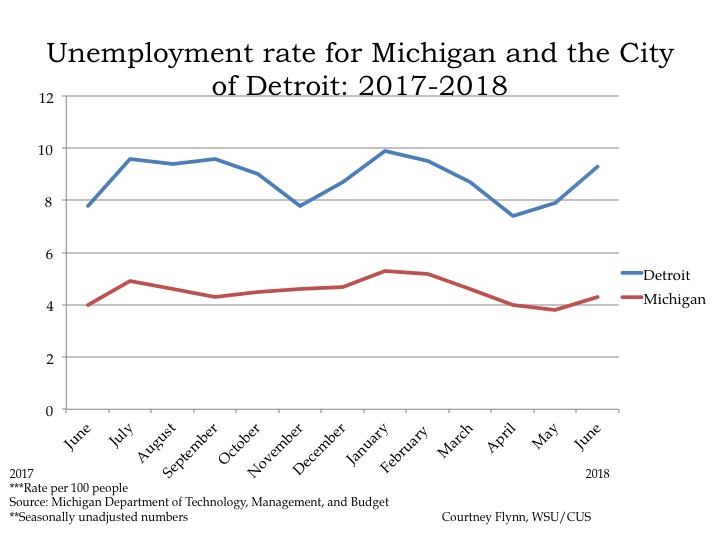
The October 2020 unemployment rate in Michigan was 5.1 percent, compared to 3.5 percent in October of 2019 (the most recent data available).  At the national level, according to the U.S. Bureau of Labor Statistics the unemployment rate was 6.9 percent of the non-farm working population. At the national and local level, unemployment rates aren’t as high as they were in April, when the pandemic first hit, but they are higher than they were compared to 2019.

So, as the pandemic continues we are more likely to see higher unemployment rates and more people unable to meet their needs from the unemployment benefits they receive (or should be receiving). According to a recent Money.com article, unemployment benefits in most states do not cover the basic needs of most families. This is due to the cost of living in a state (food, rent, utilities) compared to the amount and length of unemployment benefits received.

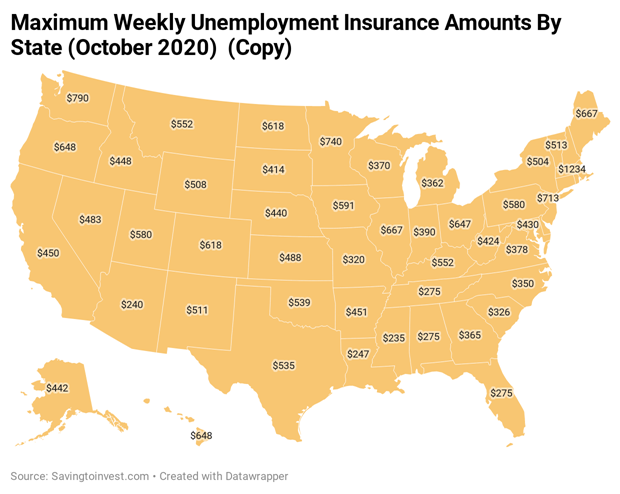
The map below shows the maximum unemployment an individual can receive in each state. Massachusetts has the highest amount of unemployment paid to an individual (with dependents) at $1,234 a week; it is also one of the wealthiest states. Conversely, Mississippi pays the lowest amount at $235. According to the article, Kentucky and Maine are among the poorest states in the Country but their unemployment benefits ($552 and $667, respectively) allow residents to cover their basic needs.  The unemployment benefits in Kentucky and Maine are higher than that of Michigan’s $362 a week.


According to the Economic Policy Institute, families with two adults and two children in the Detroit-Livonia-Warren metro need an annual income of $79,308 – or $6,609 per month – to live comfortably. With the an unemployment amount of $362 a week for 26 weeks (factoring in the pandemic) for an adult household of two (two adults bringing in income, but with two children as well), that brings in about $19,000 for the year—far below the amount a family with two children needs to live comfortably.

As the pandemic continues on, citizens and certain lawmakers continue to urge for additional relief to aide affected families and the economy. Just last week, Gov. Gretchen Whitmer called on the legislature to permanently extend the unemployment benefits length to 26 weeks and also increase the weekly amount (no amount was specified). No movement has been made on the request. Michigan’s current unemployment benefits were inked into law in 2002 and are due for an overhaul. The way it currently stands, hundreds of people could be left without unemployment benefits the day after Christmas because of a combination of having maxed out their time receiving Michigan unemployment benefits and the fact that federal COVID unemployment programs created through the CARES Act are set to expire. Changes to unemployment benefits need to take place at the State level, but help from the federal government is also necessary, especially during the pandemic. 

Economic Indicators: Industrial Areas Seeing Increase in Leasing

In October of 2019 the unemployment rate for the State of Michigan was 3.5, the same as it was for the month of September, according to the most recent data provided by the Michigan Department of  Technology, Management and Budget. The State unemployment rate for October of 2018 was only slightly higher than it was this year in October, 3.7.

In October of 2019 Detroit’s unemployment rate was 7.8 percent.  That Detroit unemployment rate was 0.7 points lower in October of 2019 from the previous month. Also, the October 2019 unemployment rate for Detroit was 1.5 points lower from the previous year. In October of 2018 it was 9.3 percent.

The chart above displays the unemployment rates for each of the seven counties in Southeastern Michigan for October of 2018 and 2019. In October of 2019 Wayne County had the highest unemployment rate at 4.5. Washtenaw County had the lowest unemployment rate at 2.5.

Between October of 2018 and 2019 each county in the region had a lower unemployment rate in 2019 than the previous year; the county with the largest decrease was Macomb County. In October of 2018 the unemployment rate in Macomb County was 4.1 and in October of 2019 it decreased to 3. Also, Macomb, Livingston, Monroe and Washtenaw counties all had unemployment rates at 3 percent or lower while St. Clair and Wayne counties had unemployment rates at 4.1 and 4.5, respectively.

The availability of industrial spaces is another aspect of an area’s financial health and below is information from the quarterly reports of Cushman and Wakefield, a global real estate firm, which produces information related to Metro-Detroit. According to the company, leasing of industrial spaces in the third quarter of 2019 is up from the second quarter, with the Airport area having the strongest increase by landing companies such as DSV and Crane World Wide Logistics with their lease renewals. Additionally, the overall vacancy rate in the Metro-Detroit area is at 2.9 percent, and as shown in the first chart below the Downriver and East side areas have the lowest vacancy rates at 1.5 percent. The Southfield area has the highest vacancy rate at 5 percent.

The second chart below shows the average cost of industrial spaces in the region per square foot. There are three different types of industrial space as defined by Cushman and Wakefield and those are: manufacturing, office space and warehouse/distribution spaces. As the chart shows, office space has the highest market value, with the Southfield area having the highest cost at $14.19 per square feet. In nearly all the areas warehouse/distribution spaces has the second highest cost with Southfield again having the highest market rate at $7.15 per square foot. In the Downriver and Troy areas though manufacturing spaces have a higher market rate than the warehouse space. In Downriver, manufacturing spaces average $4.94 per square foot and warehouse spaces average $4.80 per square foot; in Troy manufacturing spaces average $7.22 per square foot and $5.60 per square foot for warehouse spaces. Troy also has the highest market value for manufacturing spaces in the region.

According to Cushman and Wakefield, there is an expectation that utilization of industrial spaces will continue to increase in 2020 meaning a continuation of low vacancy rates.

The above chart shows the Standard and Poor’s Case-Shiller Home Price Index for the Detroit Metropolitan Statistical Area. The index includes the price for homes that have sold but does not include the price of new home construction, condos, or homes that have been remodeled.

According to the index, the average price of single-family dwellings sold in Metro Detroit was $129,250 in September 2019; this was $800 lower than the average family dwelling price in August. The September 2019 price was an increase of $4,460 from September of 2018 and an increase of $11,650 from September of 2017, an increase of $19,470 from September of 2016 and increase of  $25,670 from September of 2015 and, finally, an increase of 
$30,910 from September of 2014.

Global View: Southeastern Michigan Income Disparities Not So Vast

In Southeastern Michigan the range of median household incomes is vast. In Highland Park the median household income is about $16,000, and only 25 miles away the city of Bloomfield Hills has a median income of about $187,000. There are only three communities in Macomb, Oakland and Wayne counties that have a median household income above $152,000, and all three of those communities (Bloomfield Hills, Lake Angelus and Orchard Lake) are located in Oakland County. Conversely, there are about 25 communities in those three counties where the median income is less than $50,000, with most of those communities being located in Wayne County.


While the range of median incomes regionally is immense, the map below further shows just how wide that range is when looking at it from a national perspective. With a median income of about $187,000, the city of Bloomfield Hills ranks in the 90th percentile for median household income nationwide, as does the city of Lake Angelus ($166,000 median household income). Just a mere 25 miles away though, there are five cities with median household incomes that rank in only the 10th percentile nationwide. Those cities are:

  • Highland Park: $15,699
    • Ecorse: $23,556
    • Hamtramck: $24,369
    • Royal Oak Township: $26,406
    • Detroit: $27,838

A deeper look at the map below shows that most of Oakland County has households with median incomes in at least the 50th percentile nationwide. Macomb and Wayne counties are primarily made up of communities with median household incomes in the 30th and 40th percentiles nationwide.

When examining median household incomes in Southeastern Michigan through a global lens, the gap between communities like Highland Park and Bloomfield Hills does shrink. As shown in the map below, the city of Highland Park ranks in the 63rd global percentile for median household incomes and the city of Bloomfield Hills ranks in the 99th percentile. What this map shows is that on a global level, even our communities with the lowest median household incomes fare far better than many communities throughout the world.

According to the Washington Post, a $59,000 a year income ranks in the 40th national percentile but in the 91st percentile globally. About 70 percent of the U.S. population falls in the global middle class, which the Washington Post defines as being able to afford the basics (food, clothing and shelter) while also having some disposable income.

Metro-Detroit Economic Indicators

In December of 2018 the unemployment rate for the State of Michigan was 4.1, an increase from the November unemployment rate of 3.4, according to the most recent data provided by the Michigan Department of Technology, Management and Budget. The State unemployment rate for December of 2017 was 0.6 points below what it was in December of 2018 (4.7). Since April of 2018 the data shows that the unemployment rate for the State essentially leveled out around 4, except when it dropped to 3.4 in November.

The Detroit rate was 0.5 points higher in December of 2018 from the previous month. Also, the December 2018 unemployment rate for Detroit was 0.1 points lower than what it was in December of 2017.

The chart above displays the unemployment rates for each of the seven counties in Southeastern Michigan for December of 2017 and 2018. In December of 2018 Wayne County had the highest unemployment rate at 4.9, with St. Clair County having the second highest regional unemployment rate 4.7. Livingston, Oakland and Washtenaw counties were the only three in the region with unemployment rates below 4 in December of 2018. The unemployment rate for Livingston County was 3.3, the unemployment rate for Oakland County was 3.3 and the unemployment rate for Washtenaw County was 3.1.

When comparing 2017 and 2018, Monroe, Washtenaw and Wayne counties were the only three in the region to experience a decrease in unemployment. Wayne County had the largest decrease at 0.9 points. Livingston, Macomb and St. Clair counties all experienced an increase from 2017 to 2019. Livingston County had the largest increase at 0.2.

The above chart shows the Standard and Poor’s Case-Shiller Home Price Index for the Detroit Metropolitan Statistical Area. The index includes the price for homes that have sold but does not include the price of new home construction, condos, or homes that have been remodeled.

According to the index, the average price of single-family dwellings sold in Metro Detroit was $123,550 in December 2018; this was $490 lower than the average family dwelling price in November. The December 2018 price was an increase of $6,210 from December of 2017 and an increase of $13,430 from December of 2016, an increase of $19,780 from December of 2016 and increase of $26,570 from December of 2014.

Economic Indicators: Unemployment Drops in Detroit

  • In November unemployment rates remain stagnant at the state level, decrease in Detroit;
  • Majority of Southeastern Michigan counties have higher average weekly wages than the national average;
  • Housing prices continue to rise in Metro-Detroit.

In November of 2018 the unemployment rate for the State of Michigan was 3.9, a rate that did not change from the previous month, according to the most recent data provided by the Michigan Department of Technology, Management and Budget. The State unemployment rate for November of 2017 was 0.7 points above what it was in November of 2018.

The Detroit rate was 1.3 points lower in November of 2018 from the previous month. Also, the November 2018 unemployment rate for Detroit was 0.2 points higher than what it was in November of 2017.

The chart above displays the unemployment rates for each of the seven counties in Southeastern Michigan for November of 2017 and 2018. All declined except for Livingston, which stayed the same. In November of 2018 Wayne County had the highest unemployment rate at 4.6, with St. Clair County having the second highest regional unemployment rate 4.1. Livingston, Oakland and Washtenaw counties were the only three in the region with unemployment rates at or below 3 in November of 2018. The unemployment rate for Livingston County was 2.9, the unemployment rate for Oakland County was 3 and the unemployment rate for Washtenaw County was 2.6.

Washtenaw County experienced the largest decline, with the November 2017 unemployment rate being 3.3 and the November 2018 unemployment rate being 2.6.

Regionally, according to the Bureau for Labor Statistics, Oakland County has the highest average weekly wages for all industries at $1,168, with Washtenaw County following closely at $1,134 and Wayne County just behind that at $1,125. The U.S. average weekly earnings were $887; St. Clair and Livingston counties are the only two in the region with average weekly earnings below the national average.

The above chart shows the Standard and Poor’s Case-Shiller Home Price Index for the Detroit Metropolitan Statistical Area. The index includes the price for homes that have sold but does not include the price of new home construction, condos, or homes that have been remodeled.

According to the index, the average price of single-family dwellings sold in Metro Detroit was $124,840 in November 2018; this was $30 lower than the average family dwelling price in October. The November 2018 price was an increase of $6,990 from November of 2017 and an increase of $15,050 from November of 2016, an increase of $21,570 from November of 2015 and increase of $26,620 from November of 2014. Note that the amount of annual increase is declining steadily.

Building in Metro-Detroit Beginning to Slow

  • The State and City of Detroit’s unemployment rates decreased at the monthly and annual levels;
  • Regionally, August 2018 unemployment rates are lower than the prior year, with the exception of Macomb and Wayne counties;
  • Housing prices continue to rise in Metro-Detroit.
  • New building permits being pulled regionally decreasing

In August of 2018 the unemployment rate for the State of Michigan was 4.1, a small decrease from the July unemployment rate of 4.2, according to the most recent data provided by the Michigan Department of Technology, Management and Budget. The State unemployment rate for August of 2017 was 0.5 points above what it was in August of 2018.

The Detroit rate was 0.2 points lower in August of 2018 than in August of 2017. Also, the August 2018 unemployment rate for Detroit was 1.7 points lower than what it was the previous month (July 2017).

The chart above displays the unemployment rates for each of the seven counties in Southeastern Michigan for August of 2017 and 2018. In August of 2018 Wayne County had the highest unemployment rate at 5.3, with Monroe County having the second highest regional unemployment rate 4.5. These two counties were the only two in the region to have unemployment rates at or above 4.5 in August of 2018. Conversely, Oakland, Washtenaw and Livingston counties all had unemployment rates at or below 3.5 in August of 2018.

Regionally, Livingston County had the lowest unemployment rate in August of 2018 at 3. Livingston County also had the lowest unemployment rate in August of 2017 at 3.6 while Monroe County had the highest unemployment rate in August of 2017 at 5.7.

When comparing 2017 and 2018, Wayne and Macomb counties are the only two where the unemployment rate was higher in 2018 than in 2017. For Macomb County, in August of 2017 the unemployment rate was 3.9 and for 2018 it was 3.8. For Wayne County there was also a 1.0 difference, from 4.3 in 2017 up to 5.3 in 2018.

The above chart shows the Standard and Poor’s Case-Shiller Home Price Index for the Detroit Metropolitan Statistical Area. The index includes the price for homes that have sold but does not include the price of new home construction, condos, or homes that have been remodeled.

According to the index, the average price of single-family dwellings sold in Metro Detroit was $124,240 in July 2018; this was $510 higher than the average family dwelling price in June. The July 2018 price was an increase of $7,160 from July of 2017 and an increase of $15,070 from July of 2016, an increase of $20,900 from July of 2016 and increase of $26,110 from July of 2014.

While home prices have been growing in Southeastern Michigan, a recent Detroit News article detailed how construction is slowing down, largely in part due to land and labor shortages and the associated costs. Also according to the article, August housing permits for single-family home construction decreased by 1.8 percent statewide compared to this time last year. This 1.8 percent increase was nearly the same as it was at this time last year (from 2016 to 2017), but for 2016 that annual increase was about 10 percent, according to the article.

The chart below highlights how around 2011 the number of single family home building permits issued in each county in the region began to increase, spiking in about 2013. Then, more recently, Oakland, Wayne, Monroe and St. Clair counties experienced another increase in the number of permits pulled in 2017. However, the 2018 numbers, which are not complete for the year, do indicate that year end numbers will not compare with 2017. With only three months left in the year, and construction season slowing down for winter, it is likely many, if not all the counties in the region will not increase the annual number of building permits pulled over 2017.

Despite some regional housing growth, the Detroit News article indicated that affordable single family homes, particularly ones geared toward first-time buyers, are lacking in inventory in the region.

Wayne County Has Highest Average Payment for Food Stamps

In Southeastern Michigan, Wayne County had both the highest average payment per person for the state’s food assistance program and the highest number of both adult recipients and child recipients, according to 2018 from the Michigan Department of Health and Human Services. The Michigan Food Assistance Program is a temporary food assistance program for eligible low-income families and individuals; the program is administered through the U.S. Department of Agriculture. At the federal level this program is referred to as the Supplemental Nutrition Assistance Program (SNAP).

According to the data, thus far in 2018 Wayne County had 244,821 adult recipients of the state’s food assistance program and 178,744 child recipients. Wayne County also had the highest average food assistance payment per person at $132. Macomb County had the second highest number of recipients in 2018, according to the data. In 2018 Macomb had 62,109 adult recipients and 39,179 child recipients. However, Macomb County did not have the second highest average food assistance payment per person. Rather, Oakland County had the second highest average payment at $124. Livingston County had the lowest total of both adult and child recipients (4,449 and 2,652 respectively) and the lowest average payment per person at $119. According to the Center on Budget and Policy Priorities, the average monthly Food Assistance Program payment to Michigan residents in fiscal year 2017 was $125; Wayne County was the only county in the region above this average. Average payments are based on how close to, or below, the poverty line an individual or family are. The higher poverty level of an individual or family means they will likely receive more funding for food assistance.

The maps below further demonstrate why Wayne County had the highest number of Food Assistance Program recipients. Despite the data below being from 2016 (the state did not have data at the municipal or Census tract level and the most recent data from the Census is from 2016), the first map below highlights how Detroit, Highland Park, Inkster, Ecorse and Lincoln Park all have more than 29 percent of the cities’ households receiving food assistance. Outside of the Wayne County, the only other communities with more than 29 percent of its households on the food assistance program were Pontiac in Oakland County and Port Huron in St. Clair County.

In 2016, 42 percent of residents were on the Food Assistance Program (also known as SNAP/Food Stamps) in Detroit, with the concentrations being along some of the City’s main corridors, including Gratiot and Grand River avenues. There were more than 30 Census tracts where between 58 and 83 percent of the families living there were on the state’s food assistance program; these Census tracts were spread throughout the City. On the other hand, there were only about a dozen Census tracts in the City where 22 percent of the families living there were on the food assistance program; these Census tracts were right along the Detroit River and on the City’s northwest side.

As the data in this post shows, the State’s food assistance program is used by thousands of families in the region. With the state’s new requirement that individuals on the food assistance program must work it will be interesting to see how and if the program numbers shift.

Detroit Housing Prices Continue to Rise

  • The State and City of Detroit’s unemployment rate increased at the monthly and annual levels;
  • Regionally, June 2018 unemployment rates are higher than the prior year, with the exception of Monroe and Washtenaw counties;
  • Housing prices continue to rise in Metro-Detroit.

In June of 2018 the unemployment rate for the State of Michigan was 4.3, an increase from the May unemployment rate of 3.8, according to the most recent data provided by the Michigan Department of Technology, Management and Budget. The State unemployment rate for June of 2017 was 0.3 points above what it was in June of 2018.

The Detroit rate was 1.4 points higher in June of 2018 than in May. Also, the June 2018 unemployment rate for Detroit was 1.5 points higher than what it was in June of 2017.

The chart above displays the unemployment rates for each of the seven counties in Southeastern Michigan for June of 2017 and 2018. In June of 2018 Wayne County had the highest unemployment rate at 5.4, with St. Clair County having the second highest regional unemployment rate 4.6. These two counties were the only two in the region to have unemployment rates above 4.5 in June of 2018. Conversely, Oakland, Washtenaw and Livingston counties all had unemployment rates at or below 3.5 in June of 2018.

Oakland County and Livingston County were the only other two counties in the region with an unemployment rate below 3.5. Regionally, Livingston County had the lowest unemployment rate in June of 2018 at 3.3. Livingston County also had the lowest unemployment rate in June of 2017 at 3 while Wayne County had the highest unemployment rate in June of 2017 at 5.

When comparing 2017 and 2018, Monroe and Washtenaw counties are the only two where the unemployment rate was higher in 2017 than in 2018. For Monroe County, in June of 2017 the unemployment rate was 4.9 and for 2018 it was 4.4. For Washtenaw County there was also a 0.4 difference, from 3.9 in 2017 down to 3.5 in 2018.

The above chart shows the Standard and Poor’s Case-Shiller Home Price Index for the Detroit Metropolitan Statistical Area. The index includes the price for homes that have sold but does not include the price of new home construction, condos, or homes that have been remodeled.

According to the index, the average price of single-family dwellings sold in Metro Detroit was $122,600 in May 2018; this was $920 higher than the average family dwelling price in April. The May 2018 price was an increase of $7,740 from May of 2017 and an increase of $16,060 from May of 2016, an increase of $21,030 from May of 2015 and increase of $26,430 from May of 2014.

Wayne County Experiences Largest Decrease in African American Homeownership

According to data from the American Community Survey, Saginaw County had the highest percentage of African American homeowners of the Michigan counties with more than 10,000 African American households. In 2000, 54 percent of the adult African American population owned a home in Saginaw County. In 2016, 51 percent of the adult African American population in Saginaw County owned a home; this was equivalent to 13,820 households. Overall, there was a 3 percent decrease between the percentage of African American household owners between 2000 and 2016 in Saginaw County. Ingham County also experienced a 3 percent change between 2000 and 2016, from 38 percent to 35 percent, and Washtenaw County experienced the lowest percentage change at 1 percent. In 2000 in Washtenaw County, 39 percent of the African American population owned a home and in 2016 it decreased to 38 percent. It was Wayne County that had the largest decrease between 2000 and 2016 in the percentage of African American homeowners. In 2000 53 percent of the African American population owned a home and in 2016 that decreased to 42 percent. In total in Wayne County, according to the American Community Survey, there were 303,717 households owned by African Americans in 2000 and in 2016 that decreased to 264,759.

According the Urban Institute, where this data was originally presented, the overall percentage of African American ownership in Michigan decreased from 51 percent in 2000 to 40 percent in 2016. Additionally, it was 45-64 age group that experienced the largest loss in homeownership (18%). While the overall loss of homeownership between 2000 and 2016 can be attributed to the Great Recession, the Urban Institute also found that the rise of land contracts and property tax foreclosures contributed to the loss.


More Underfunded Retiree Healthcare Plans than Pension Plans in Southeastern Michigan

In Southeastern Michigan more government entities were found to have underfunded retiree healthcare plans than the number of government entities with underfunded pension plans. According to the data provided by the Michigan Department of Treasury there were 50 underfunded retiree healthcare systems of the 183 government entities that had provided their financial information to the State as of June 9, 2018. A government entity’s retiree healthcare plan is deemed underfunded by the State if it is less than 40 percent funded and has an annual contribution greater than 12 percent of government funds.

Of the municipalities that were deemed funded by the State, Rose Township had the highest funding percentage for municipalities at 331 percent. Other municipalities with retiree healthcare funding above 100 percent are:

Municipalities

  • Rose Township: 331%
  • Groveland Township: 197%
  • Algonac: 163%
  • Oakland County: 127%
  • Detroit: 121%
  • Macomb Township: 114%
  • Royal Oak: 107%
  • Pontiac (Police and Fire): 105%
  • Milford: 104%
  • Farmington Hills: 100%

Special Districts

  • West Bloomfield Public Township Public Library: 147%
  • Brighton Area Fire Authority: 109%

While there was about a dozen different Southeastern Michigan government entities with more than 100 percent of the retiree healthcare plans funded, there were also 37 entities that had 0 percent of the retiree healthcare plan funded. However, not all of these entities were deemed underfunded, rather only 18 were. Not all government entities that fell below the 40 percent threshold were deemed underfunded due to the fact they were contributing less than 12 percent of their revenue to fund the plan. For example, the City of Brighton has 11 percent of its retiree healthcare funded, but according to the Michigan Department of Treasury, the city’s annual contribution to the plan is 10.4 percent of the City’s revenue. This is less than the 12 percent trigger point set by the State.

As with pension systems, funding retiree healthcare systems is vital not only to a government entity’s financial healthy, but also to retention and recruitment of employees.