Those in poverty often experience food insecurity, including children. With schools across the State of Michigan closed for the next several weeks due to the threat of the coronavirus disease (COVID-19) it is important to understand which school districts have students at a higher risk of food insecurity while school is out.
Those in poverty often experience food insecurity, including children. With schools across the State of Michigan closed for the next several weeks due to the threat of the coronavirus disease (COVID-19) it is important to understand which school districts have students at a higher risk of food insecurity while school is out.
New information on vacancies in Detroit
provides a mixed picture. There were 1,490 fewer vacant Detroit properties of
all kinds between September 2018 and September 2019, according to the U.S.
Postal Service. However, between June 2019 and September 2019 the number of
residential vacancies increased by 61 (discussed below). Overall in the month
of September of 2019 there were 82,738 vacant addresses.
Although there was a decrease in the number of
vacant addresses, the percentage of vacant addresses in Detroit has remained
between 21 and 22 percent since June of 2011. Vacancy rates reached 20 percent
in December of 2010. The peak vacancy rate in Detroit, according to U.S. Postal
Service data, was in March of 2015 when it was 22.8 percent; at that time it
was equivalent to 88,017 vacant addresses.
Looking backward, (we have USPS data back
through 2005) the lowest vacancy rate in Detroit was in December of 2005. At
that point, the rate was 10.03 percent, and that was equivalent to 38,981
vacant properties. So, overall we witnessed more than a doubling of vacancies
with a gradual decline to 82,738 from a peak of 88,017.
When examining only residential vacancy rates
that rate was 21.34 percent in September of 2019, which was equivalent to
74,818 vacant residential addresses. The residential vacancy rate between
September of 2019 and 2018 decreased by less than 1 percent, and the total
number decreased by 2,239 residential addresses. The five-year difference was a
decrease of 7,230 residential vacancies. The highest residential vacancy rate
was 23.5 percent in March of 2015; the lowest residential vacancy rate was in
February of 2008 at 15.8 percent. Following the peak residential vacancy rate
in 2015, those numbers have been on the decline.
In addition to these changes, in September of
2019 there was not a change in the number of “no stat” addresses–properties
denoted by mail carriers as being either “vacant” or “no-stat.” In September of
2019 the percent of no-stat properties was 6.2 percent. These no-stat properties are ones that carriers
on urban routes mark as vacant once no resident has collected mail for 90 days.
Addresses in rural areas that appear to be vacant for 90 days are labeled
no-stat, as are addresses for properties that are still under construction. So,
urban addresses labeled are those a carrier deems as unlikely to be occupied
again any time soon. That is, both areas where property is changing to other
uses and areas of severe decline may have no-stat addresses.
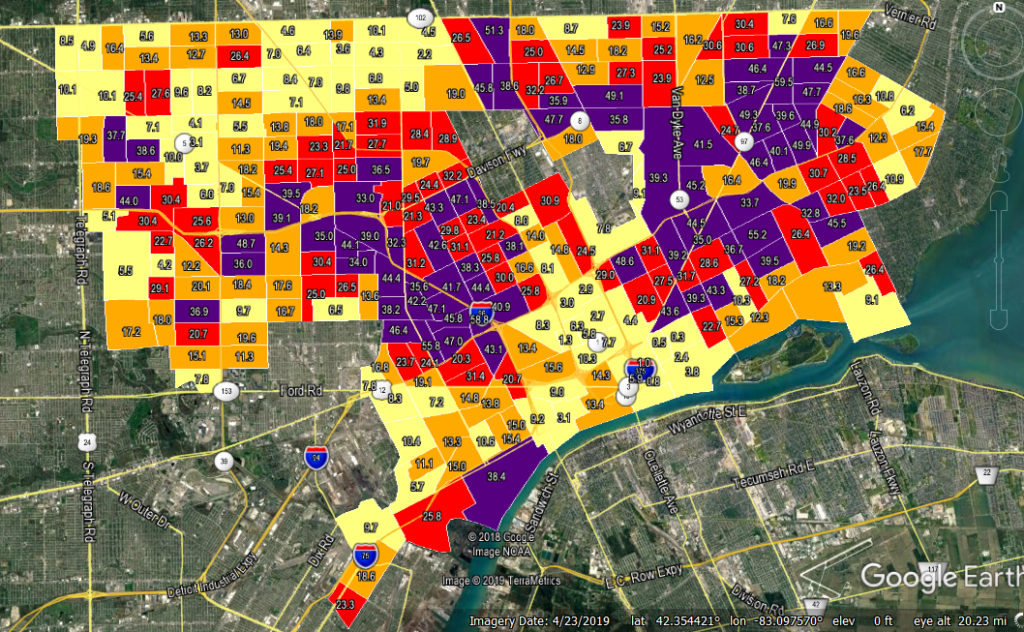
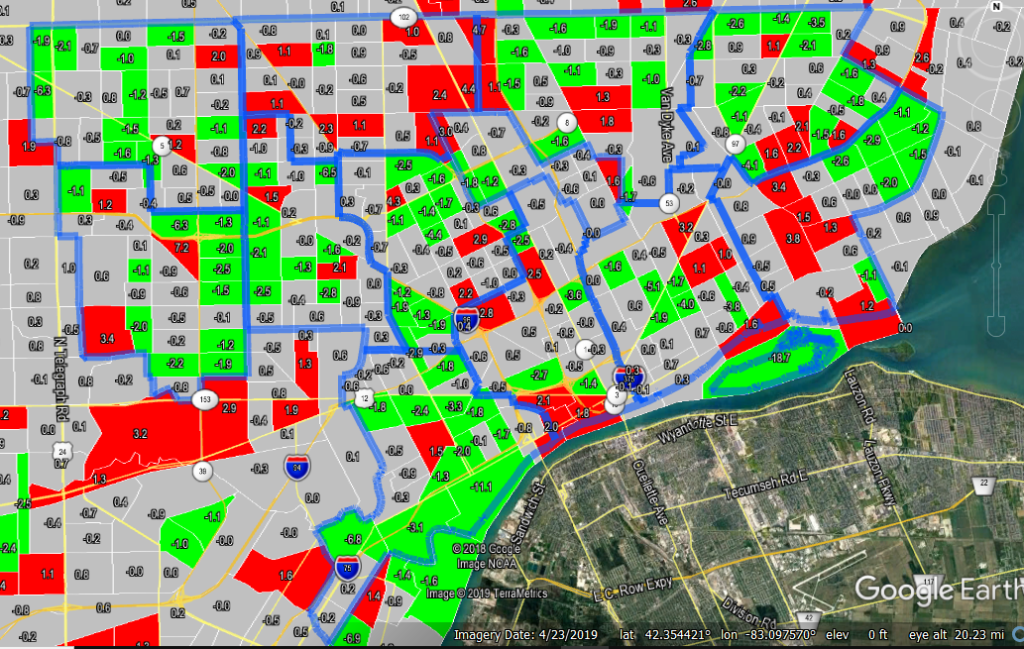
The maps below demonstrate both the overall
Detroit address vacancy rates (including residential and business vacancy
rates) by Census Tract for September 2019 (first map) and the change in vacancy
rates between September 2019 and September 2018 (second map). In total, there
were about 65 Census Tracts in Detroit with total vacancy rates above 35 percent.
The Census Tract with the highest vacancy rate in September of 2019 was located
north of I-94, between there and I-96, with a rate of 55.8 percent. There were
two large clusters of Census Tracts with vacancy rates above 35 percent, one
cluster was located along I-96 south and west of the Davison Freeway, and the
other was located on the eastside of the city along Gratiot Avenue.
While most of the Census Tracts in the City experienced a decrease in the number of vacancies from September 2018 to September 2019, there were about 40 tracts scattered all across the city that had an increase. The Census Tract with the highest increase was located on the City’s far west side and there was an increase of 7.2 percent. The tract with the largest vacancy rate decrease was located in Southwest Detroit and there was a decrease of 11.1 percent.
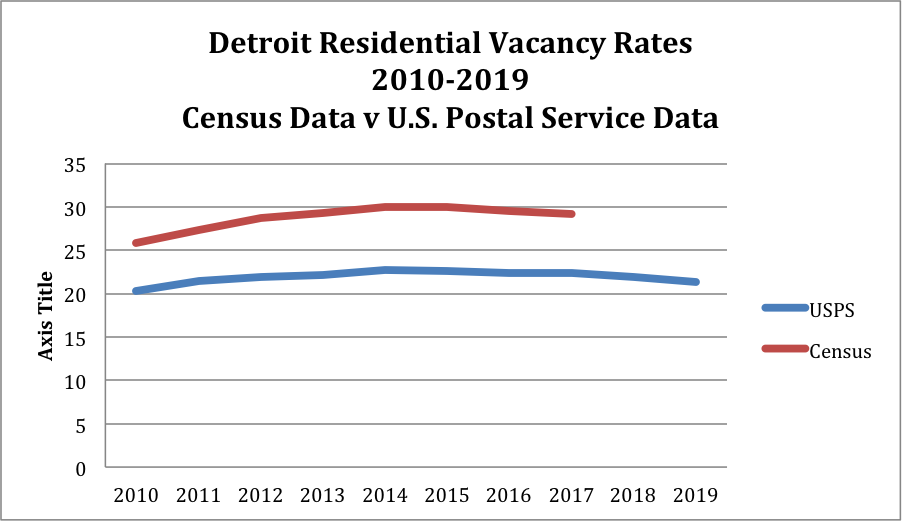
In addition to the U.S. Postal Service tracking vacancy data so does the U.S. Census Bureau. The chart below shows the differences that each agency reports in vacancy rates. The Census Bureau only tracks vacant houses while the U.S. Postal Service tracks residential properties, businesses and total vacancy rates. In the chart below only residential rates are examined. As the data shows, the Census regularly has higher residential vacancy rates as compared to the U.S. Postal Service. The most recent data for the Census data (2017) shows that the City’s residential vacancy rate was 29.2 percent and that was in 2017. The Postal Service’s equivalent rate was 22.4 percent at that time. The Census data is based on a sample of about 72,000 housing units. The U.S. Postal Service data is collected by postal service workers, if a residence is deemed occupied it means it requires mail service. It is deemed vacant if it does not require mail service. One potential reason for the difference in vacancy rates is the fact that the Census data is based on samples while the U.S. Postal Service relies on postal carrier’s actual observations of the properties.
Socioeconomic factors have a direct impact on the span of one’s life. Our posts on January 3,16 and 23 have demonstrated clear relationships between lifespan and key policy variables.
Where do you live? What is your highest-level education? How much do you earn? Do you have access to health care? Depending on how an individual answers each of those questions, their life expectancy may go up or down.
As we’ve learned over the last several weeks:
Those living at or below the poverty line have a lower life expectancy.
Those with a bachelor’s degree or higher have a higher life expectancy.
Those without health insurance have lower life expectancy.
We further examined the combined impact of these three factors to help understand which is most important. Using multiple regression analysis, we estimated the impact of each variable as well as their combined effect. Together they explain 62.6% of the variance in life expectancy across the region, meaning that nearly two thirds of one’s age at death is related to their combined effect. This is a highly statistically significant effect with less than one chance in a 1,000 that this estimate is a result of chance. Further, of the three variables, the most powerful variable is the level of education (b=0.100; beta=0.456). It is almost one and half times as powerful as poverty (-0.099; -0.345) the second most powerful variable. And education is four times as powerful as being uninsured (-0.081;-0.101).
Nevertheless, all three of these variables contributed an independent effect on life expectancy. These variables are correlated with each other, which under certain conditions can bias these results, but after examining statistics such multicollinearity this does not appear to be a problem. So, while poverty effects both education and the likelihood that somebody in uninsured, each provides an independent effect. No doubt other factors do as well, including chance, habits, and one’s genetic background.
Still it is both sad and potentially hopeful that much of the differences in life expectancy across our region can be explained by these factors because all of these factors are ones we, as a society and a polity, can affect.
This helps us answer the question of what can be done to improve average length of an individual’s life. We need to start by decreasing poverty. Decreasing poverty is not easy to tackle, but there are steps policy makers can take to lower the number of people living at or below the poverty level. Such actions include increasing the minimum wage, creating policies focused on long-term job growth and supporting equity in pay structures, job opportunities and available housing. Perhaps the most important policy is to use the tax system to redistribute income by taxing the very rich (the one and two percenters) to provide supports and services to those with less income. Remember the U.S. once taxed high earners at a rate over 70 percent.
More tax revenue would support higher education, which has recently been strangled by decreasing support from state governments and increasing reliance on student loans. The over-reliance on loans burdens graduating students with long term loan payments, which decrease their mobility and their ability to pursue graduate education.
The creation of a semblance of a national health care system through Obamacare has provided some basic protections for many who had no care. There are, however, still many that do not have care or for whom care is so expensive they cannot truly afford it. Increasing access to health insurance will also require extensive work, but one way to start includes providing information to the underserved on their current options to receive healthcare, and extending these services. Policies reforming the fee structures instituted by insurance and medical companies and creating alternative payment methods are other ways to make health care more accessible.
Overall, discovering reasons why certain communities in Southeastern Michigan have such lower average life expectancies helps us understand what we need to move ahead. Let’s provide them with the income to create healthy lifestyle and sustain longer lives. However, actions must be taken in order for those opportunities to be made available. We as a society, and our policy makers, need to ensure equity and equality are inherent parts of the socioeconomic policies that can ultimately give individuals an opportunity to live a longer life.
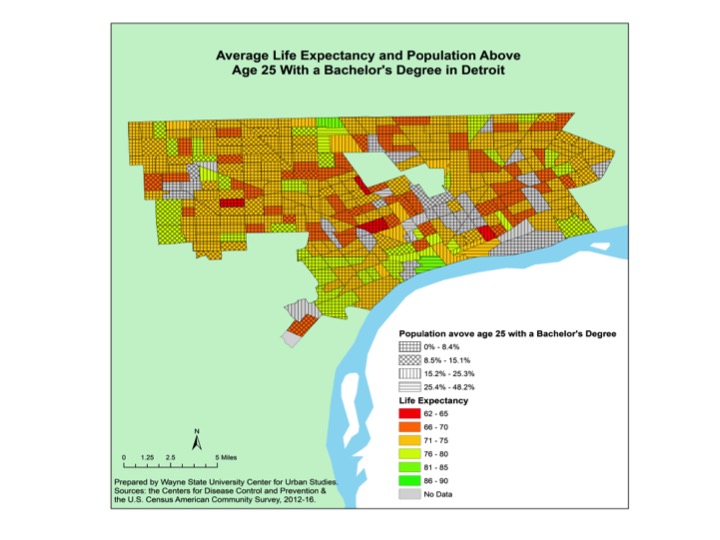
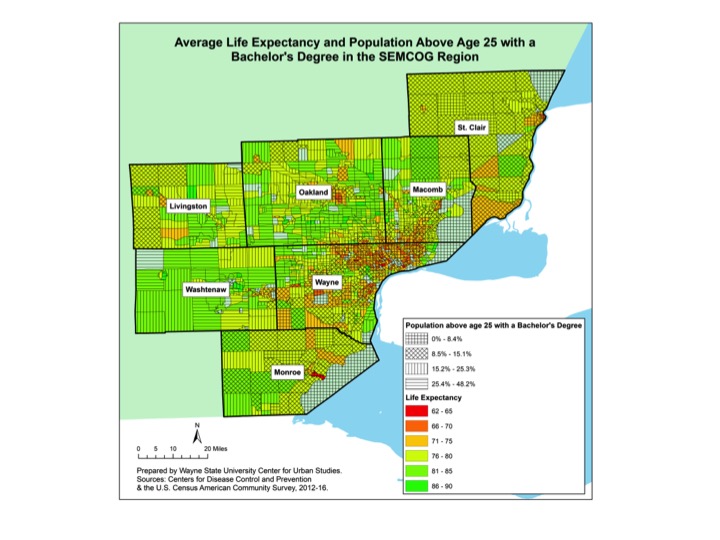
Another way to think about life expectancy is to say that it is partially a result of the choices we make, and the quality of choices might be indicated by our extent of education. Here we have represented education by the percent of a tract’s population over 25 that has a bachelor’s degree or higher. One could argue, appropriately, that getting a college education is at least partially a function of family income, but for now we want to see the simple correlation of this measure or education and life expectancy. We find a correlation between life expectancy and those with a bachelor’s degree or higher is 0.721 (sig. 0.00), meaning, as an individual’s education level increases so does their average age of life expectancy. In Detroit, the map below shows that majority of the Census Tracts that make up the City have about 8 percent of the 25 years of age and older population having earned a bachelor’s degree or higher. And, as we’ve discussed throughout this series, Detroit has among the lowest average life expectancy rates in the Southeastern Michigan region. The two Census Tracts in Detroit with the highest life expectancy rates (86-90 years of age) also have the highest percentage of individuals age 25 years and older with a bachelor’s degree or higher. The one Census Tract just south of 8 Mile Road with the highest average life expectancy rate has between 15 and 25 percent of the 25 years of age and older population having earned a bachelor’s degree or higher. The other Census Tract in Detroit with the highest average life expectancy is just southwest of Downtown Detroit and has between 25 and 48 percent of the 25 and older population having earned a bachelor’s degree or higher. On the opposite side of the spectrum, three of the four Census Tracts in the Detroit with the lowest average life expectancy (62-65) also have the lowest percentage of residents 25 years of age and older who earned a bachelor’s degree or higher.
Outside of Detroit there are similar trends: communities with lower average life expectancies tend to also have lower percentages of individuals with a bachelor’s degree or higher. For example, the majority of Washtenaw County has an average life expectancy at 86 years of age or older. Additionally, the majority of that county has 15 percent or more of the 25 years of age and older population having earned a bachelor’s degree or higher. There are exceptions, areas in the more rural counties, particularly Monroe and St. Clair counties, though that have average life expectancies above the regional average but have lower percentages of individuals living with a bachelor’s degree or higher.
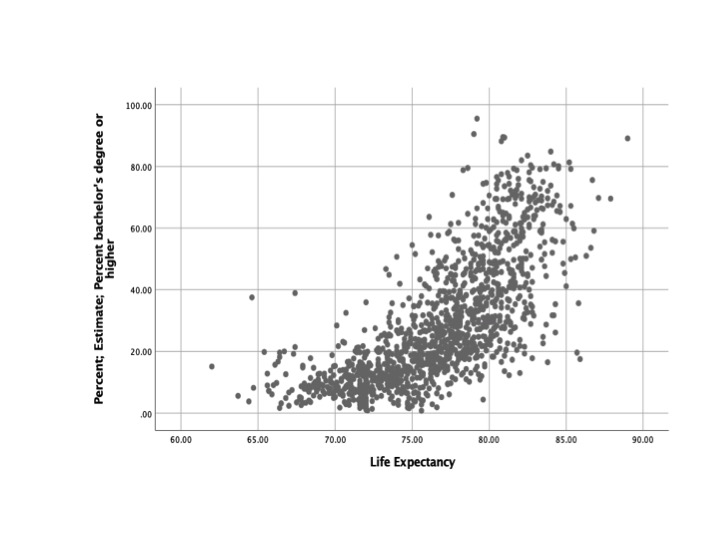
As has been shown above, there is a strong positive correlation between the percentage of individuals 25 years of age and older who earned a bachelor’s degree or higher and an individual’s life expectancy. This positive correlation is further demonstrated in the scattergram below, which shows that as the percentage of the population with a bachelor’s degree or higher increases, so does the average life expectancy. The chart also shows that majority of the population in Southeastern Michigan has a life expectancy between 70 and 80 years of age with 20 percent or less of that population having earned a bachelor’s degree or higher. Additionally, the chart shows that any area with a population that has 60 percent or more of the population having earned a bachelor’s degree or higher has an average life expectancy of 75 years of age or higher.
As has been shown through some of the examples above, there is a strong positive correlation between the percentage of individuals 25 years of age and older who earned a bachelor’s degree or higher and an individual’s life expectancy. This positive correlation is further demonstrated in the chart above, which shows that as the percentage of the population with a bachelor’s degree or higher increases, so does the average life expectancy. Additionally, the chart shows that any area with a population that has 60 percent or more of the population having earned a bachelor’s degree or higher has an average life expectancy of 75 years of age or higher.
Overall, these maps and the graph show that education is related to an individual’s life expectancy. Reasons for this include, tendency to earn higher wages, which allows easier access to health care and transportation. In a recent News Scientist article it was also stated that more education leads to higher life expectancy because education improves an individual’s cognitive abilities, which allows for better planning and self-control.
Next week, we will further examine how all three factors, education, access to health insurance and poverty, all affect an individual’s life expectancy.
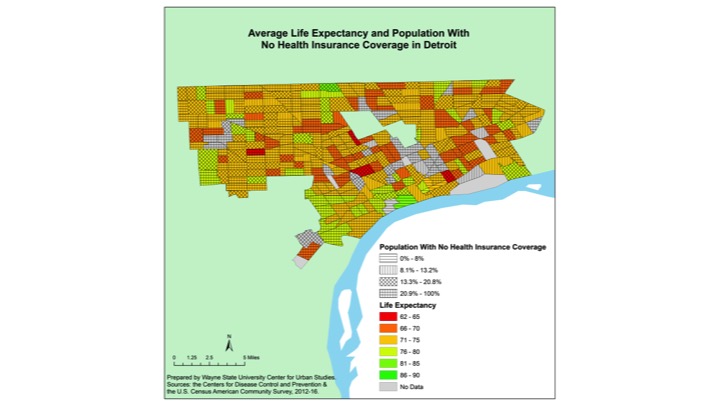
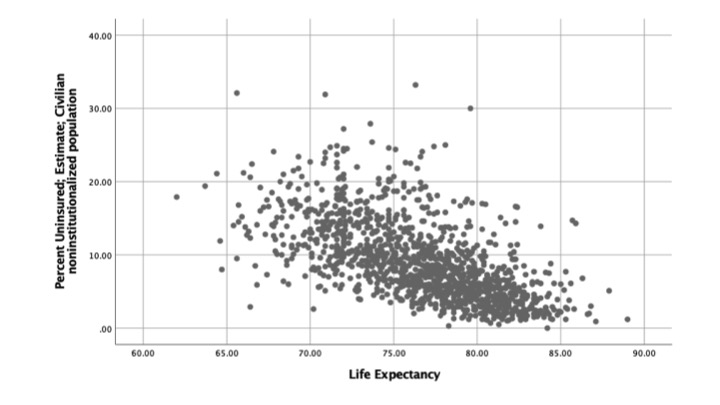
The correlation between life expectancy and those who are uninsured is -0.617 (sig. 0.00), meaning that there is moderately strong tendency for the length of life to decline as lack of access to health care (i.e. being uninsured) increases. In general, those without health insurance tend to live shorter lives. For example, in the City of Detroit, there are more than 25 different Census Tracts where residents have a life expectancy of 70 years of age or less. Of those Census Tracts, majority of them have 21 percent of the population or more living without health insurance. Even as life expectancy increases to the median range of the spectrum in Detroit, the evidence shows that majority of the Census Tracts have about 13 percent of the population or more without health insurance. Interestingly though, only one of the four Census Tracts where the average life expectancy is 65 years of age has 21 percent or more of the population living without health insurance. The other three Census Tracts with such an average life expectancy has between 13 and 21 percent of the population living without health insurance.
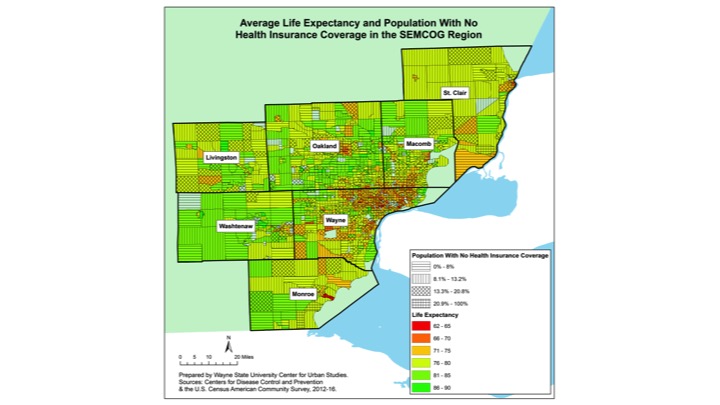
When moving beyond the boundaries of Detroit, in many of the outer-ring suburbs life expectancy increases as does the percentage of residents with health care. For example, majority of Washtenaw, St. Clair and Monroe counties have less than 13 percent of the populations living without health insurance and average life expectancies at 76 years of age or higher. With the exception of one Census Tract in southern Monroe County, no other areas in those three outlying counties have more than 21 percent of the population living without health insurance. As you do move in closer to Detroit though, there are wider ranges of life expectancies and access to health care. In Wayne County, for example, areas such as Romulus and Lincoln Park also have lower life expectancies (70 years of age or less) and more than 21 percent of the population not having health insurance. But, there are also areas, such as Grosse Ile, where the average life expectancy is 86 years of age and above and 8 percent or less of the population do not have health insurance. While the average life expectancy tends to be higher in Macomb and Oakland counties, there are still pockets, such as South Warren, Mt. Clemens and Pontiac, where the average life expectancy is 70 years of age or less and those without health insurance is at about 13 percent or higher.
As has been shown through some of the examples above, there is a moderately strong negative correlation between the percentage of the population living without health insurance and the average life expectancy of Census Tracts in Southeastern Michigan. This is further demonstrated in the chart above, which ultimately shows that as the percentage of the population living without health insurance increases the average life expectancy decreases. The chart also shows though that majority of the Census Tracts in Southeastern Michigan have an average life expectancy of about 75 years of age or higher with 10 percent of less of the population living without health insurance.
Overall, these maps and the graph show that while there is a range in life expectancies in Southeastern Michigan, there is also a range in those with access to health care, particularly those in and around Detroit. Access to health care is important as health care providers can not only treat, but also prevent, a plethora of illnesses and diseases. Such knowledge and treatment is vital for longer life expectancies.
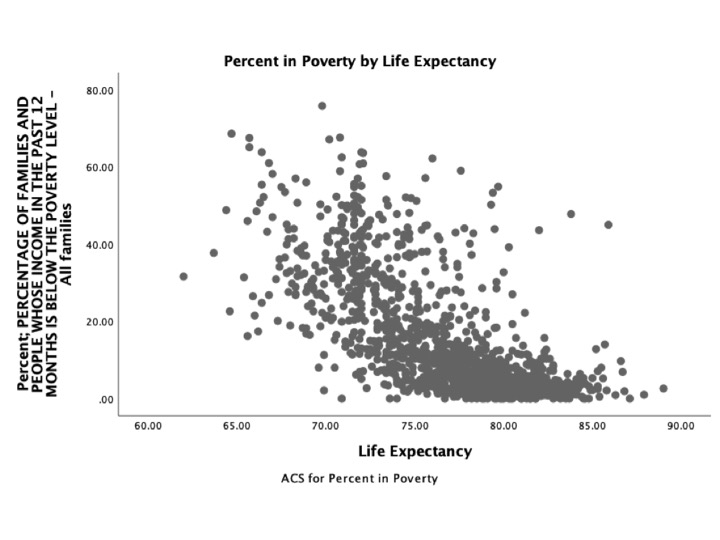
There is a huge variation in life expectancies in Southeastern Michigan, from an average of 62 years in the lowest Census Tract to a high in 85.9 in the highest tract. Moreover life expectancy is closely and negatively related to poverty. The correlation between life expectancy and poverty is -0.713 (sig. 0.01), meaning that there is moderately strong tendency for the length of life to decline as poverty increases in a tract. Or, put simply, poor people die sooner, a lot sooner. Both the maps and chart below present the relationship between shorter life expectancy and poverty or conversely lower levels of poverty in a tract and higher average life expectancy. At the same time, the majority of the areas in Southeastern Michigan have 20 percent or fewer of families living below the poverty line, along with average life expectancies between about 75 and 85 years of age. For reference, the average life expectancy in the United States is about 79 years of age and the federal poverty level for a family of four is $24,300. In 2017 12.7 percent of the U.S. population was living in poverty.
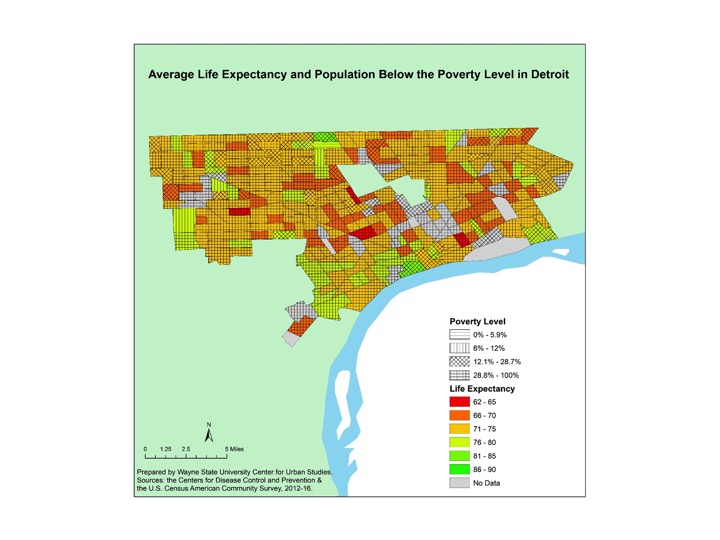
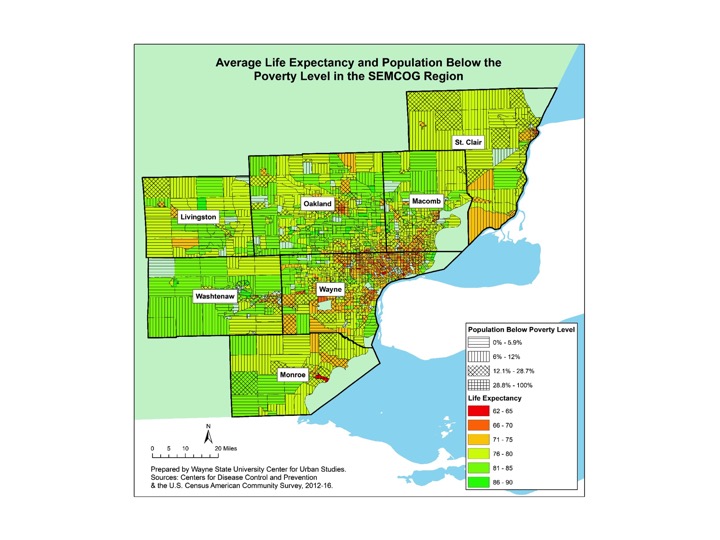
For the City of Detroit there is an average life expectancy across tracts is 71 to 75 years of age, although there are several Census Tracts where the average life expectancy is well below 70. Most of the Census Tracts in Detroit, especially those with lower life expectancies, have more than 28 percent of the population living at or below the poverty line. Specifically, there are three Census Tracts in Detroit where the average life expectancy is between 62 and 65 and the percentage of the population living below the poverty line ranges from about 29-100 percent (the highest threshold in the Detroit map below). While Detroit demonstrates the correlation between higher than average poverty rates and lower life expectancy, there are certain parts of the region where the life expectancy is about on par with the national average (78.8 years of age) but the percentage of the population live in poverty is at or below the national poverty rate (12.7 percent). These examples occur in the mainly the rural areas of the region, such as parts of St. Clair, Livingston and Monroe counties. In general though, radiating out beyond Detroit and the inner-ring suburbs, poverty levels decrease, and the average life expectancy increases. For example, in nearly all of western Washtenaw County the average life expectancy ranges from 81-85 with the poverty levels being at or below 12 percent.
As has been attributed in some of the specific examples noted above, there is a moderately high negative correlation between the percentage of the population living at or below the poverty line and the average life expectancy of Census Tracts in Southeastern Michigan. When looking at the median poverty levels of the region with the life expectancies there is a -0.713 P value, which is statistically significant at the .01 level. What this means is that as the percent in poverty increases, there is a tendency for average life expectancy to decrease.
Overall, these maps show that throughout Southeastern Michigan there is a wide range in life expectancy and poverty levels, with outer ring suburbs faring better and more urban areas, such as Detroit, and some rural areas faring worse. While we see here that poverty does relate to average life expectancy rates, other factors that may also affect average life expectancy include access to health care and educational attainment. The correlation between these factors and the average life expectancy will be explored in the next two posts.
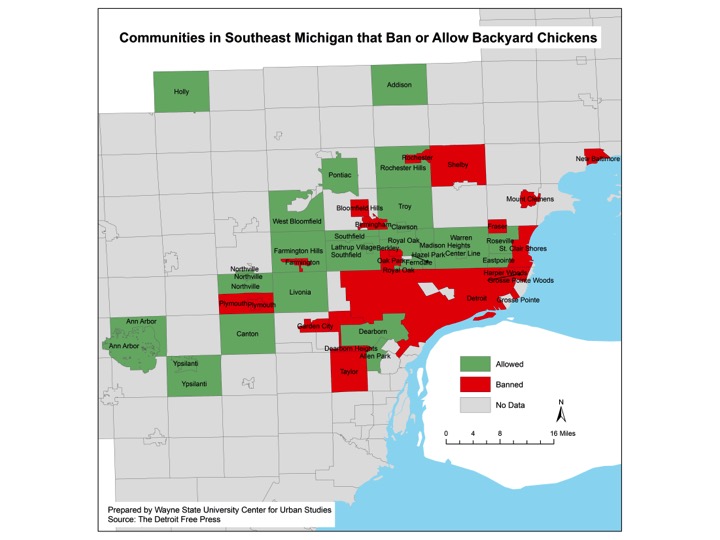
As Thanksgiving approaches it is worth noting that our state has had a great success in expanding wild turkey populations across the state from near extinction in 1900 to over 200,000 birds across the state nowadays. All but the most densely populated areas of Southeastern Michigan have wild turkeys. And now they will find many cities are allowing their domesticated cousins—chickens. And at least one has added ducks.
Across Southeastern Michigan there are 30 communities that allow for residents to house chickens on their property, according to recent research conducted by the Detroit Free Press. These communities have various ways of allowing residents to have the chickens on their property. For example, in the City of Warren residents are allowed to have three hens and pay a $10 registration fee to have the chickens. In the City of Berkley though restrictions are bit tighter, with only five permits available for residents to have backyard chickens.
It is within the purview of each community as to whether or not they want to allow backyard chickens and to what extent they will be allowed. This local control comes from a rule the Michigan Agriculture Commission adopted in 2014 that essentially states not everyone can claim rights under the Right to Farm Act. The rule is intended to protect the overall goal of the Right to Farm Act, which is to protect industrial sized farmers in rural communities. The local control aspect of backyard livestock and poultry allows more suburban and urban communities to decide what is best for their community and residents. As noted above some communities only allow a certain number of permits to be distributed, while others require a fee to be paid, and only a certain number of hens to be owned by an individual. While there are 30 communities in Southeastern Michigan that allow residents to own chickens, there are 21 that have banned them. Ann Arbor recently added ducks to the list of animals backyard farmers can cultivate.
Reasons individuals want to house chickens in their backyard typically links back to wanting the chicken’s eggs. Hens can lay up to five eggs per week. Reasons communities cite for wanting to ban them include the allegation that the chickens, and their feed, may attract rats and that the hens themselves may be a noise nuisance.
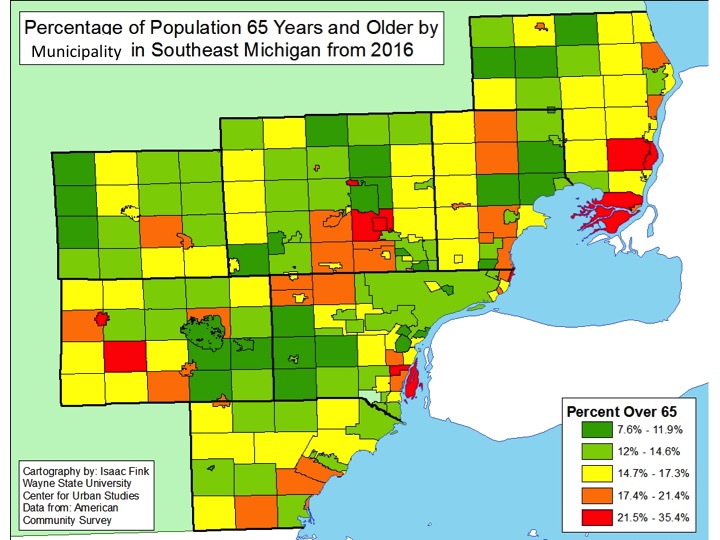
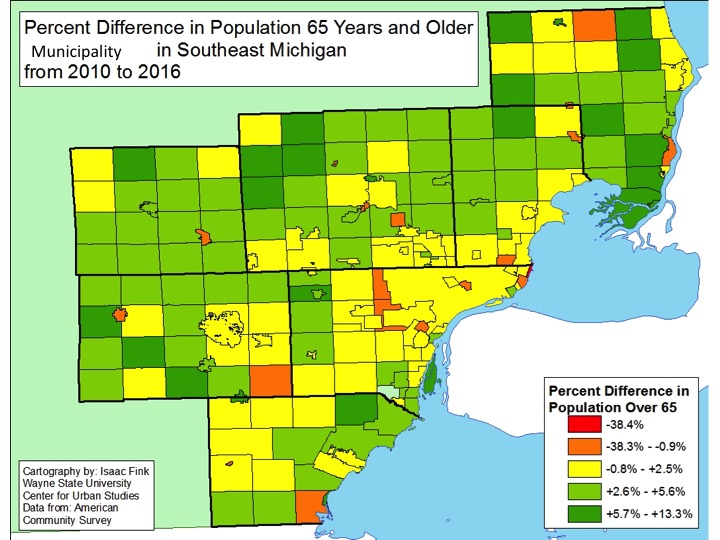
While there are only 10 communities in Southeastern Michigan with more than 21 percent of the population 65 years of age or older, the number of communities with a growing elderly population is far greater than those with a declining elderly population. According to the data, majority of the rural communities throughout Southeastern Michigan-Monroe, Washtenaw, Livingston, St. Clair and northern Macomb and Oakland counties-have seen the greatest increases in a growing elderly population. Overall, St. Clair County’s elderly population grew the most between 2010 and 2016, with nine of the communities experiencing between 6 and 13 percent increases in the 65 years of age and older population. In St. Clair County, Algonac (21%), China Township (22%) and East China Township (26%) had the highest percentage of elderly residents in 2016. However, it was Lake Angelus, in northern Oakland County, that had the highest percentage of resident 65 years of age or older at 35 percent.
Detroit, and its inner and outer ring suburbs have the highest concentration of the aging population that is growing at a slower rate. As the second map below shows, majority of the Detroit suburbs did not experience a growth of the 65 years of age and older population above 2.5 percent between 2010 and 2016. In fact, some of those communities (Hamtramck, Grosse Pointe, Redford, Dearborn Heights) experienced an overall decline in the 65 years of age and older population between 2010 and 2016. In Detroit, the 65 years of age and older population only grew by 1.6 percent between 2010 and 2016. According to the data, in 2010 the elderly population was at 11 percent and by 2016 it grew to 12.6 percent. In Hamtramck, the 65 years of age population decreased from 9.1 percent in 2010 to 7.8 percent in 2016.
According to a recent Detroit Free Press article, by 2025 the number of people above the age of 65 will outnumber those 17 and younger. Nationally, such a growth of the elderly population isn’t expected to occur until 2035. There are varying reasons for the growth of the 65 years of age and older population locally, and nationally, including better medical advancements allowing people to live longer and the decline in birth rates over the year. One reason for what appears to be the quicker growth of the aging population in Michigan though is the fact that over about the last decade, particularly during the Great Recession, people have left to find jobs elsewhere. So, in short, out-migration has contributed to the fact that Michigan’s elderly population will outnumber its younger population within the next decade.
Throughout Southeastern Michigan public transportation to get to work is utilized by less than 2 percent of the population in almost every community, according to 2016 Census data. The only community in Southeastern Michigan where more than 11 percent the population utilizes public transportation to travel to work is Highland Park. According to the data, 17.5 percent of the Highland Park population utilized public transportation to travel to work in 2016. It should be noted that Highland Park also has the lowest median income and highest poverty levels in Southeastern Michigan. Additionally, Highland Park has both Detroit Department of Transportation (DDOT) and the Suburban Mobility Authority for Regional Transportation (SMART) stops in the city. Next to Highland Park, Detroit, Ann Arbor and Ypsilanti have the next highest public transportation usage rates for commuting to work, ranging from 5 to 11 percent. These areas also have access to dedicated public transportation systems. For example, in Detroit there is DDOT, which also collaborates with SMART, and in Ann Arbor there is the Ann Arbor Area Transportation Authority.
While there are dedicated public transportation systems throughout Southeastern Michigan, they do not service all of the region. This fact is particularly showcased in the map above; nearly all of the green communities have no or limited access to public transportation. In some areas, like throughout much of Monroe, St. Clair, Livingston and Washtenaw counties, there are no sources of public transportation even offered to community members. While in Wayne, Oakland and Macomb counties access to public transportation is offered, but communities must vote on whether or not to support and utilize the services, such as with the SMART votes (how this service works is detailed here).
Understanding the region’s transit system, or lack there of, is important when reading about the usage of public transportation. When viewing just the numbers it could easily be argued a regional transit system isn’t needed because of the low percentage of users. However, further knowledge on public transportation in Southeastern Michigan shows that there is actually a lack of access, connectivity and education on the economic and community benefits related to public transportation.
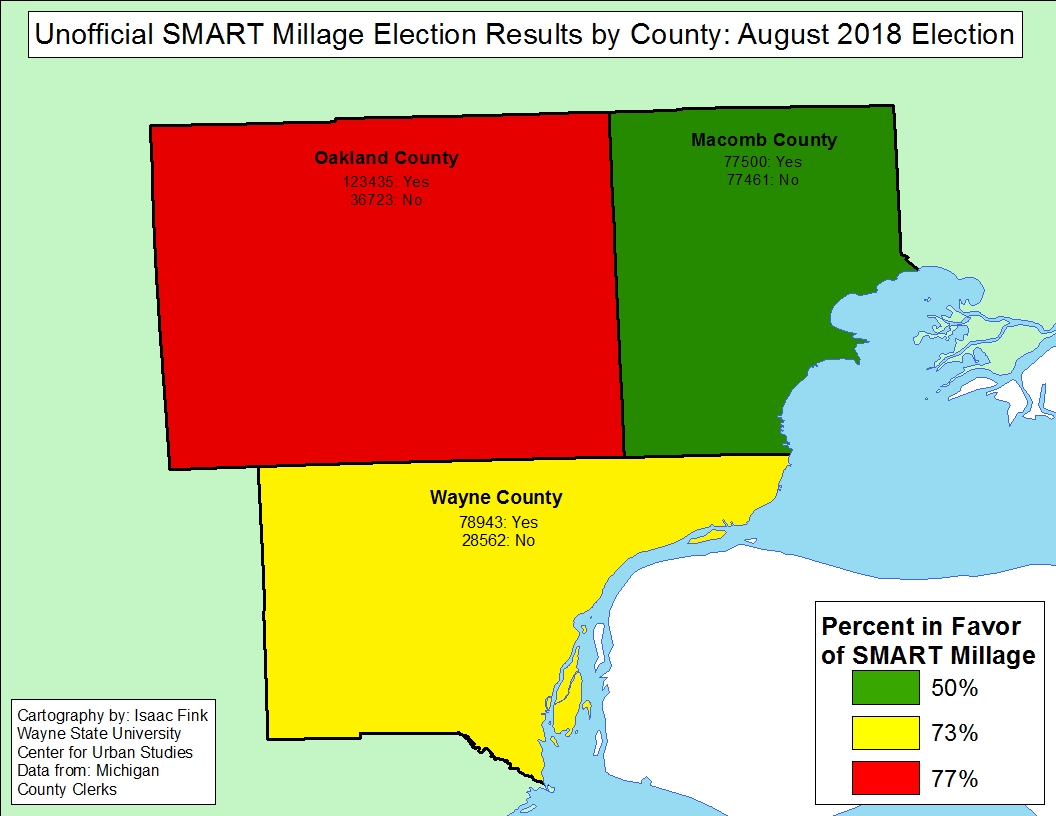
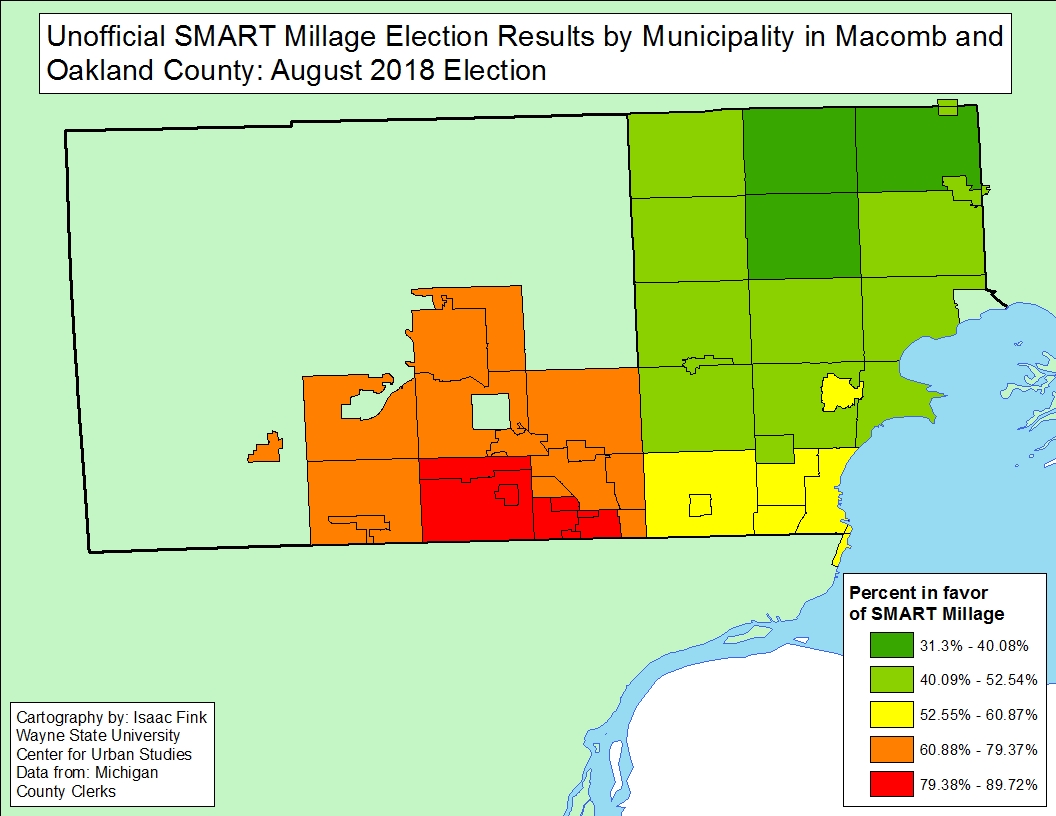
The Suburban Mobility Authority For Regional Transportation (SMART) received a vote of confidence from the tri-county region for its four-year 1 mill millage renewal, which was also a slight increase for communities in Macomb and Oakland counties (the increase request was due to Headlee amendment rollbacks in previous years that brought original 1 mill rate slightly below that). However, even though election results show the SMART millage passed in Macomb County and in areas of Oakland and Wayne counties on Aug. 7, 2018, there were questions if that was really the case. In mid-August the Michigan Taxpayers Alliance requested a partial recount of the Macomb County SMART millage vote because the millage proposal only passed by 39 votes. According to the election results, 77,500 Macomb County voters were in favor of the millage renewal and increase and 77,461 Macomb County voters cast a ballot against the proposal. With a 50 percent passage rate, the group felt a recount was needed to ensure the results were accurate. On Aug. 29 the group stopped the partial recount because it became evident that there would not be enough “no” votes to overturn the originally approved millage approval, according to a Michigan Radio news article.
In Wayne County the SMART millage had a 73 percent passage rate, with 78,943 of the voters in favor of the millage renewal and slight increase. Oakland County had the highest pass rate at 77 percent, with 123,435 of the voters in favor of the proposal and 36,723 of the voters voting against it.
SMART, which is the region’s only existing transportation system outside of the Detroit Department of Transportation’ system, was created in 1967. As is evident by the maps above, the system operates throughout the tri-county region, but not necessarily in every community. Due to the way SMART initiatives can be placed on the county ballots (by individual counties), Macomb County is the only county in which the entire county (50 percent or more) must support a SMART millage in order for it to approved. This is why such a close approval rate for the Aug. 7 millage, and the potential of a recall, were vital for Macomb County, it’s either all or nothing. Unlike Macomb County, Oakland and Wayne counties communities have the option to “opt-out” of supporting the authority. In the second map above, data on approval rates for all Macomb County communities is available, and only partial information is available for Oakland County communities. For the Oakland County communities, these are the “opt-in” communities that approved the SMART proposal.
No data was available for the Wayne County communities through the Wayne County Election’s Office website; the only information available was the pass/fail rate for the millage proposal for the whole county.
In Macomb County, the cities of Grosse Pointe Shores and Eastpointe had the highest passage rates at 61 percent. Ray Township had the lowest approval rate at 31 percent, according to the results. As noted, all the Oakland County communities on the second map above had approval rates above 50 percent, because they “opted in” to use the SMART service. Of those communities, Huntington Woods had the highest approval rate at 90 percent and Walled Lake had the lowest at 70 percent.
While SMART continues to be the only regional transit authority in Southeastern Michigan, this recent election confirms again that the region has a lot of room to grow in providing equal and equitable transportation services throughout the region. If Macomb County voters did not pass the millage request, public transportation in the county would likely have ceased to exist. And, in many parts throughout Oakland and Wayne counties transportation gaps are huge.