First the first time in about 40 years, Democrats will control the upcoming legislative session with Gov. Gretchen Whitmer winning re-election with 54.5 percent of the vote, Democrats winning 20 of the 38 seats in the State Senate and also winning 56 of the 110 seats in the State House of Representatives, according to official Michigan election results.
Prior to the election there was a buzz that Republicans may not only keep control of the legislature but also take control of the Governor seat (and the Secretary of State and Attorney General seats as well). But, that was not the case.
Some facts about the 2022 Gubernatorial Election as it pertains to Michigan, and Southeast Michigan?
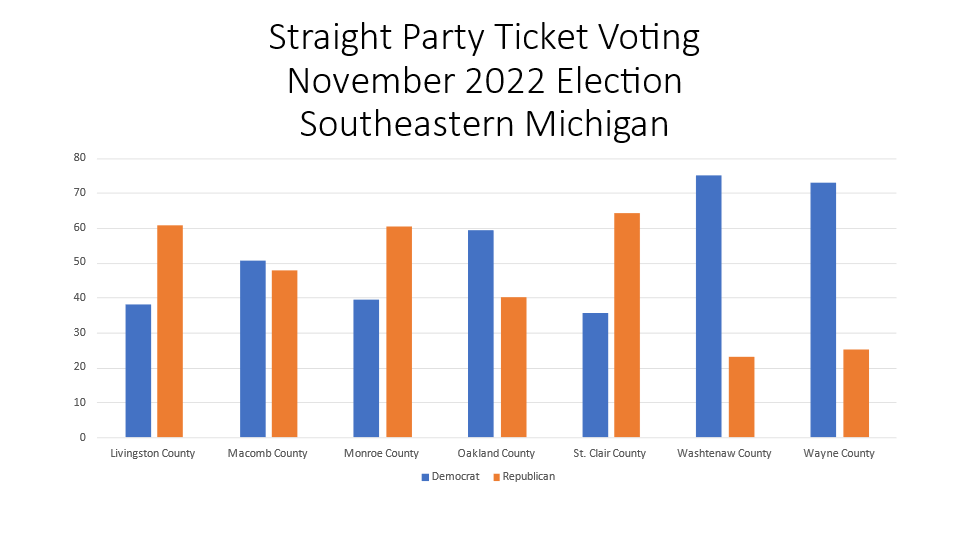
Gov. Whitmer won 54.5 percent of the statewide vote and Republican opponent Tudor Dixon won 43.9 percent of the vote, according to official election results. In Southeastern Michigan four of the seven counties in the region voted in favor of Whitmer; those same counties also had a majority percent of voters vote straight party ticket for Democrats over Republicans. The voter counties in the region that voted in favor of Whitmer, and Democrats in general, were Macomb, Oakland, Washtenaw and Wayne counties.
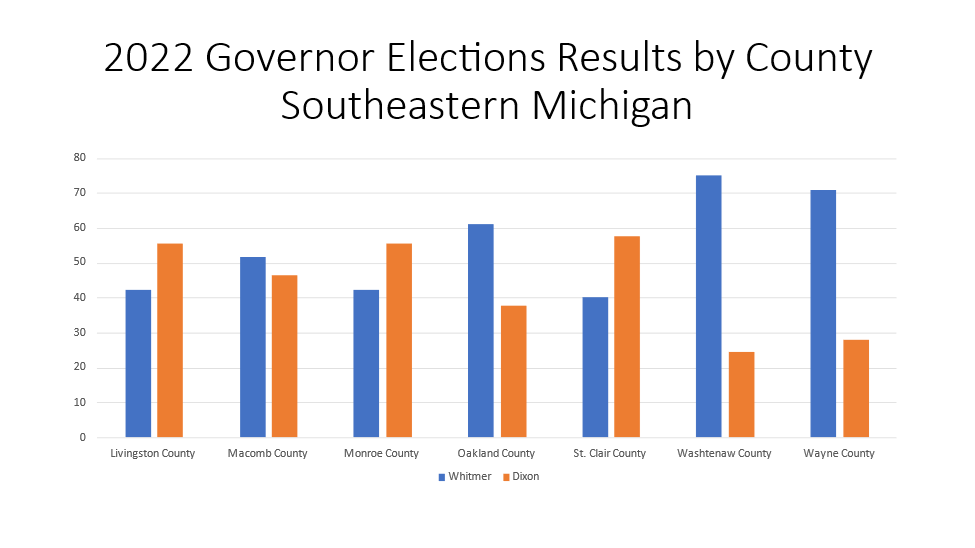
In Macomb County, which Gov. Whitmer also won in 2018 but where former President Donald Trump (R) won in 2016, Gov. Whitmer increased the percentage by which she won from the last time. In 2022 Gov. Whitmer took 51.8 percent of the vote in Macomb County. And, while this county did go blue, it had the lowest percentage of Democrat votes as compared to the other three counties in the region that also went blue. In Wayne County Gov. Whitmer garnered 70.8 percent of the vote and in Oakland County she garnered 61 percent of the vote.
Reports indicate that garnering majority of the votes from Macomb and Oakland counties played key roles in Gov. Whitmer’s win. According to MLive, the last time a candidate won the governor’s election while losing Oakland County was in 1982.
On the other side, of the seven counties in the region it was Livingston County where Dixon garnered the highest percentage of votes at 65.5 percent. In St. Clair County she had 57.8 percent of the vote and in Monroe County she had 55.5 percent of the vote.
St. Clair County had the highest percentage of straight party ticket Republican votes at 64.4 percent.
When examining the results for the State legislature we know that nearly a majority of those who returning to the State legislature are incumbents ( 53 incumbents in the 110 person House of Representatives and 22 incumbents in the 38 person State Senate). Furthermore, of the 53 House of Representatives incumbents, 20 are Democrats and 18 are Republicans. The make up of the 22 State Senate incumbent roster is 11 of whom are Republicans and 11 who are Democrats. Overall though, according to Bridge Michigan, 10 percent of incumbents who ran for re-election this year lost in either the primary or general election. One such incumbent at the Senate level was Mike MacDonald (R-Macomb Township). With the redistricting of legislative seats, MacDonald faced (state legislator) newcomer Veronica Klinefelt (D); Klinefelt garnered 53 percent of the vote and MacDonald garnered 42 percent.
As noted, Macomb County went blue for several state related races, but at the local level the Macomb County Board of Commissioners remains controlled by the Republicans and at the Congressional level a Republican won the race for the new 10th Michigan Congressional District.
In Macomb County, Congressman-elect John James (R) won 48.6 percent of the vote and his opponent Carl Marlinga (D) took 48.4 percent of the vote in Macomb County. For the entire district, which spans into the Rochester area as well, Marlinga won 48.8 percent of the vote.
With the next legislative term ready to begin, agendas and priorities are already being discussed at the national, state and local levels. Key priorities Drawing Detroit will be giving keen attention to in the coming year include climate change topics such as heat islands, flooding, changing water, carbon and temperature levels, electric vehicle fleets and more.