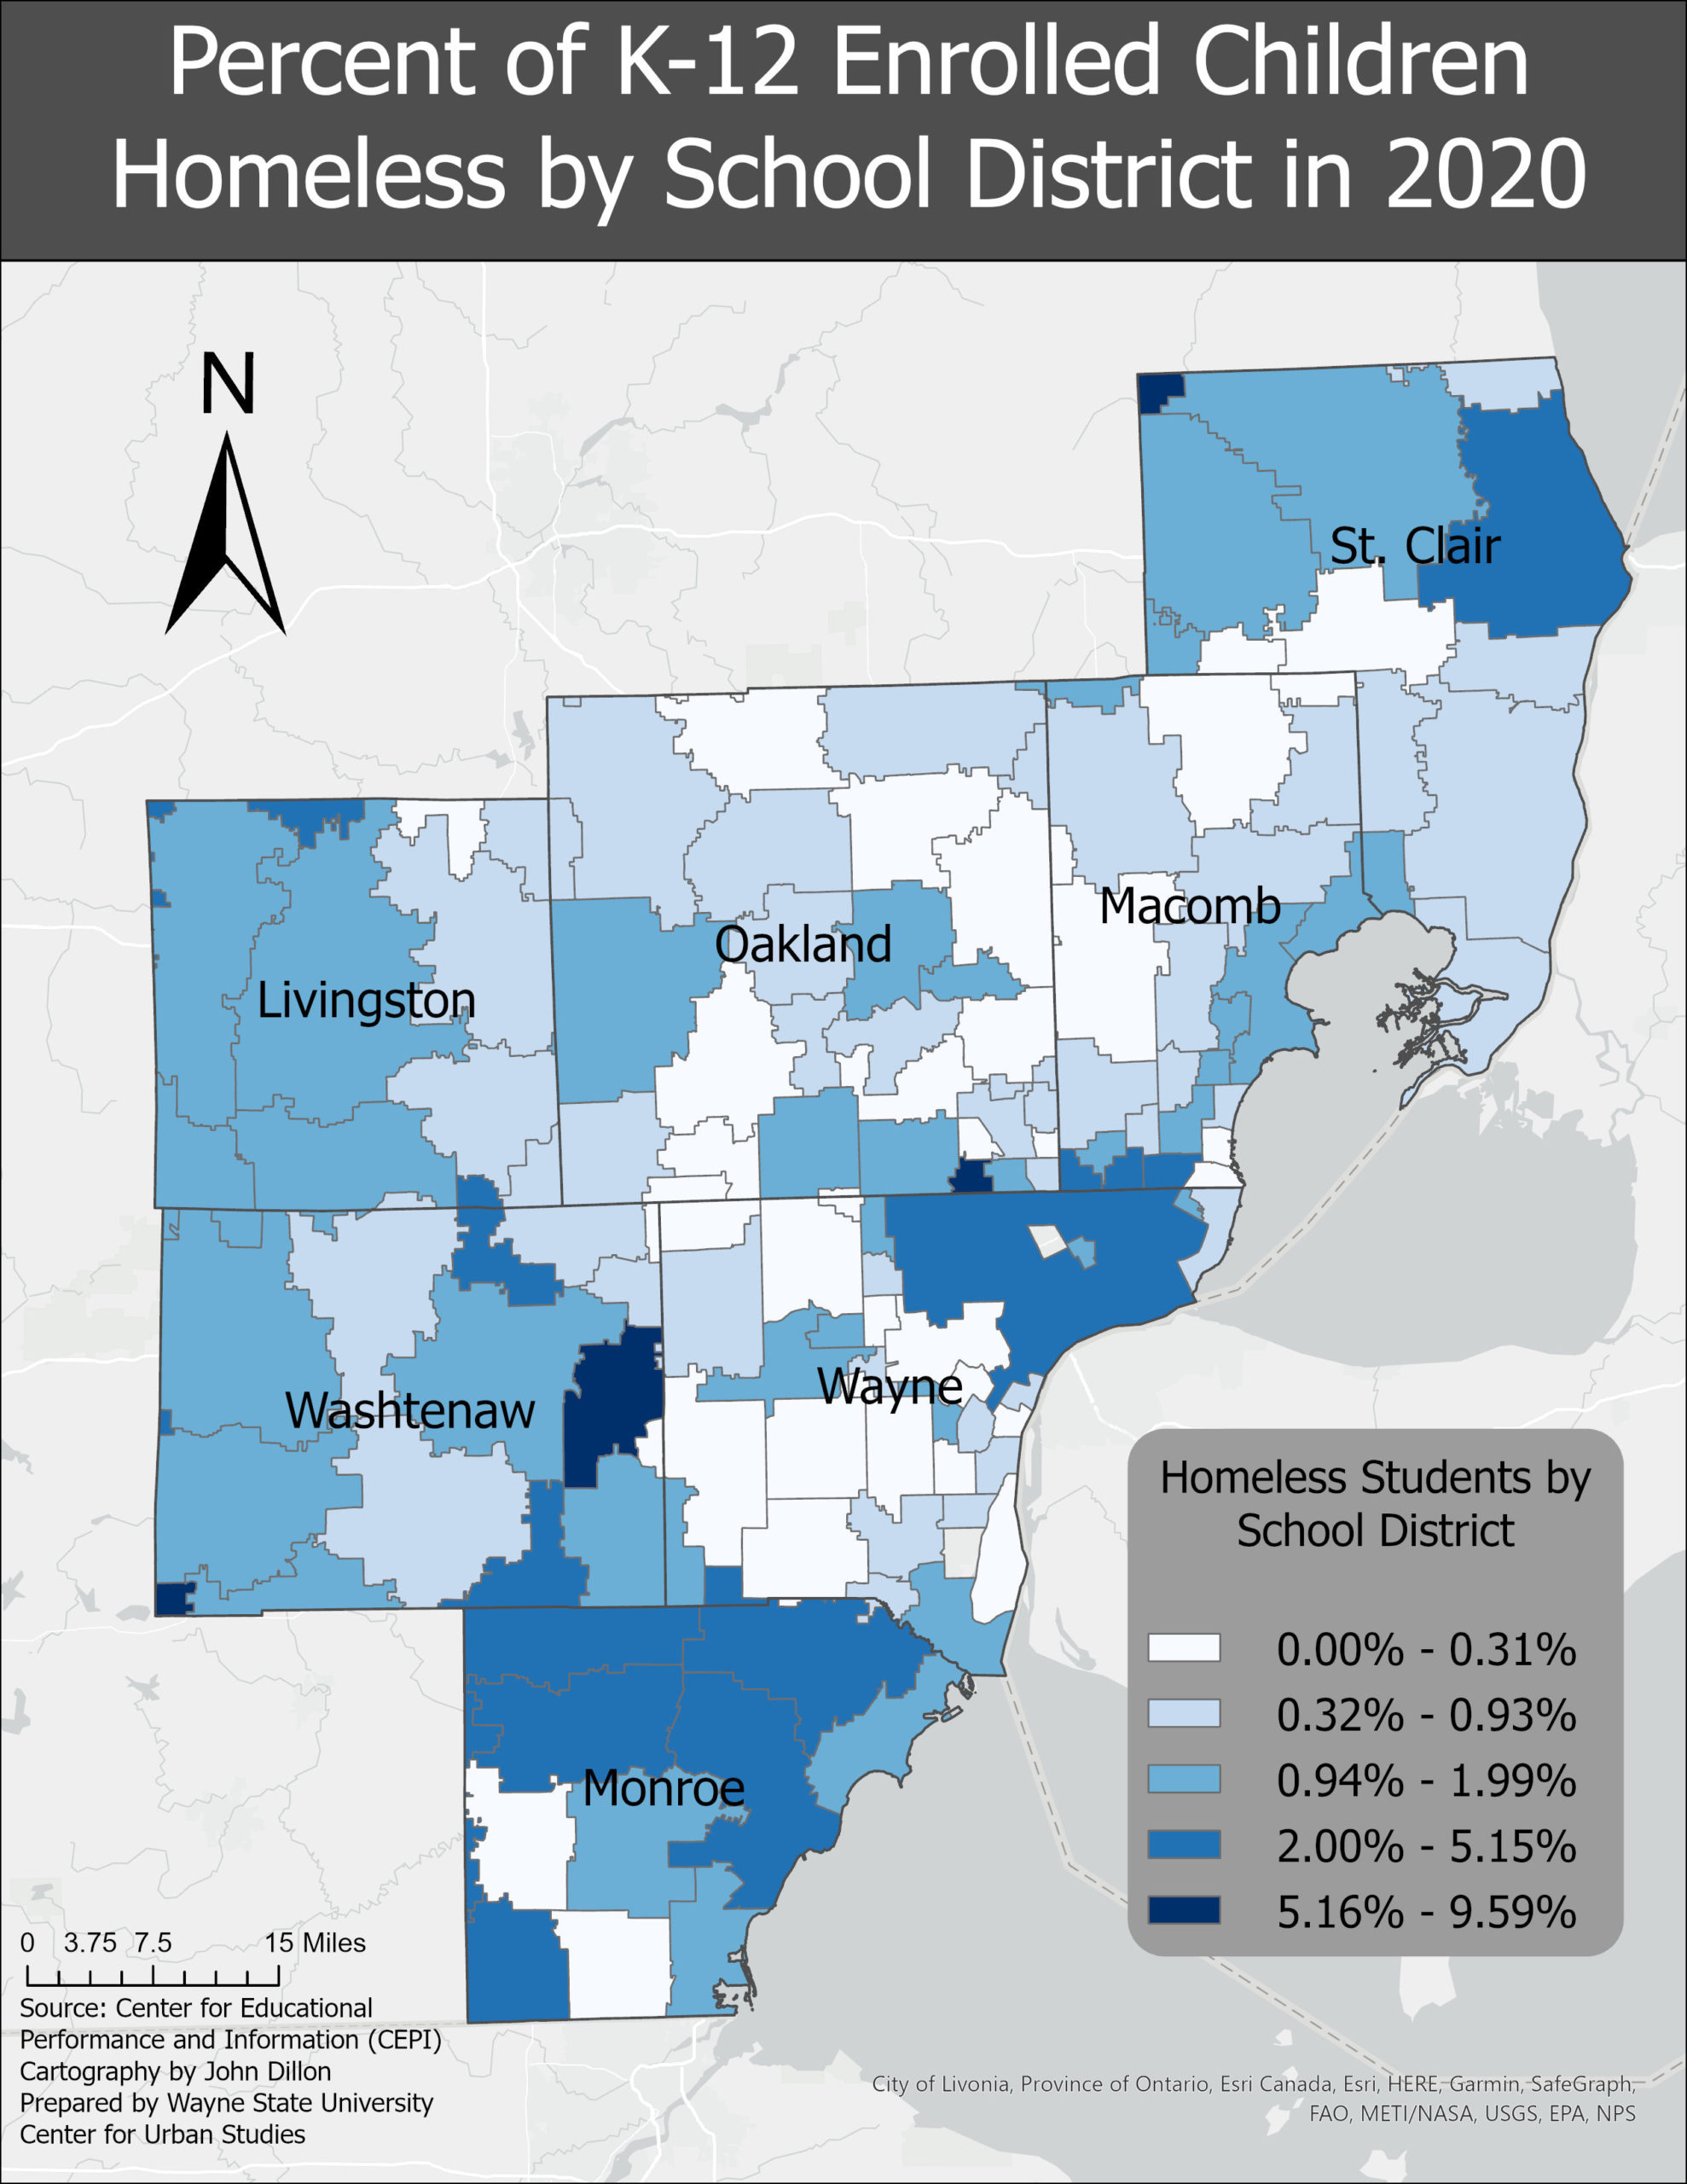
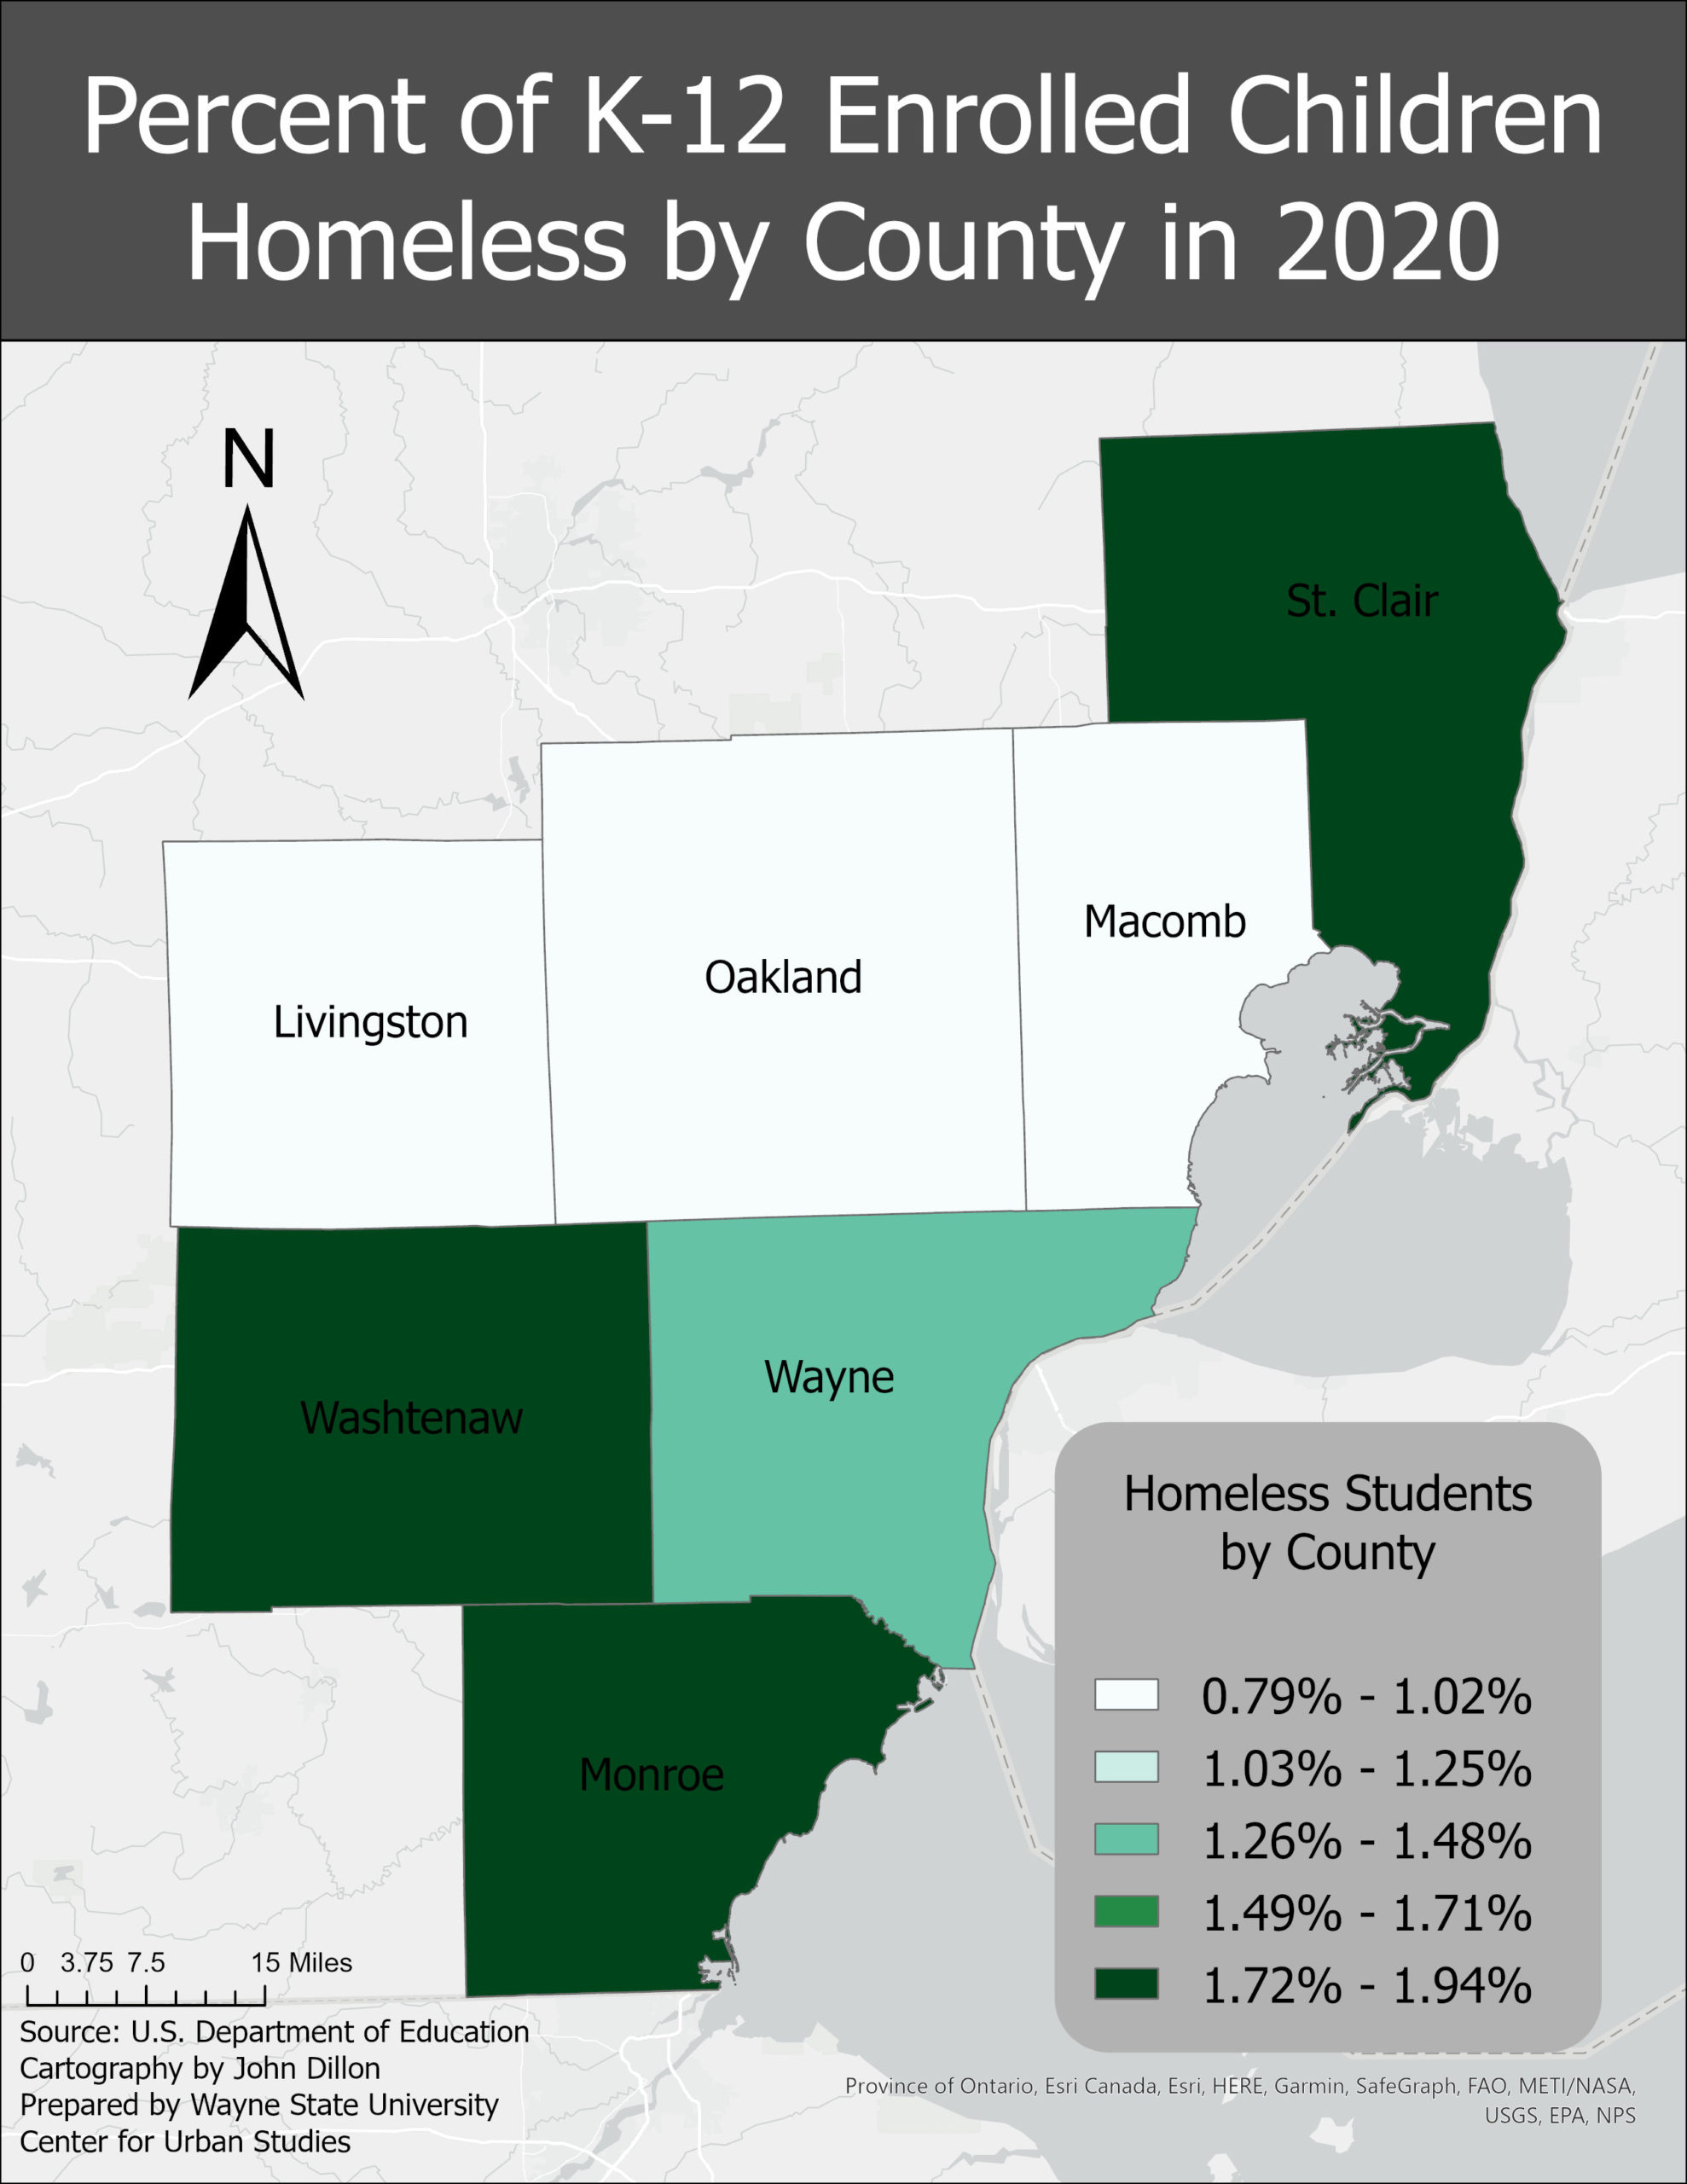
According to the University of Michigan, in more than 40 percent of Michigan’s schools more than 10 percent of students struggle with homelessness during the school year. Furthermore, it is believed that even those numbers are under reported in certain areas, including the City of Detroit. Detroit was estimated to have about a 4 percent homeless student rate for the 2020-21 school year, which was equivalent to about 1,700 students according to the US Department of Education’s Center for Educational Performance and Information. However, as noted, it is believed this number is under reported. While Detroit public schools had the highest total number of students estimated to be affected by homelessness, it was the Ypsilanti School District that had the highest percentage of homeless students in the region. According to the data, the Ypsilanti School District had the highest estimated homelessness rate for the 2020-21 school year at about 10 percent, which was equivalent to about 340 students. Oak Park Public Schools had the second highest percentage of homeless students for the 2020-21 school year at about 9 percent, which was equivalent to more than 340 students.
As shown in the maps above homelessness impacts students throughout the region, but those who live in more urban and/or rural districts are impacted more. While the Center for Educational Performance and Information reports the percentage of estimated homeless students, it does not breakdown the age groups most affected. But the 2022 report from the University of Michigan’s Poverty Solutions Initiatives highlights that most homeless students are teenagers, Black, Native American and/or Hispanic and/or transgender.
This report further breaks down that the percentage of Black, Native American and Hispanic homeless students in Michigan in 2019 was 8 percent, 8 percent and 7 percent, respectively. Additionally, it was reported that about 25 percent of transgender youth in Michigan were homeless, according to the study.
While the data shows there are certain demographics that are more impacted by homelessness than others, it is clear that it impacts thousands upon thousands of students in Michigan—more than 22,000 to be exact. Many of these students are unaccompanied minors who don’t often access homeless shelters, or utilize public services. Policy shifts must occur to not only protect students from homelessness, but also provide greater safety nets for them to access healthcare, nutritional and housing services if they do experience homelessness. This means greater investment into K-12 programs, transitional foster care programs and stronger policies to prevent family homelessness.
In 2021 more than $1.1 billion was reported in adult-use marijuana sales in the State of Michigan, and of that more than $42.2 million is being disbursed to municipalities and counties, $49.3 million is being sent to the School Aid Fund for K-12 education and another $49.3 million is being sent to the Michigan Transportation Fund. These revenue sales occurred in the 374 dispensaries licensed in the State of Michigan, which are spread out across 53 counties. In total, there was $172 million available for distribution from the fund set up by the Michigan Regulation and Taxation Marijuana Act, and more than $111 million was collected from the 10% adult-use marijuana excise tax.
Of the funds earned through the excise tax, $20 million is to be provided annually to one or more clinical trials that research the efficacy of marihuana in treating the medical conditions of United States armed services veterans and preventing veteran suicide. Once these funds are dispersed, and administration of the regulation department is paid for, the unexpended balances must be allocated as follows: •15% to municipalities in which a marihuana retail store or a marihuana microbusiness is located, allocated in proportion to the number of marihuana retail stores and marihuana microbusinesses within the municipality;
•15% to counties in which a marihuana retail store or a marihuana microbusiness is located, allocated in proportion to the number of marihuana retail stores and marihuana microbusinesses within the county; •35% to the school aid fund to be used for K-12 education;
•35% to the Michigan transportation fund to be used for the repair and maintenance of roads and bridges.
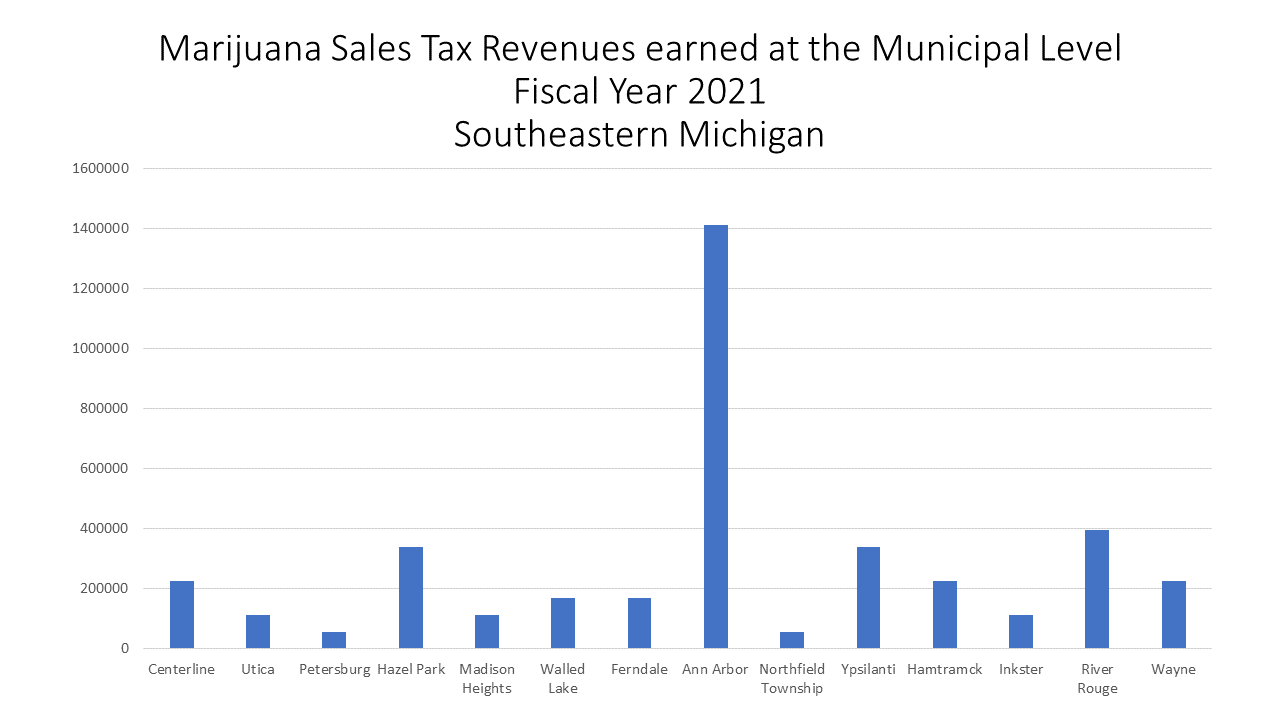
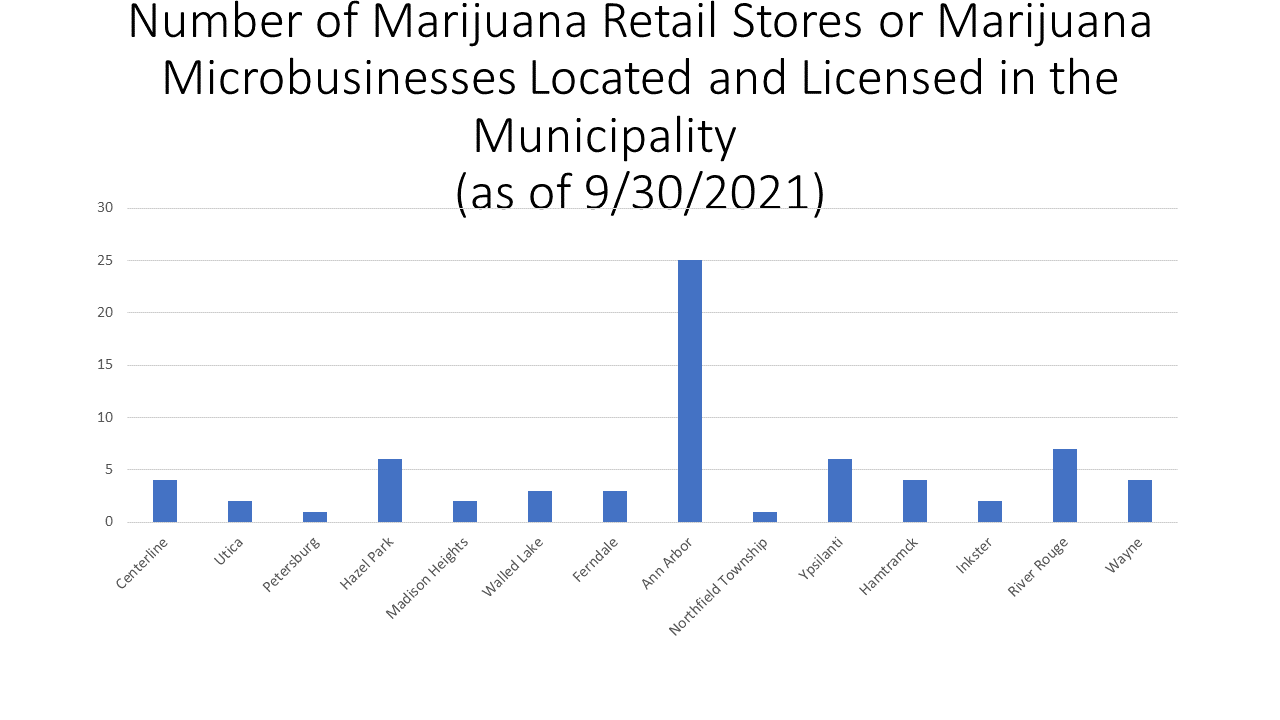
For 2021, each eligible municipality and county will receive more than $56,400 for every licensed retail store and microbusiness located within its jurisdiction.
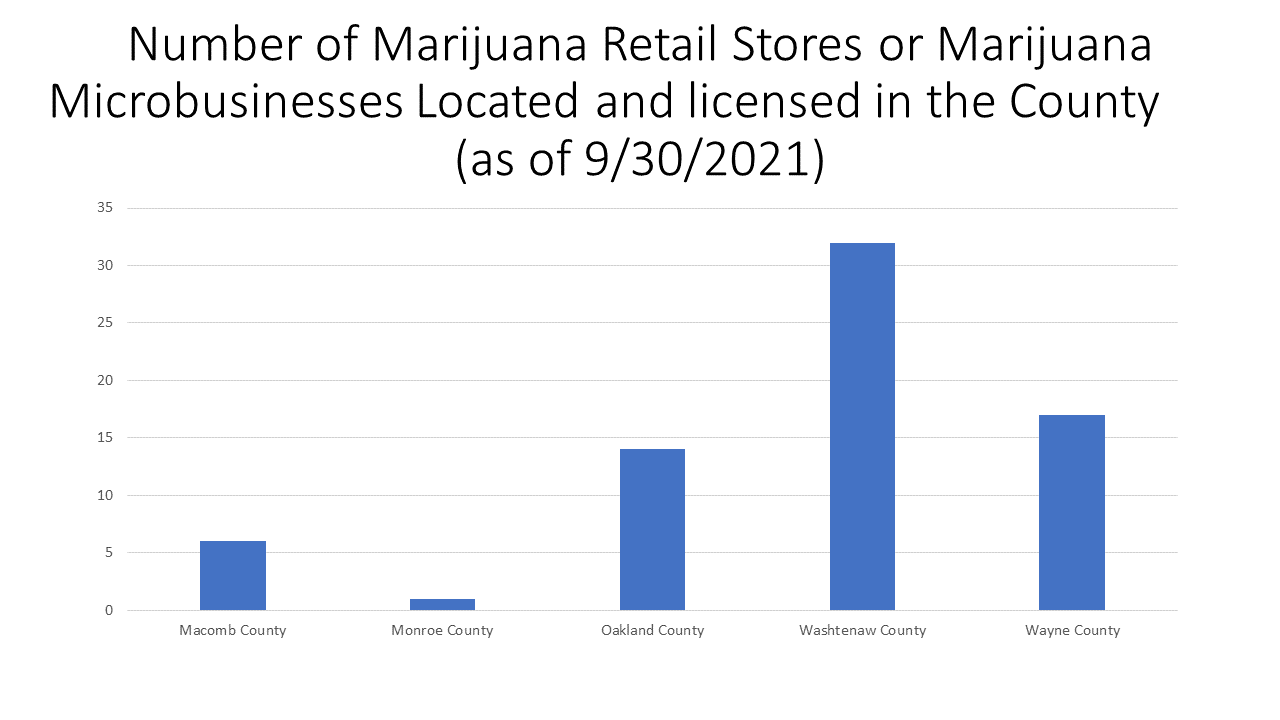
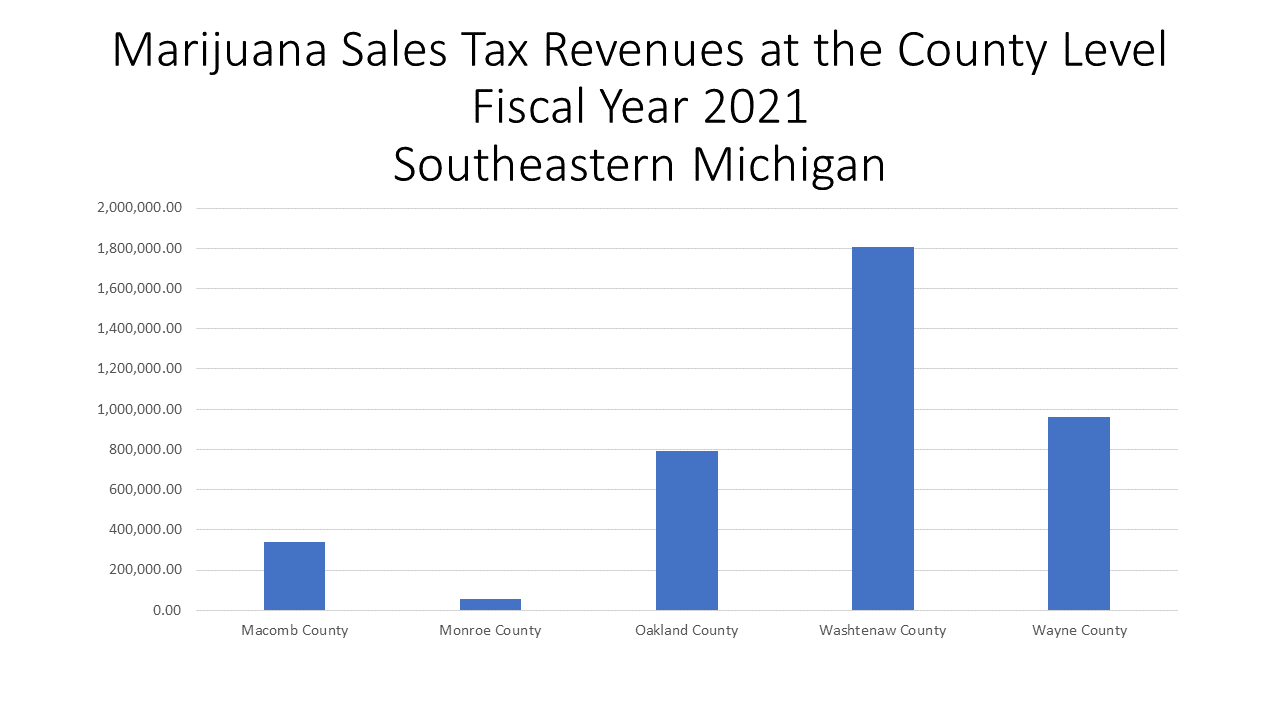
In the seven county region for Southeastern Michigan, five of the seven counties have licensed marijuana retail stores and/or microbusinesses, with Washtenaw County having the highest number of licenses at 32. Since Washtenaw County has the highest number of licenses it is also receiving the most amount of tax revenue. Washtenaw County, as the entity itself, will be receive about $1.8 million, according to the Michigan Department of Treasury. Wayne County will receive about $960,000, and Monroe County will receive the lowest amount at about $56,500. Monroe County has one licensed marijuana business and Wayne County has 17.
As noted, Washtenaw County has the highest number of licenses and will receive the highest amount of revenue payments, this is because Ann Arbor alone has 25 licensed marijuana retail stores and/or microbusinesses. Ann Arbor, according to the Department of Treasury, will receive about $1.4 million in revenue payments because of these businesses and the distribution formula set by the Michigan Regulation and Taxation Marijuana Act.
At the city/township/village level, River Rouge in Wayne County has the second highest number of licenses in the region at 7. River Rouge is set to receive about $395,000 in revenue funds through the tax.
While municipalities across the state are earning additional revenues through the marijuana excise tax from recreational sales, up until recently Detroit was one notable community that did not. However, in April of 2022 the Detroit City Council approved medicinal marijuana to be sold within the city limits through the adoption of a recreational ordinance.
Pothole season is upon us, and so is an even more blatant reminder of the condition of Michigan’s roads. With the amount of moisture Michigan receives—from rain to sleet to snow– coupled with cold temperatures, that often rise to the level of thawing out what is frozen only to drop to below freezing points again, and again, it is no surprise that Michigan is a pothole haven. So, as the snow for winter begins to disappear for one of the last times of the winter, Michigan drivers are again hitting the roads—quite literally—harder than before.
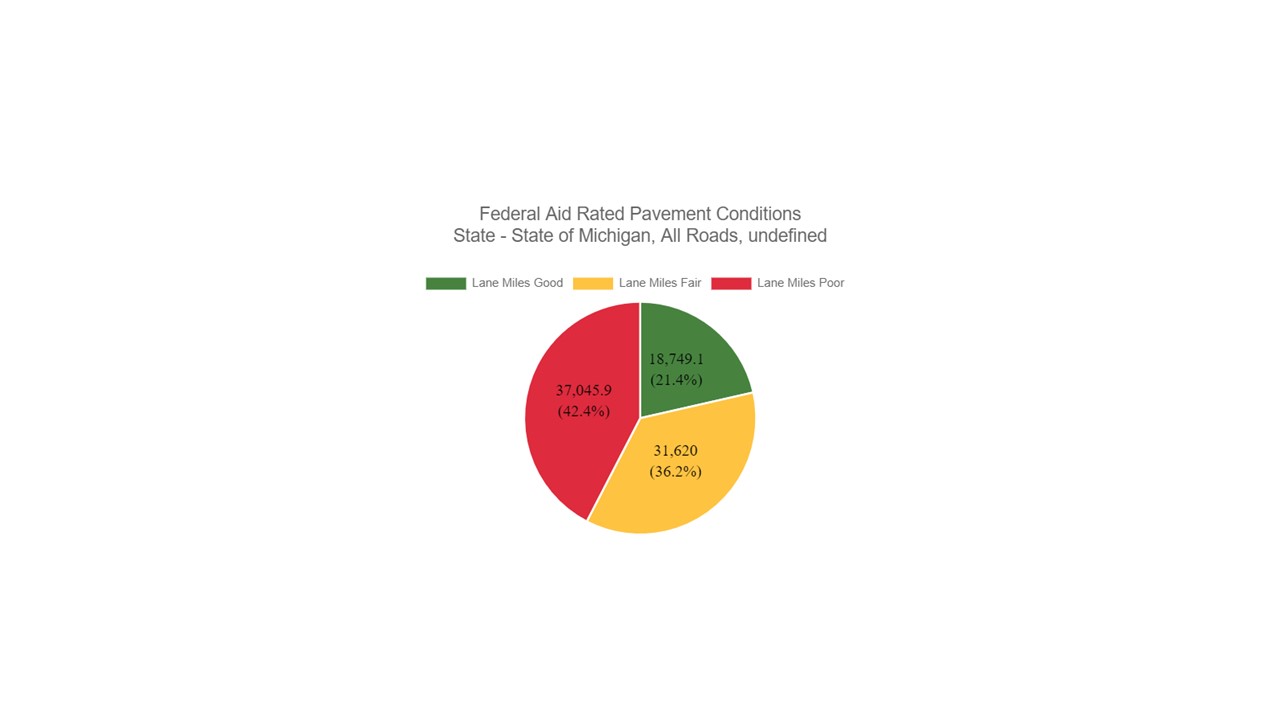
While data for 2020 and 2021 was unavailable from Michigan’s Transportation Asset Management Council at the county and city level, data for the State of Michigan in 2019-2020 shows that nearly half of Michigan’s roads were considered in poor condition. According to the data, 42.4 percent of the 87,415 miles in federal aid rated miles in Michigan were considered to be in poor condition, this was equivalent to 37,046 poor condition miles. Additionally, 36.2 percent of Michigan’s rated roads were considered to be in fair condition and 21.4 percent were considered to be in good condition. The percentage of roads considered to be in poor condition increased from the previous year (40 percent) while the percentage of roads in fair condition decreased. However, the percentage of roads considered to be in good condition remained the same 21.4.
Classification of road conditions defined by the Michigan Transportation Asset Management Council based on bin ranges of PASER scores and similarities in defects and treatment options. Good roads have PASER scores of 8, 9, or 10, have very few defects, and require minimal maintenance. Fair roads have PASER scores of 5, 6, or 7, have good structural support but a deteriorating surface, and can be maintained with CPM treatments. Poor roads have PASER scores of 1, 2, 3, or 4, exhibit evidence that the underlying structure is failing, such as alligator cracking and rutting. These roads must be rehabilitated with treatments like heavy overlay, crush and shape, or total reconstruction.
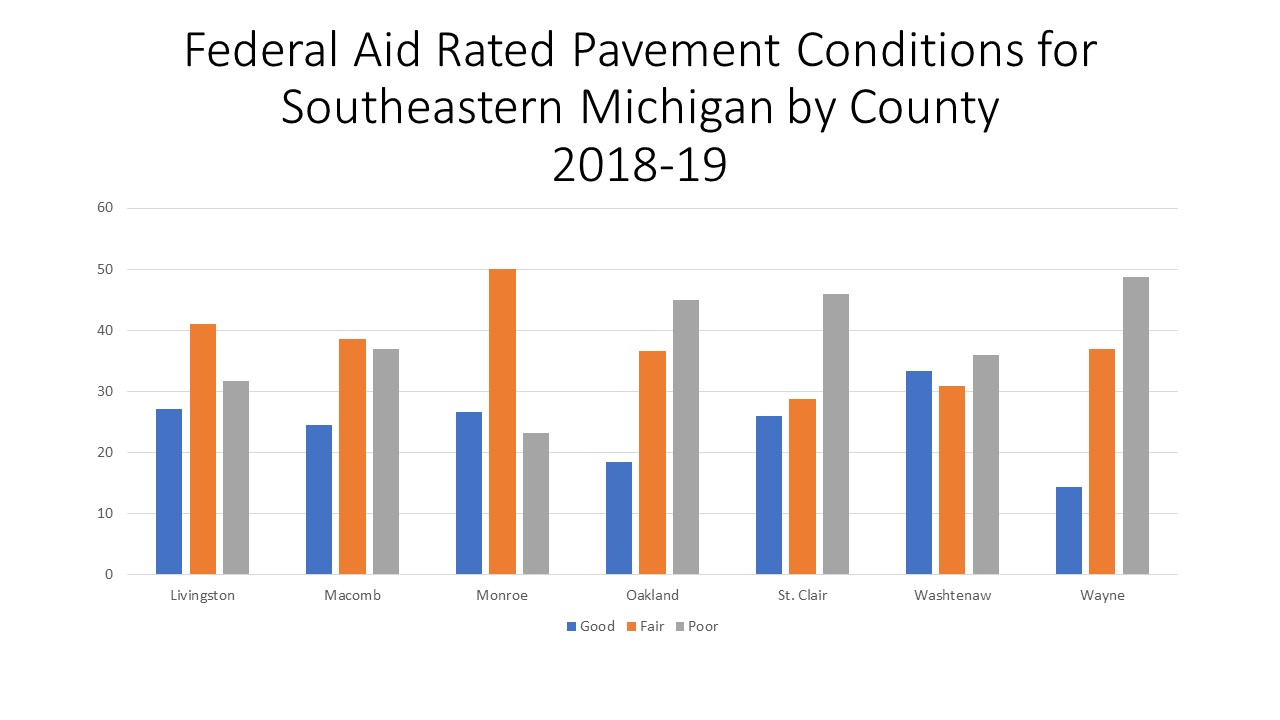
Just as we know almost majority of the roads in Michigan are in poor condition, this is similar for several counties in Southeastern Michigan. According to the most recent data (2018-19), four of the seven counties in Southeastern Michigan had a higher percentage of roads in poor condition than in fair or good condition. Wayne County had the highest percentage of roads in poor condition at 48.7 percent, followed by St. Clair County where 45.9 percent of the roads were in poor condition and then Oakland County where 44.9 percent of the roads were in poor condition. Washtenaw County was the only other county in the region where there was a higher percentage of roads in poor condition than in fair or good.
Livingston, Macomb and Monroe counties all had a higher percentage of roads in fair condition than in good or poor condition. Monroe County had the highest percentage of roads in fair condition at 50.1 percent, followed by Livingston County (41%) and Macomb County (38.6%). The percentage of roads in good condition was the lowest amongst the three categories for each county in the region. It was Washtenaw County though that had the highest percentage of roads in good condition at 33.3 percent; Wayne County had the lowest percentage of roads in good condition at 14.4 percent.
While weather certainly plays a role in the condition of Michigan’s roads, along with use and vehicle weight, funding the maintenance of Michigan’s roads is often the biggest decider in the State’s pavement conditions. Road funding in Michigan doesn’t come from one dedicated source. Rather, there is federal funding provided by the Federal Highway Administration Highway Trust Fund, state funding provided by state fuel taxes, vehicle registration fees, income taxes, additional appropriations decided on by the Legislature, and local funding provided by general tax revenue and additional road millages. All of these factors affect when and if a road is patched, paved or re-constructed, ultimately impacting the roadway’s condition and longevity.
While infrastructure bills, from the federal to the state to the local level continue to claim to push additional funding toward fixing the roads, forecasts from Michigan’s Transportation Asset Management Council show that by 2032 only 20 percent of Michigan’s roads may be in good condition, 34 percent may be in fair condition and 46 percenter may be in poor condition.
The time is now to begin evaluating, and re-evaluating how long-term infrastructure funding can be adjusted to better ensure Michigan’s roads end up in better condition than what they currently are in the future.
According to recent data compiled by Bloomberg, Michigan’s economy has out-performed every other state’s in the last year based on equally weighted measures of employment, personal income, home prices, mortgage delinquency, state tax revenue and the stock market performance of its publicly-traded companies. One example of this is how the number of workers employed in Michigan has risen faster than the average number US of workers employed in the last year. Since April of 2020 the number of non-farm payrolls increased by 25 percent, according to the Bureau of Labor Statistics; the US average increased by 14.3 percent and Michigan lead every state in the nation with that 25 percent increase. Another example is how the bond ratings in the state have stood out compared to other state’s. Michigan’s AA-rated bonds returned 5.6 percent (income plus appreciation) since April 2020, outperforming neighboring Wisconsin (4.3%), Indiana (4.7%) and Ohio (4.7%) as well as the entire municipal market (5.3%), according to data compiled by Bloomberg. Additionally, bonds issued by the Michigan Strategic Fund returned a 15 percent interest rate and bonds issued by Detroit Downtown Development project returned a 14 percent interest rate, according to data compiled by Bloomberg. Closer inspection of this would probably also indicate that these bonds are carrying higher than market rates because of Detroit’s past financial challenges.
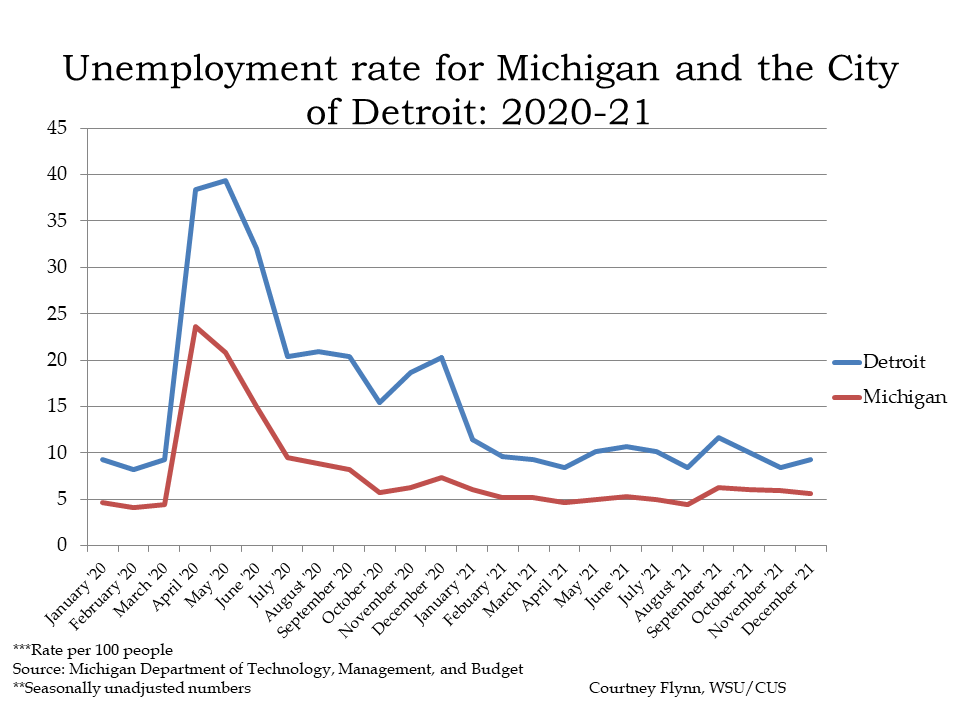
Another example highlighted by Bloomberg is how Michigan’s unemployment rate has recovered since the pandemic. The chart below shows the unemployment rates for Michigan and Detroit since January of 2020.
In December of 2021 the unemployment rate for the State of Michigan declined to 5.6 percent from the 5.9 percent it was reported at for November of 2021. In April of 2020, when Michigan first began experiencing the effects of the pandemic, the unemployment rate was reported at 23.6 percent.
For the City of Detroit, the unemployment rate for December of 2021 was 9.3 percent, an increase from the 8.4 percent it was reported at the month prior. When the pandemic first began Detroit’s unemployment rate was 38.4 percent and in December of 2020 the Detroit unemployment rate was 20.3 percent, meaning there has been a significant decrease in the local unemployment rate in the last nearly two years.
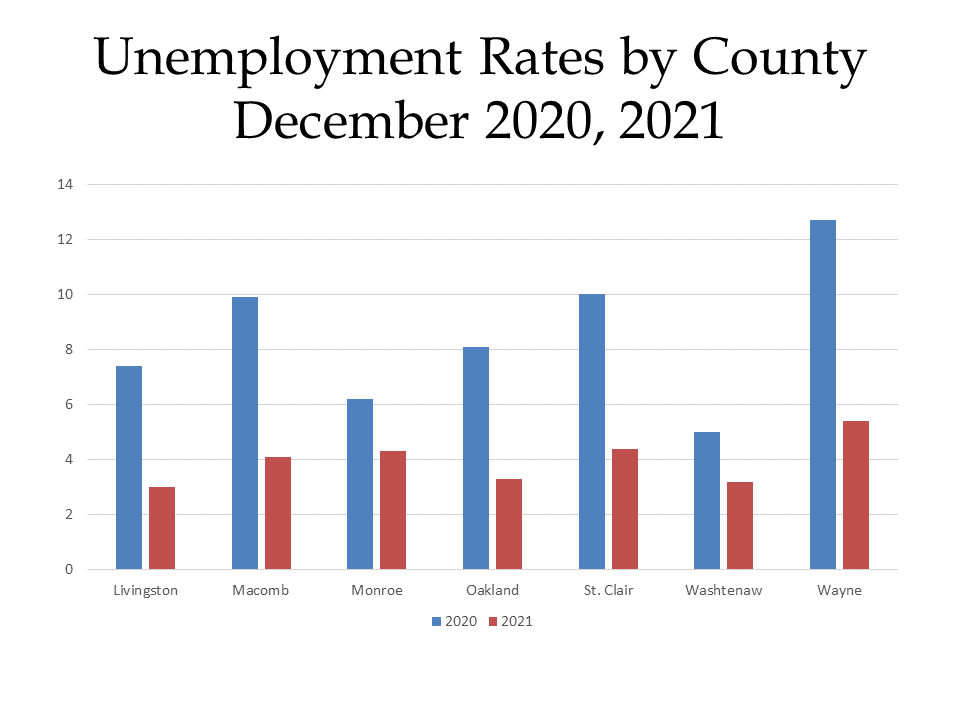
Digging deeper into the regional unemployment data, we see that each county in Southeastern Michigan had a lower unemployment rate in December of 2021 than December of 2020. Wayne County had the largest decrease over that year with a 7.3 unemployment rate decline. In December of 2020 Wayne County had a 12.7 percent unemployment rate and in December of 2021 it was reported at 5.4 percent. However, despite having the largest decline in its unemployment rate, Wayne County still reported the highest unemployment rate of the region in December of 2021 at 5.4 percent; Livingston County had the lowest at 3 percent.
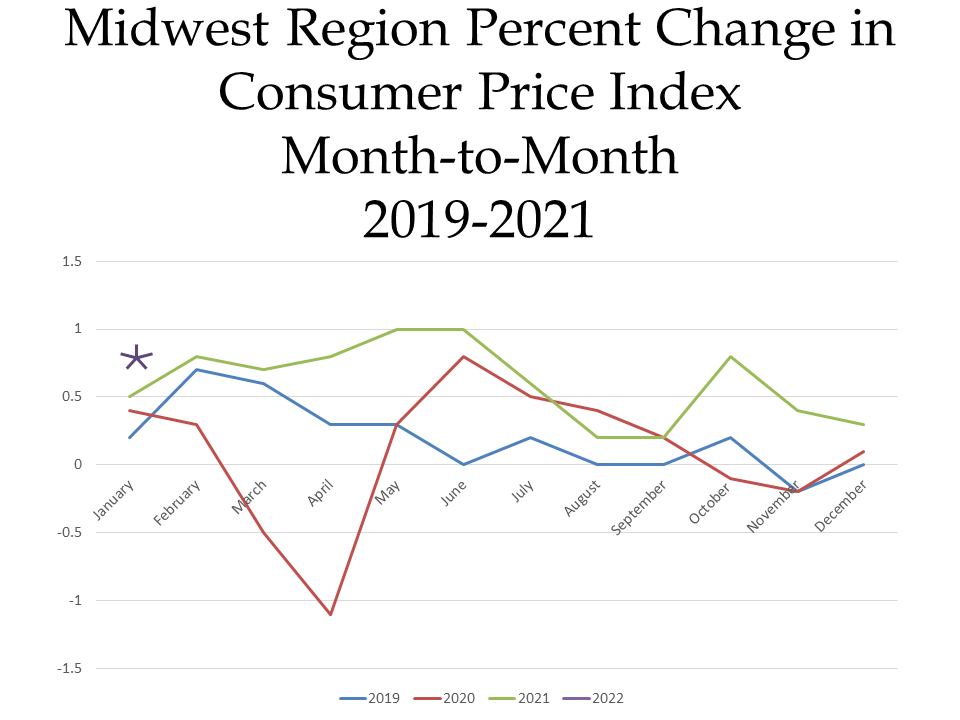
The charts below show the percent changes in the Consumer Price Index (CPI) on a month-to-month basis and a year-to-year basis for each month in years 2019, 2020 and 2021 in the Midwest Region. The CPI is a measure that examines the weighted average of prices of consumer goods and services, such as transportation, food, energy, housing and medical care. It is calculated by taking price changes for each item in the predetermined group of goods and averaging them.
The first chart below highlights how the CPI changed on a month-to-month basis between 2019 and 2021. Currently in 2021, the region’s prices were up 0.8 percent in January, with higher prices for new and use motor vehicles (up 1.3 percent), household furnishings and operations (up 1.7 percent) and apparel (up 3.3 percent) being large contributors to the increase, without considering food and energy prices. Additionally, food prices increased 1.9 percent. The month-to-month changes reflect how pricing has changed one month to the next while the year-to-year CPI index reflects such changes on an annual basis, while considering each month.
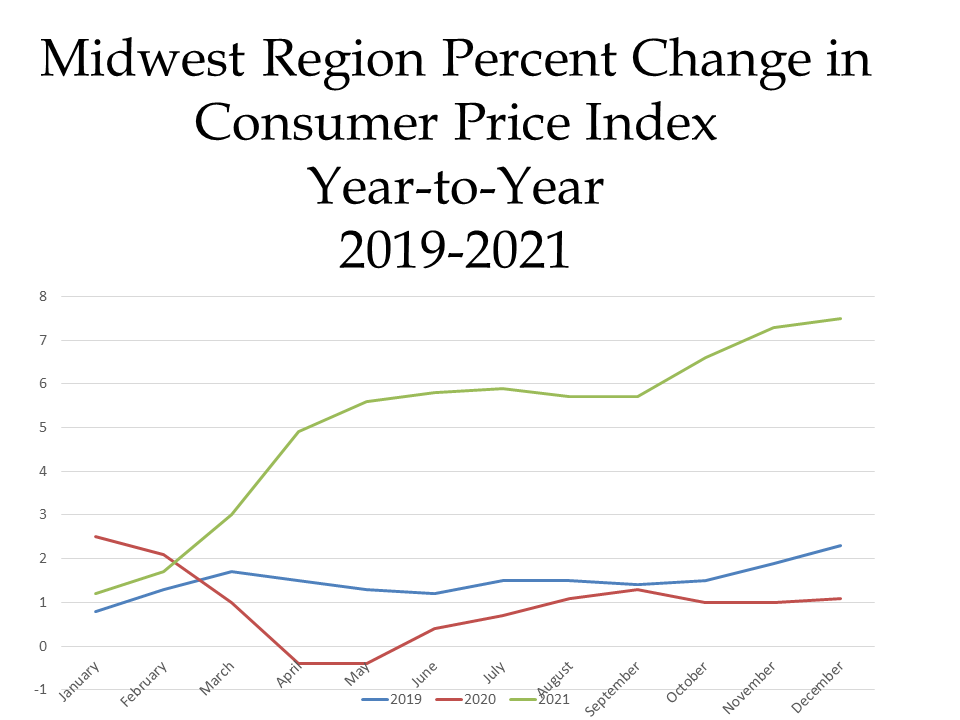
When examining the second chart, which shows how prices changed on a year-to-year basis, we see how prices continued to increase in 2021, with the December year-to-year CPI being the highest increase shown below. When examining both the month-to-month and year-to-year comparisons, the year-to-year data gives a clearer picture on just how much pries have increased in the last year. In December of 2021 the CPI was reported to be 7.5 percent above what it was the year prior. Contributing factors to the continued increase in the CPI include food prices increasing 8 percent over the last year and energy prices increasing 25 percent over the last year. Additionally, new and used motor vehicles increased 24.8 percent, shelter increased 4.6 percent and household furnishings and operations increased 11.6 percent.
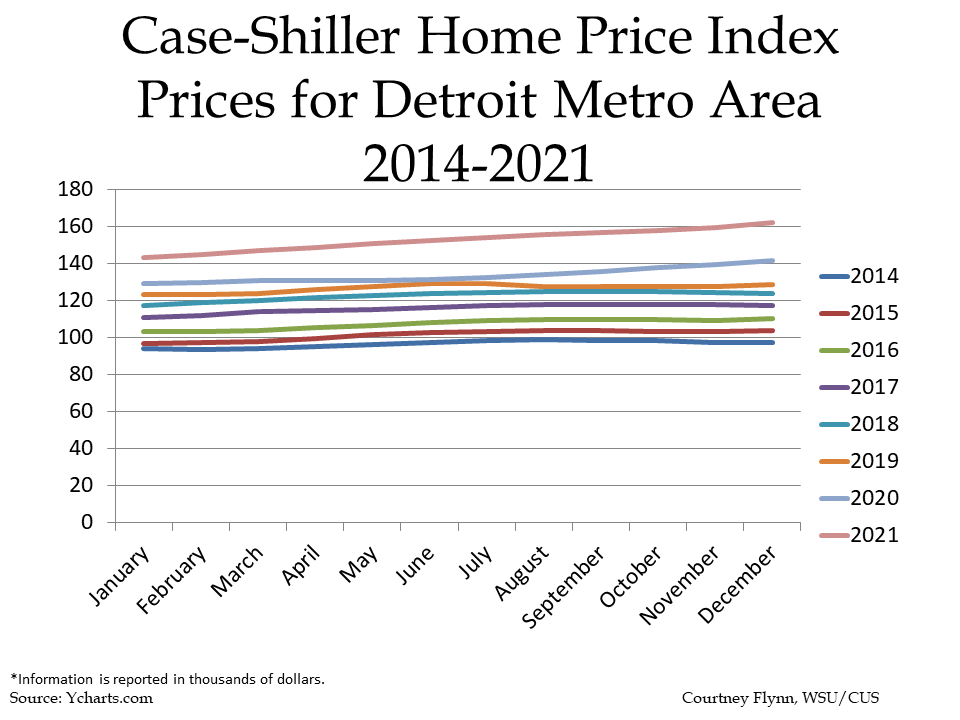
While Michigan’s economy may be recovering since COVID first hit, the State’s housing market is not exempt for the increasing prices being witness across the country. Home prices continue to increase, as has already been indicated by the increasing CPI. In Metro Detroit, according to the Case-Shiller Home Price Index, the average price of single-family dwellings sold was $161,880 in December of 2021; this was $2,290 higher than the average family dwelling price in November. The December 2021 price was an increase of $20,220 from December of 2020 and $64,900 from December of 2014.
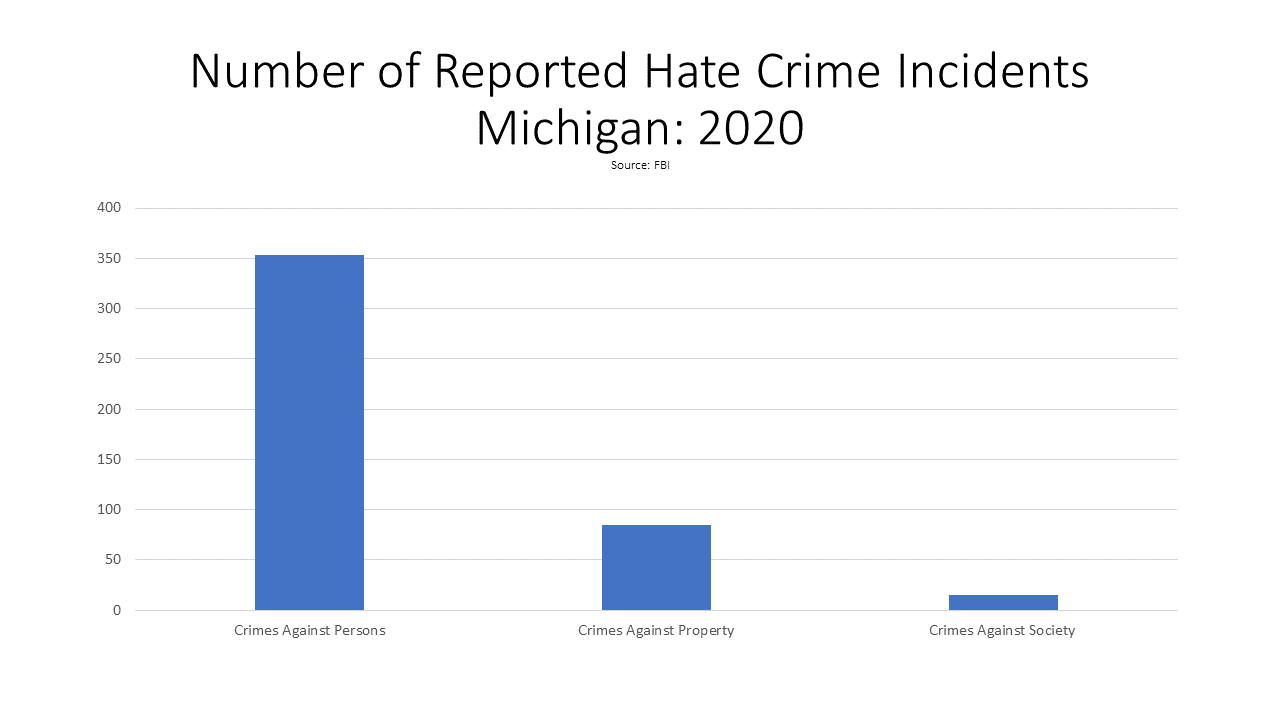
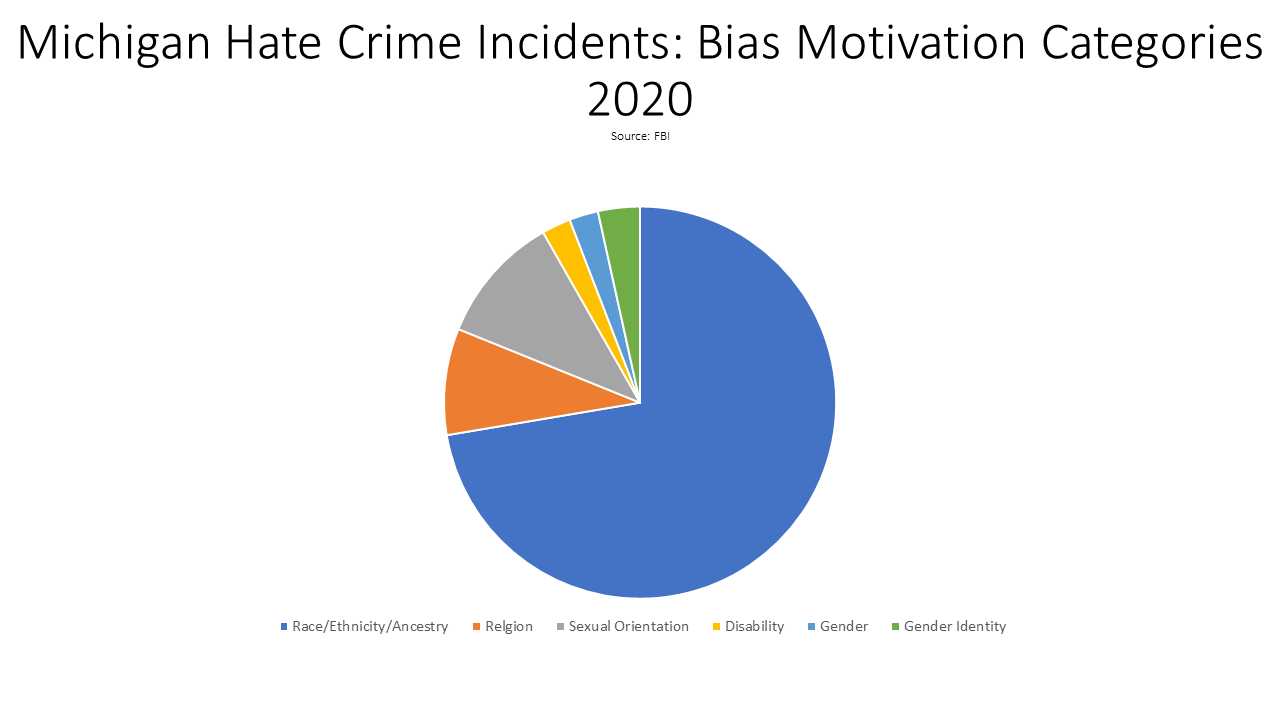
In 2020 the Federal Bureau of Investigation (FBI) reported 453 hate crimes in the State of Michigan, an increase from the 434 hate crimes reported the year prior (Chart 1). According to the FBI, hate crimes are defined as a crime motivated by bias against race, color, religion, national origin, sexual orientation, gender, gender identity or disability. In 2020, majority of the hate crimes reported were motivated by race/ethnicity/ancestry (77%). Sexual orientation was the second highest bias that motivated a hate crime at 11 percent, followed by religion at 9 percent in 2020 (Chart 2).
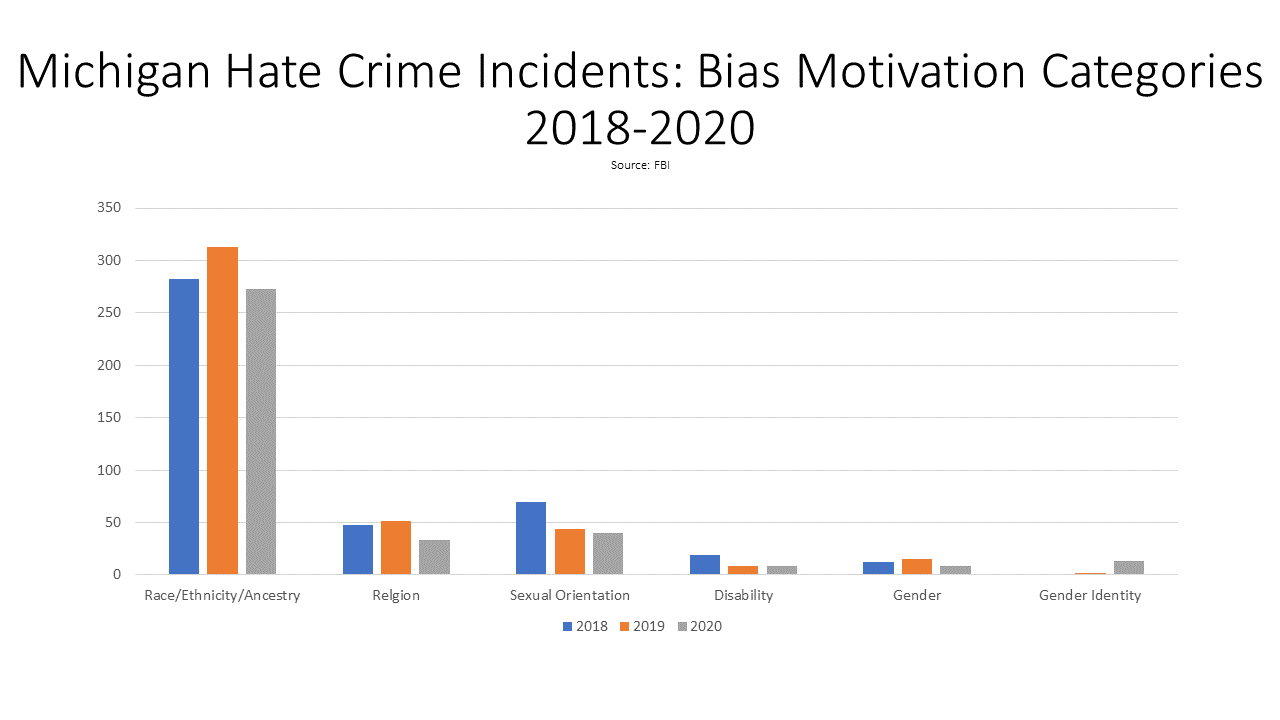
In 2018 and 2019, race/ethnicity/ancestry were also the bias motivator category with the highest number of reported at hate crimes. In 2018 there were 282 hate crimes motivated by race/ethnicity/ancestry, in 2019 there were 313 hate crimes motivated by race/ethnicity/ancestry and in 2020 there were 273 hate crimes motivated by race/ethnicity/ancestry (Chart 3).
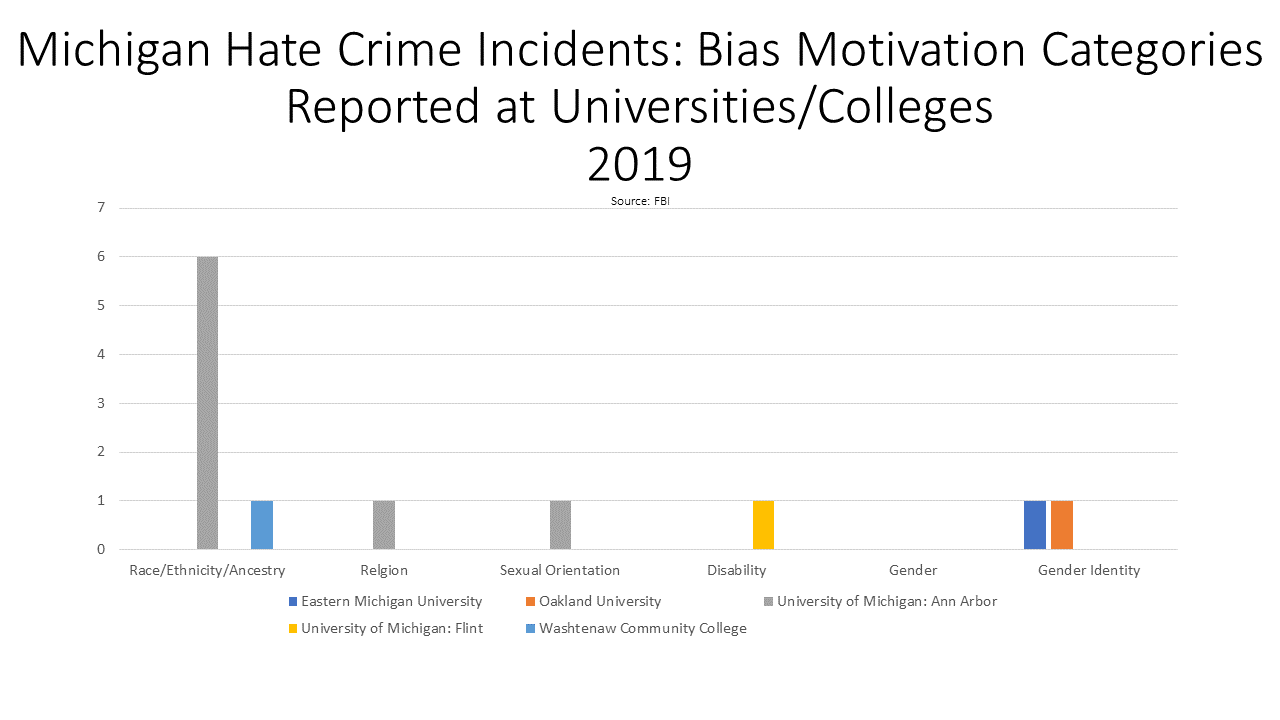
The FBI has not yet released the agencies/locations where hate crimes were reported for 2020, but in 2019 the data showed that some of the reported hate crimes occurred at Eastern Michigan University, Oakland University, University of Michigan (Ann Arbor and Flint) and Washtenaw Community College. University of Michigan Ann Arbor had the highest number of reported hate crimes in 2019 at 7, with the race/ethnicity/ancestry being the highest bias motivator. Washtenaw Community College also had a reported hate crime under that bias motivator category. Gender identity as a bias motivator with the second highest number of reported incidents at 2, with Eastern Michigan University and Oakland University each having a reported incident.
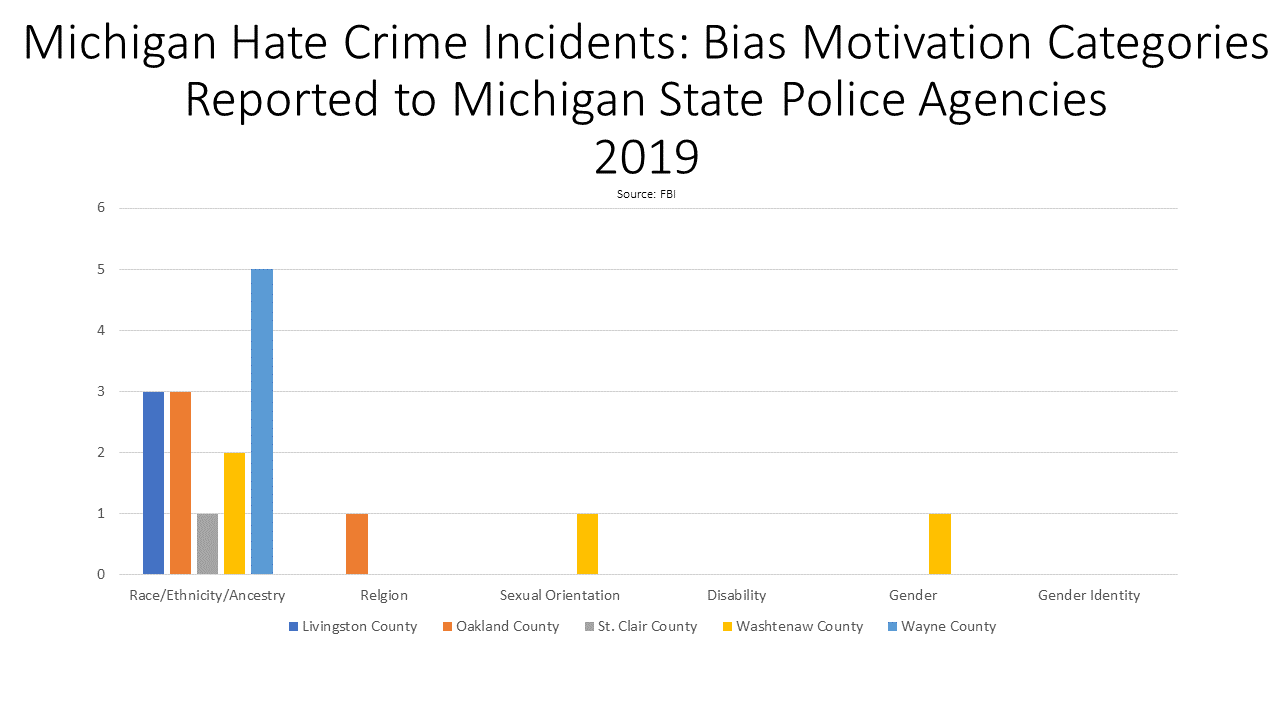
When examining the State Police agencies by county, Wayne County had the highest number of reported hate crime incidents at 5, with the race/ancestry/ethnicity bias motivator category being the highest and only category in which hate crimes were reported under. The Wayne County State Police agency reported 5 race/ancestry/ethnicity motivated hate crimes. Of the seven counties in Southeastern Michigan only Livingston, Oakland, St. Clair, Washtenaw and Wayne reported hate crimes out of their respective State Police agencies. All these counties, except for Oakland and Washtenaw counties only had hate crimes reported under the race/ancestry/ethnicity bias motivation category. The State Police agency located in Oakland County also reported a hate crime under the religion category in 2019, and the Washtenaw County State Police agency also reported hate crimes under both the sexual orientation and gender categories.
Those who believe they are the victim of a hate crime or believe they have witnessed a hate crime should dial 911 in an emergency situation. Individuals can also report the crime to their local police department and then follow up with the report with a tip to the Federal Bureau of Investigation’s (FBI) tip line at 1-800-225-5324.
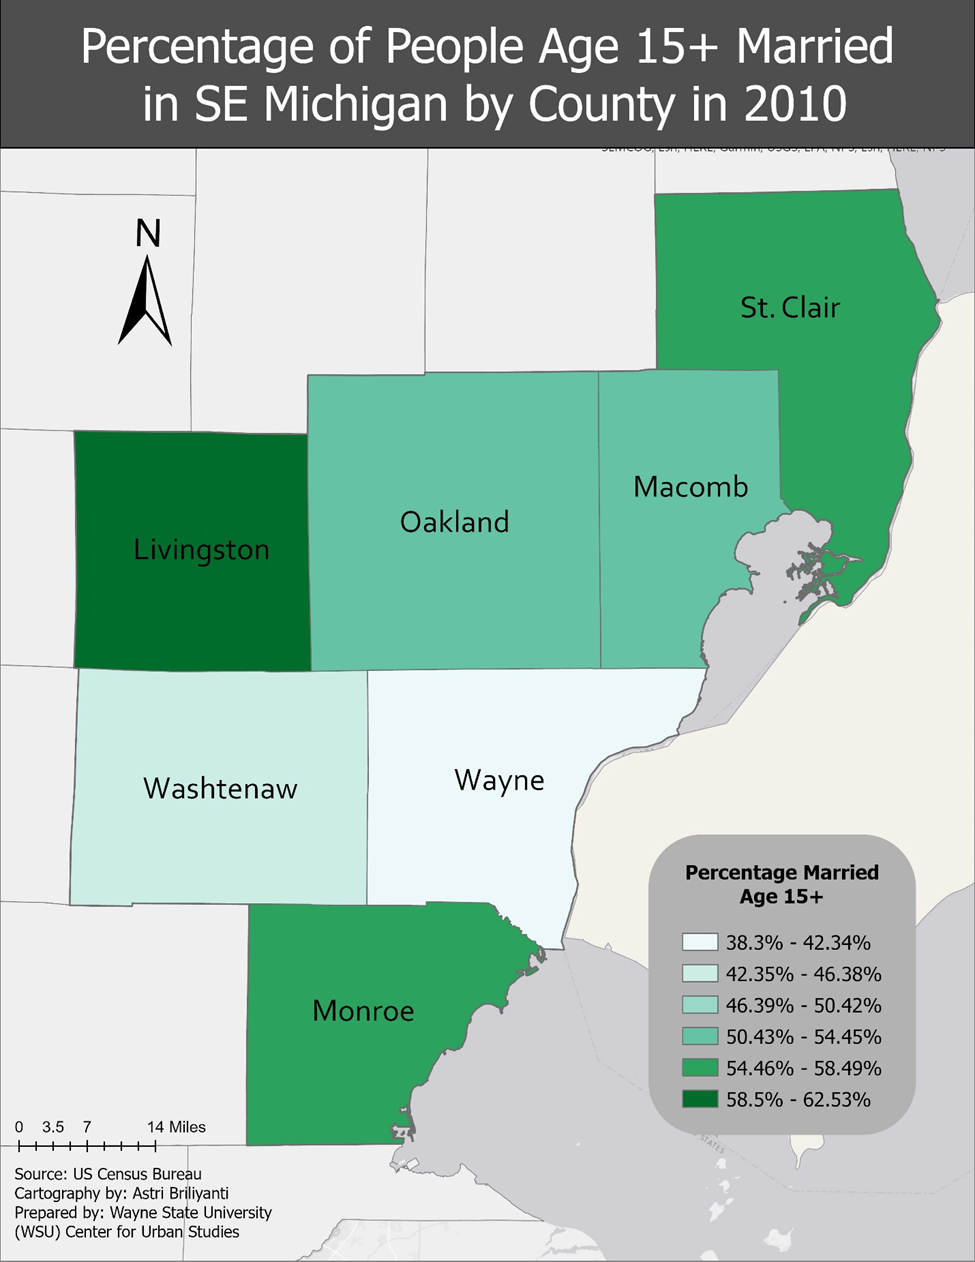
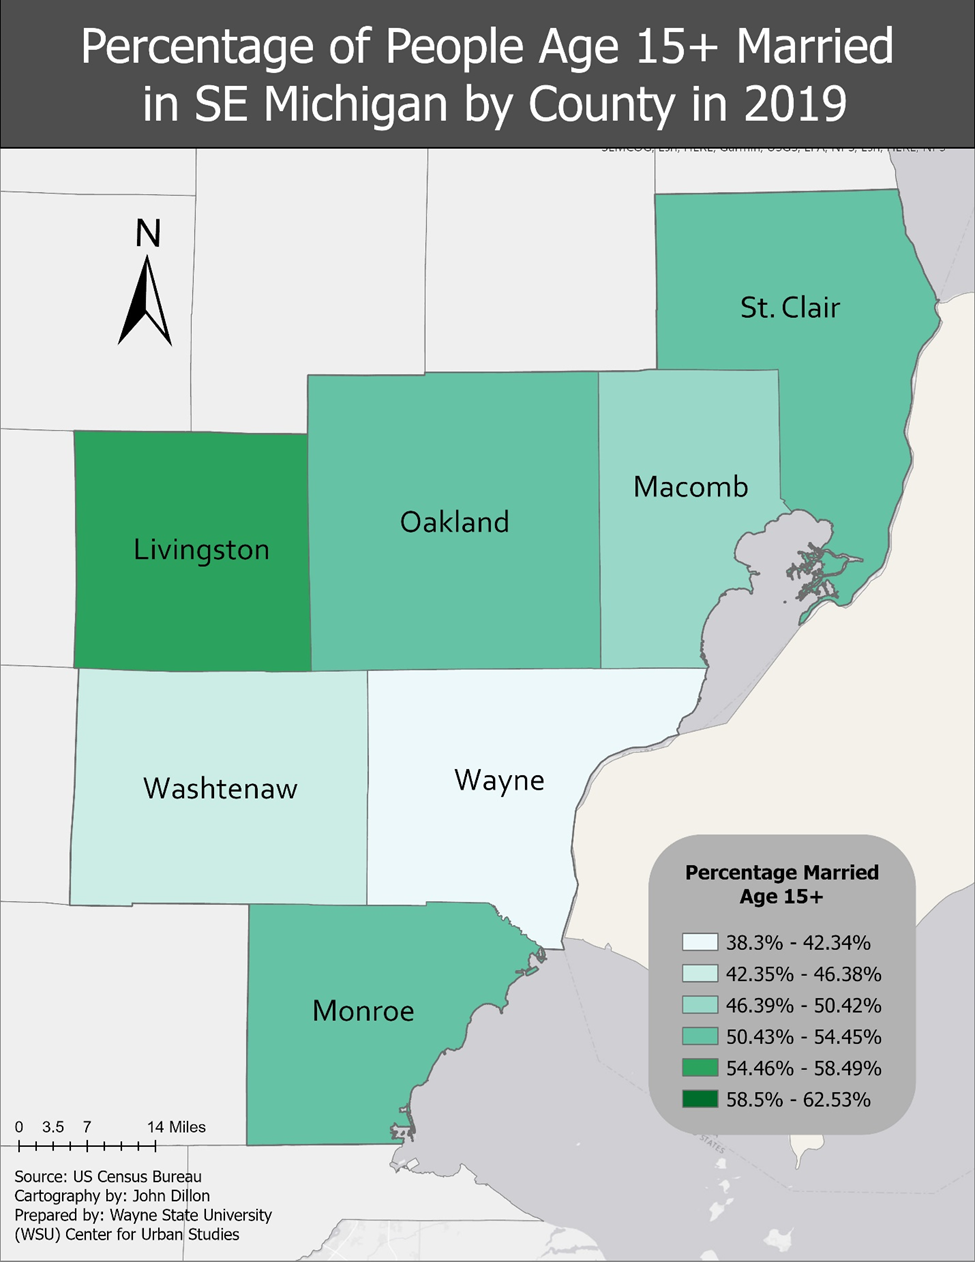
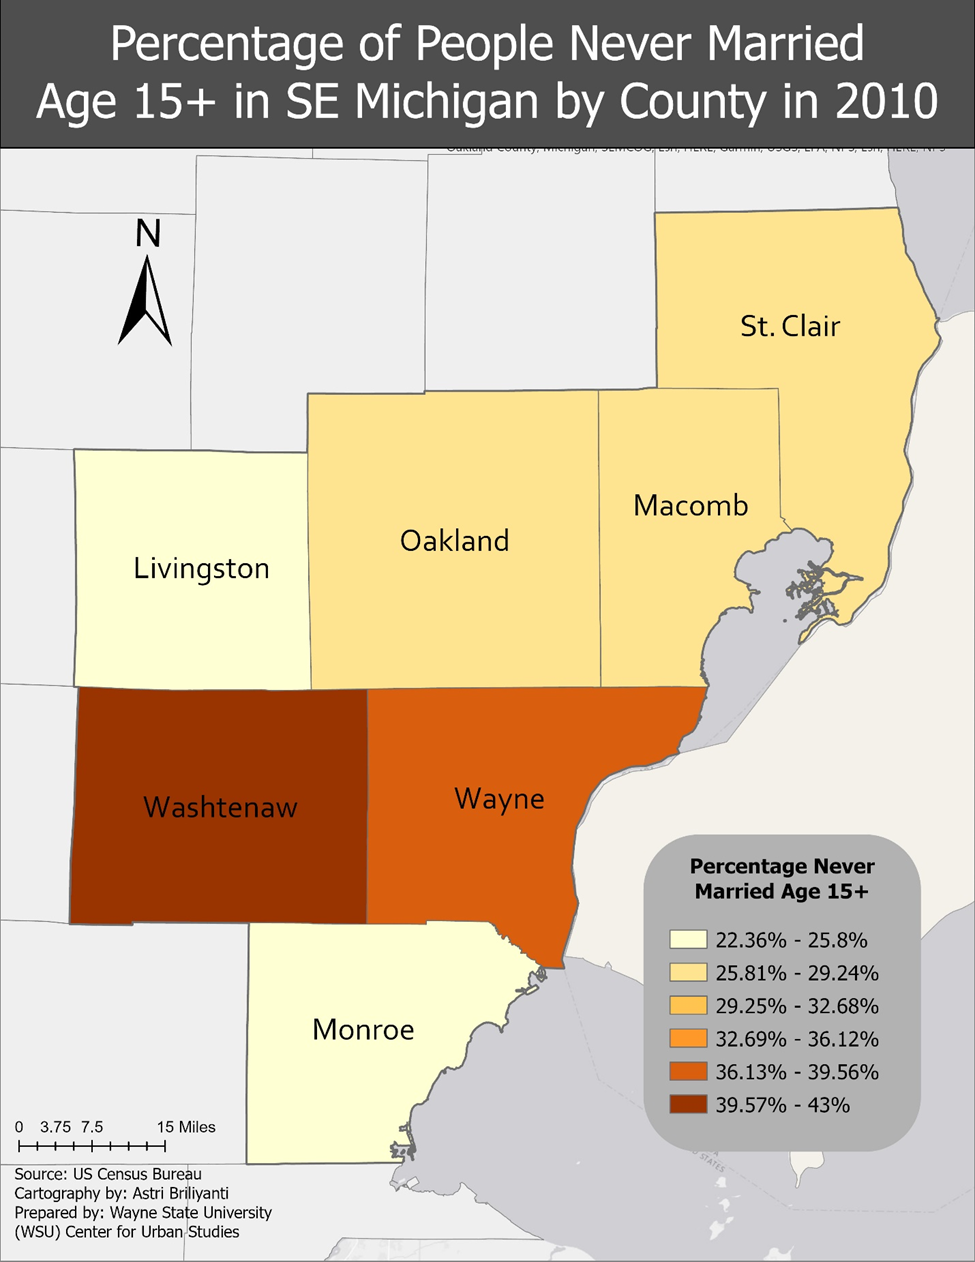
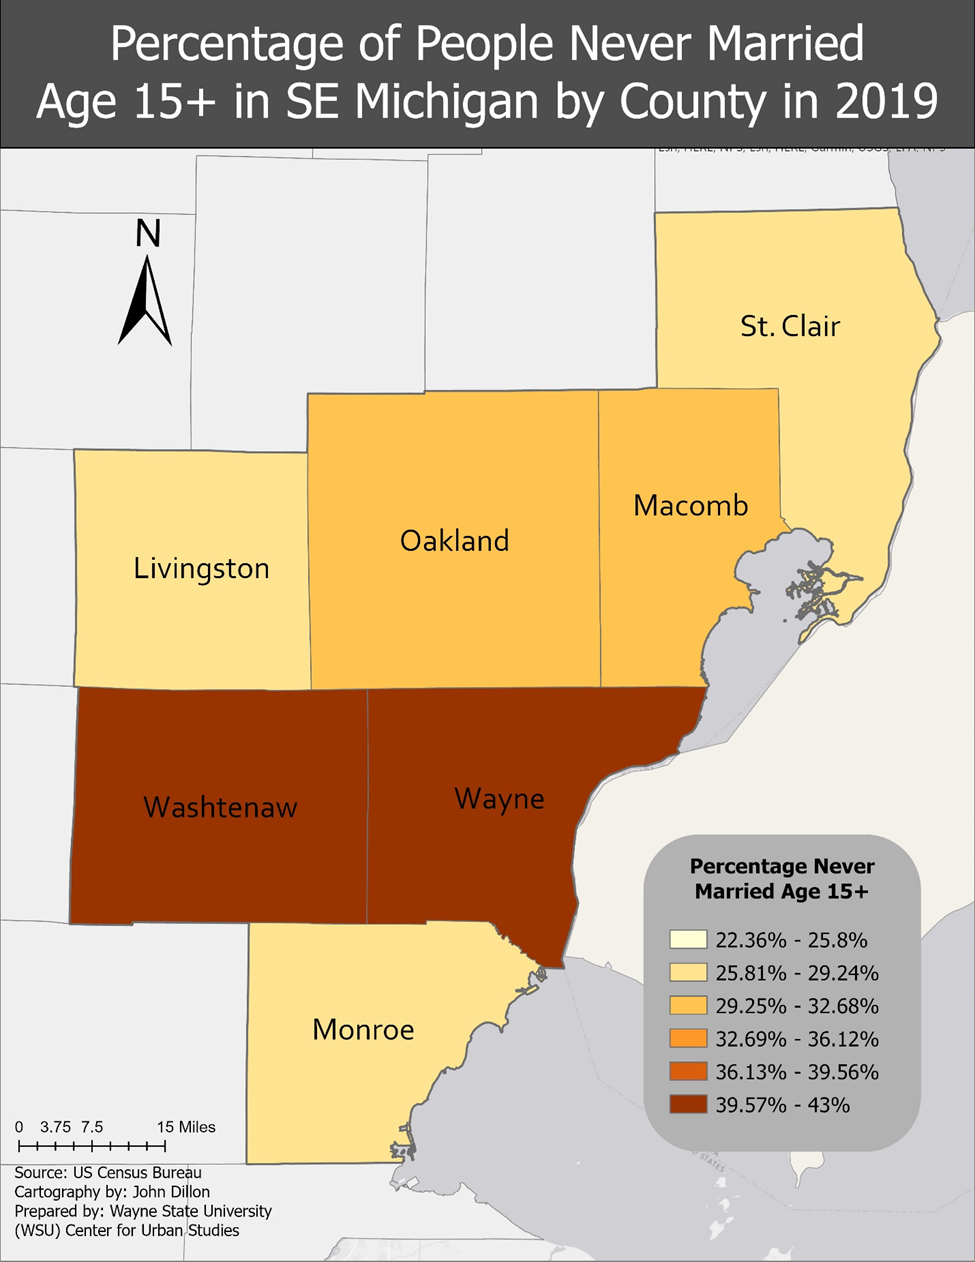
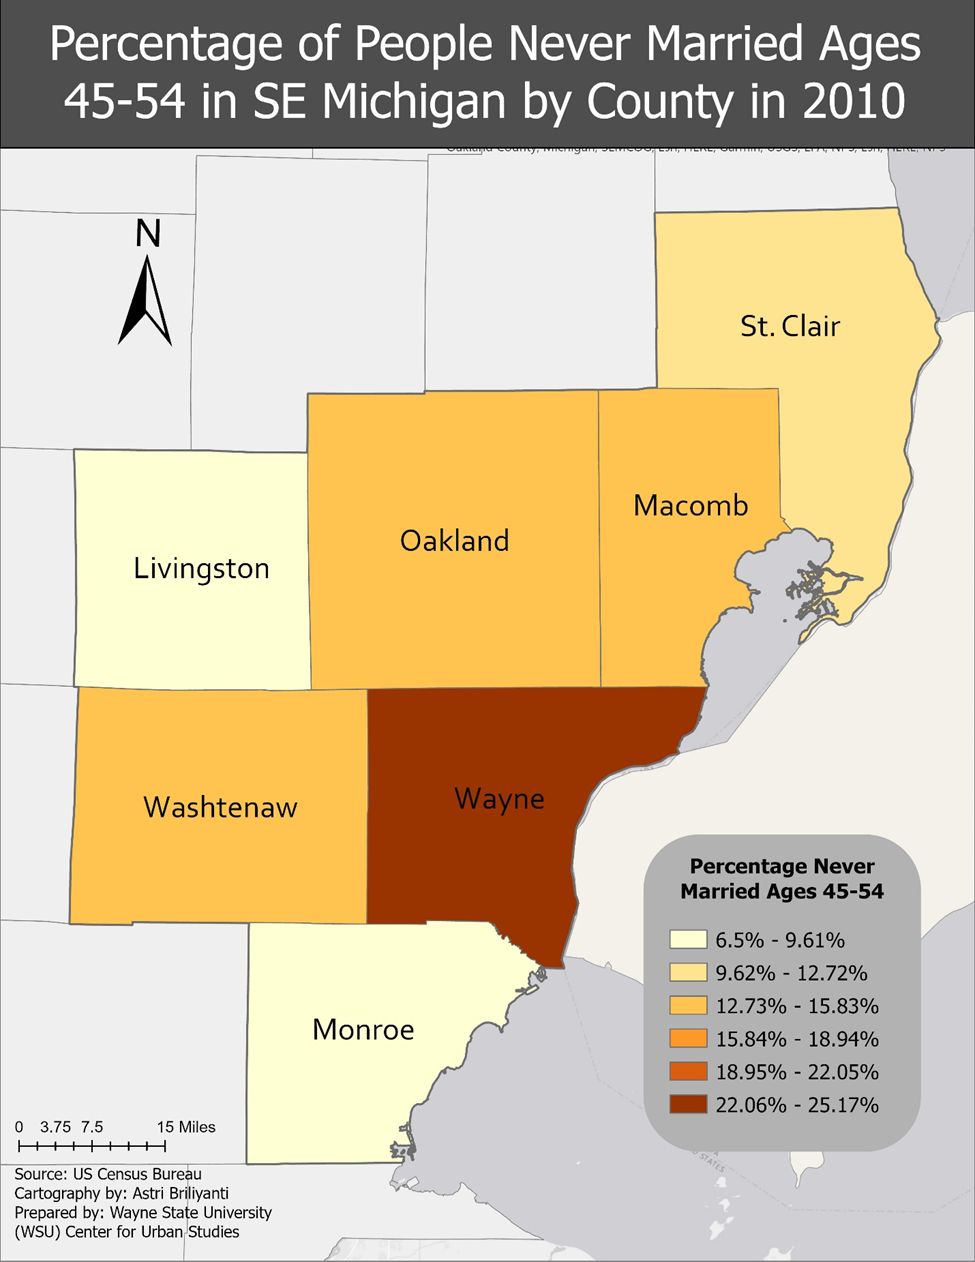
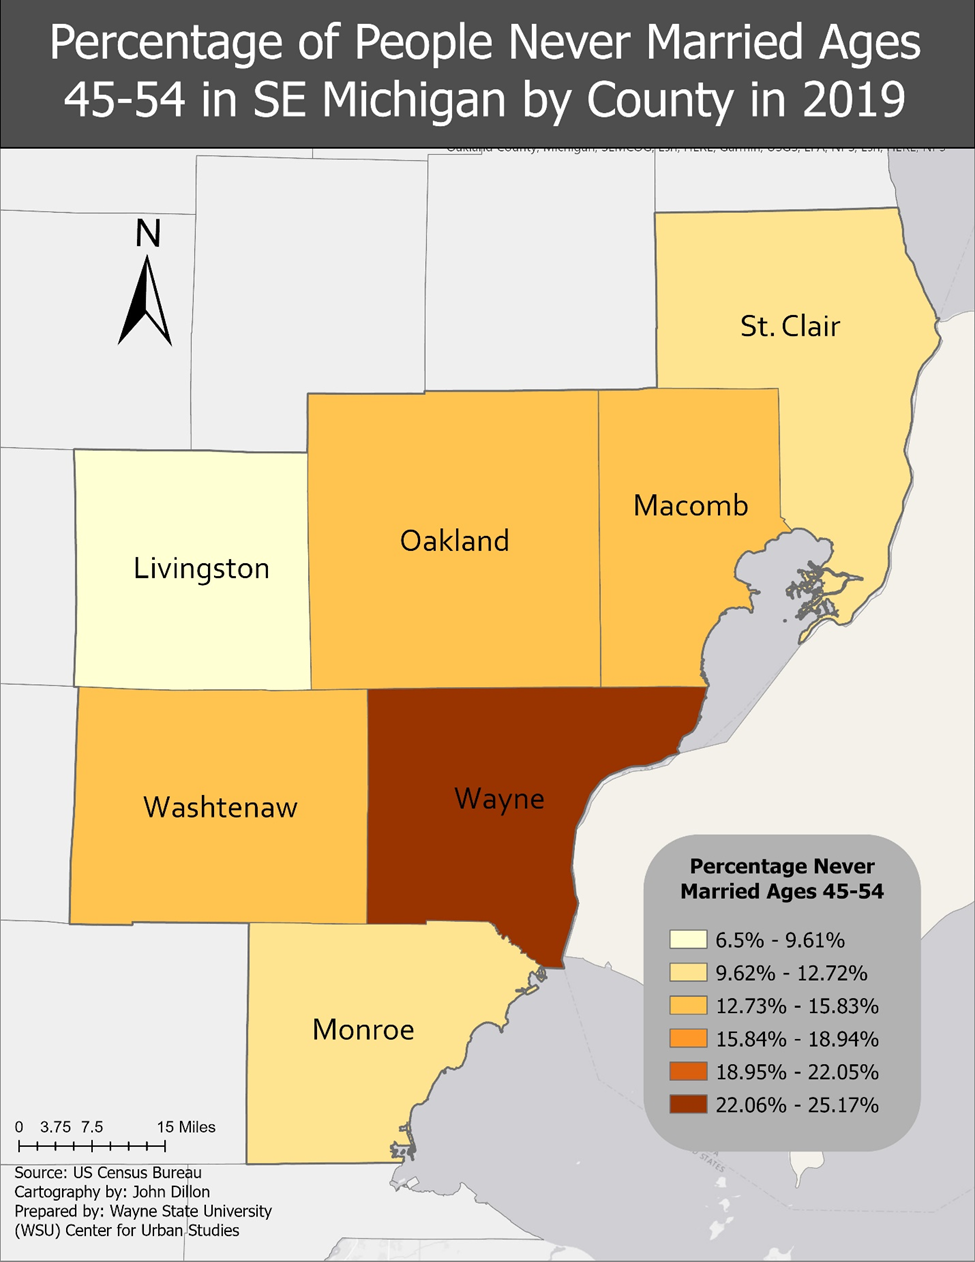
Overall, there was a greater percentage of individuals in Southeastern Michigan who were never been married in 2019 compared to 2010, according to US Census data. In 2019, the county with the highest percentage of married individuals was Livingston County where 58 percent of those who were 15 years of age or older were married; comparatively 63 percent were married in 2010. Wayne County had the lowest percentage of those 15 years of age and older who were married in 2019 at 38 percent, compared to 40 percent who were married in 2010. Overall, each county in Southeastern Michigan experienced a decline between 1 and 4.5 percent of married individuals between 2010 and 2019.
While the percentage of married individuals declined between 2010 and 2019, the percentage of those never married increased. Livingston County experienced a 3.5 percent increase between 2010 and 2019; 22.5 percent of individuals were never married in 2010 and 26 percent were never married in 2019. Overall in 2019 Washtenaw County had the highest percentage of individuals who were never married at 43 percent; Washtenaw County also had the highest percentage of individuals who were never married in 2010 at 40 percent.
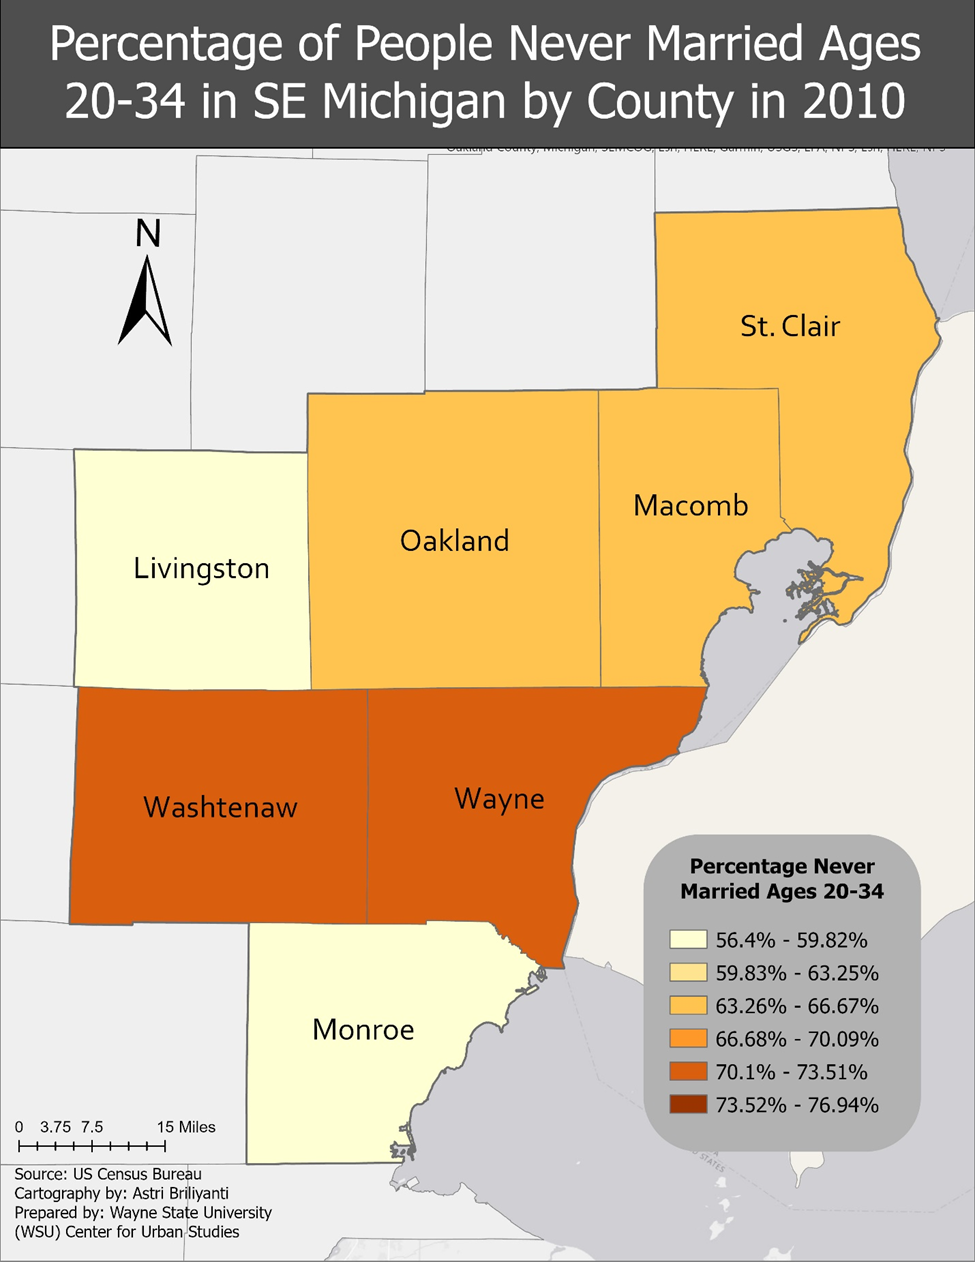
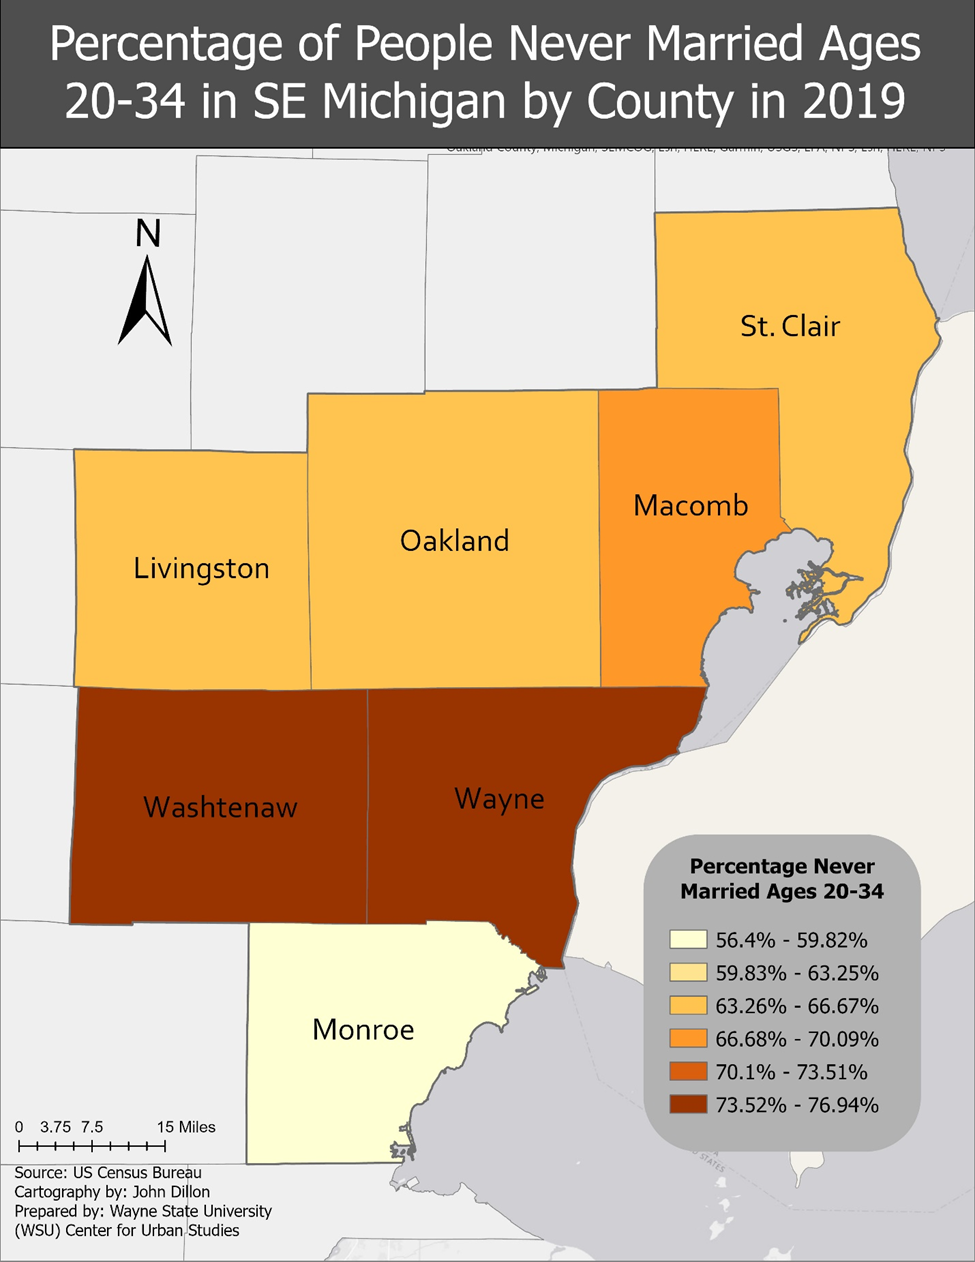
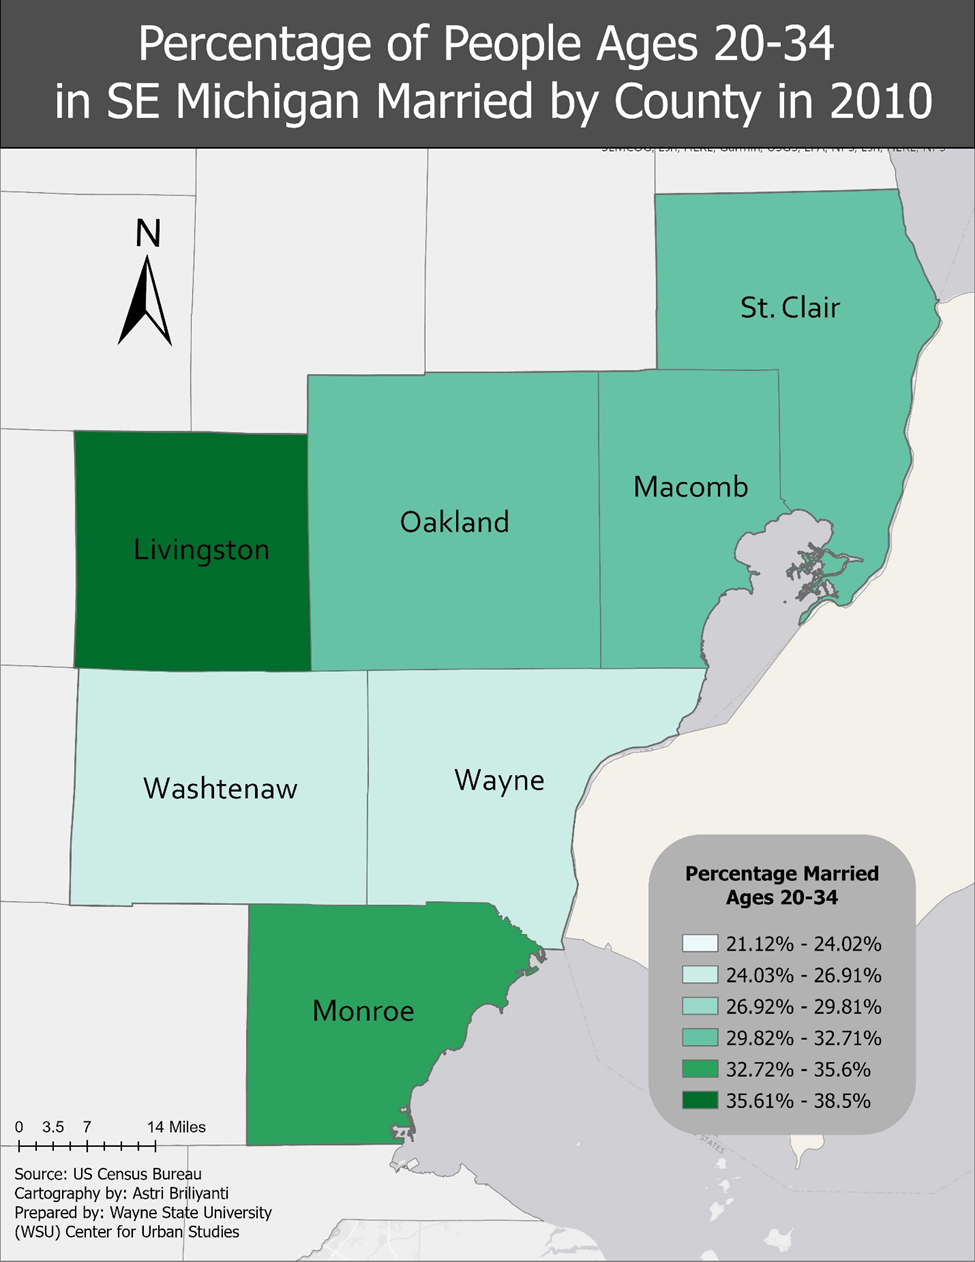
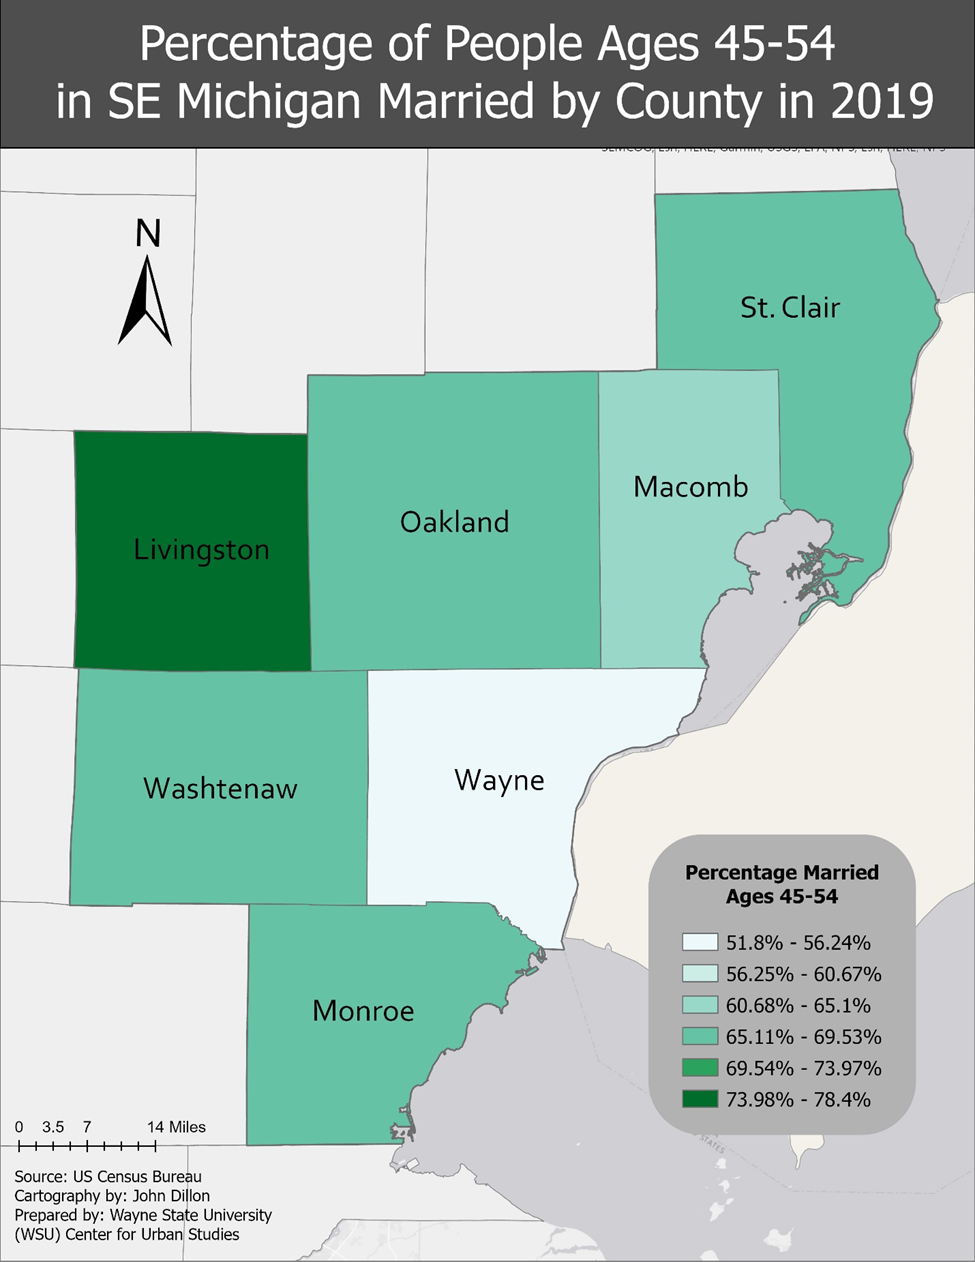
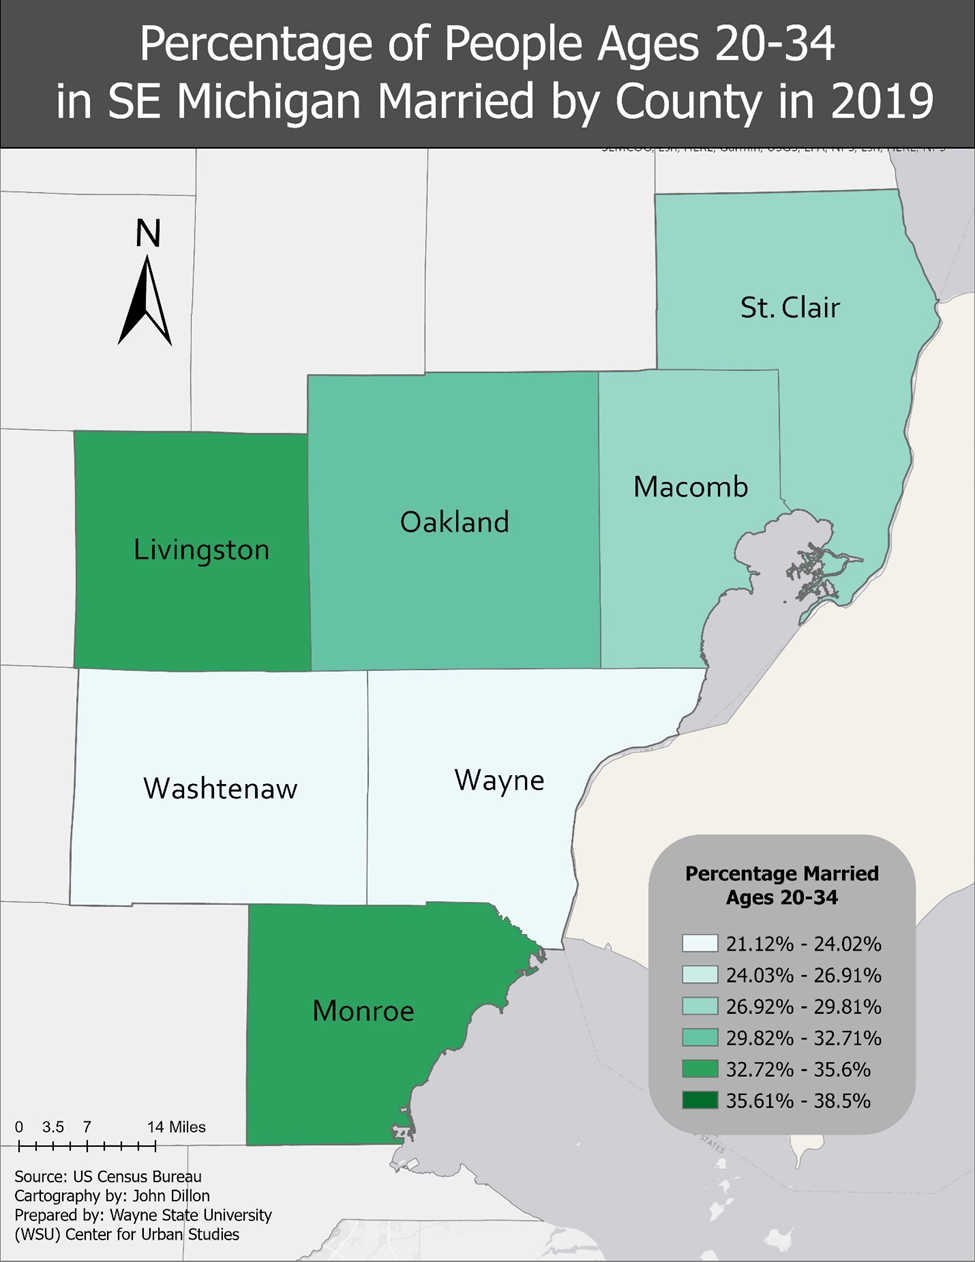
As the general data shows, there is a growing trend of individuals not getting married, and a deeper dive into the data also shows that the age group further highlights that trend is the 20-34-year-old age group. According to the Census data, four of the seven counties in the region experienced a 3 to 7 percent increase in the percentage of 20-34-year-old individuals who have never been married between 2010 and 2019. Livingston County experienced the greatest increase at 7 percent; in 2010 56 percent of 20-34-year-olds in Livingston County were never married, and by 2019 that increased to 73 percent. Washtenaw County experienced a 5 percent increase while Macomb and Wayne counties each experienced 3 percent increases. Monroe County was the only one in the region to experience a percent decrease in 20-34-year-olds who were never married; that increase was only 0.3 percent.
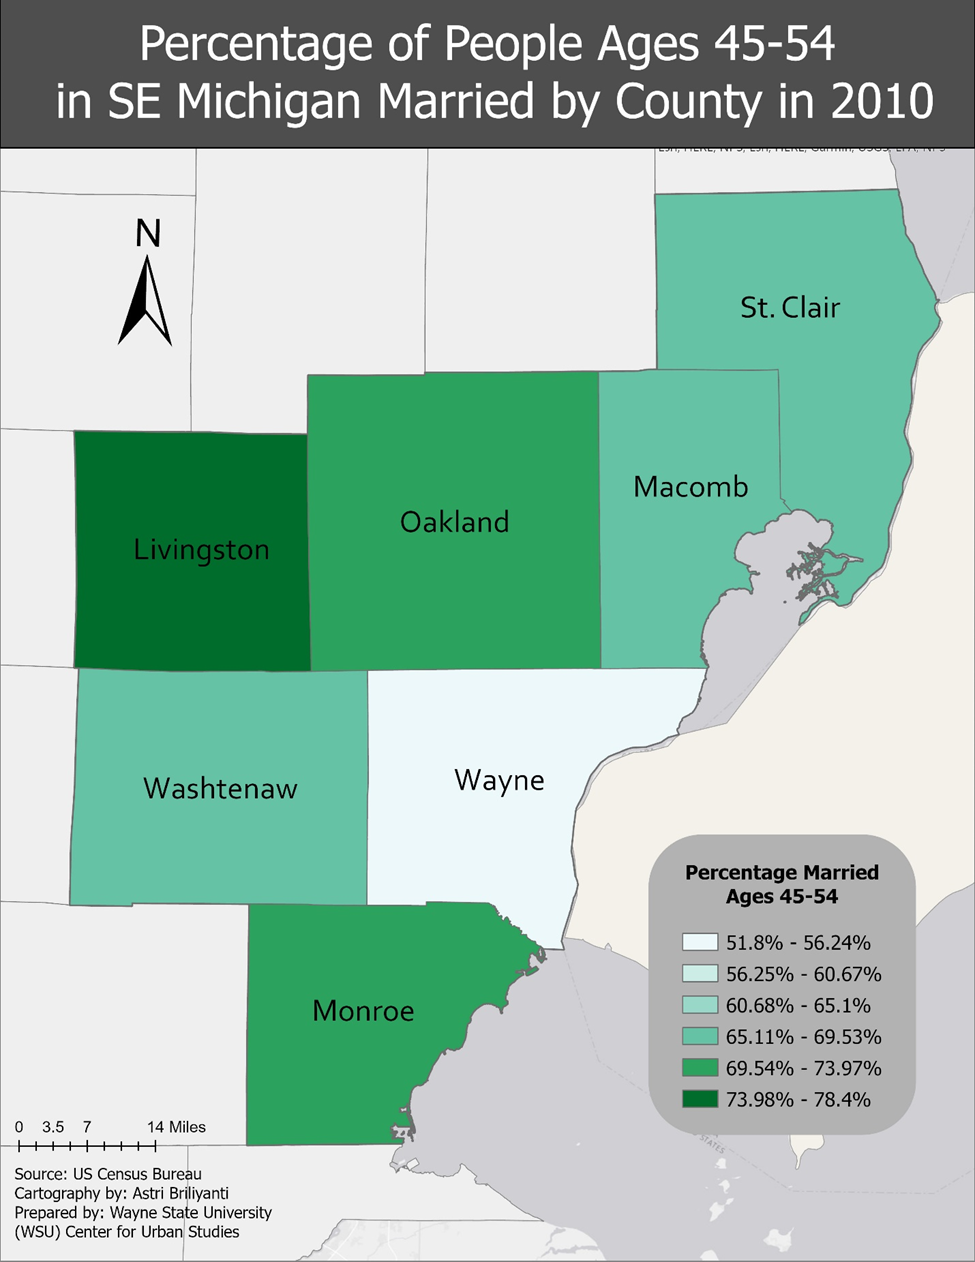
In addition to the percent increase of 20-34 year-olds who were never married between 2010 and 2019, there was also a small increase the percentage of 45-54-year-olds who were never married. In that time frame there was a 0.04 to 2.2 percent increase in that age group never married amongst six of the seven counties. Wayne County experienced the largest increase at 2.2 percent; 23 percent of the 45-54-year-olds in Wayne County were married in 2010 and by 2019 that increased to 25.2 percent. St. Clair County was the only one to experience a small decrease; about 1 percent less of the 45-54-year-olds in St. Clair were marred in 2019 compared to 2010.
Just as there were increases in the percentage of 20-34-year-olds and 45-54-year-olds never married amongst the seven counties in the region, there was also a decrease in those getting married amongst those two age groups.
Nationally, the trend of non-married individuals has been increasing since 1990, according to the Pew Research Center. Factors such as different societal priorities, such as increased focus on the workforce, and higher costs of living are in part driving this trend. Furthermore, the Brookings Institute found that marriage rates are also declining amongst the middle class, possibly due to the cost of raising children.
More people died in Michigan in 2020 than were born, and it has been trending this way for quite some time. The Michigan Department of Health and Human Services reported that in 2020 there 104,166 people born and 117,087 who died; the 2020 data was only available at the state level. While COVID certainly impacted the number of 2020 deaths (11,362 were COVID related), there still would have been a greater number of deaths than births without the pandemic.
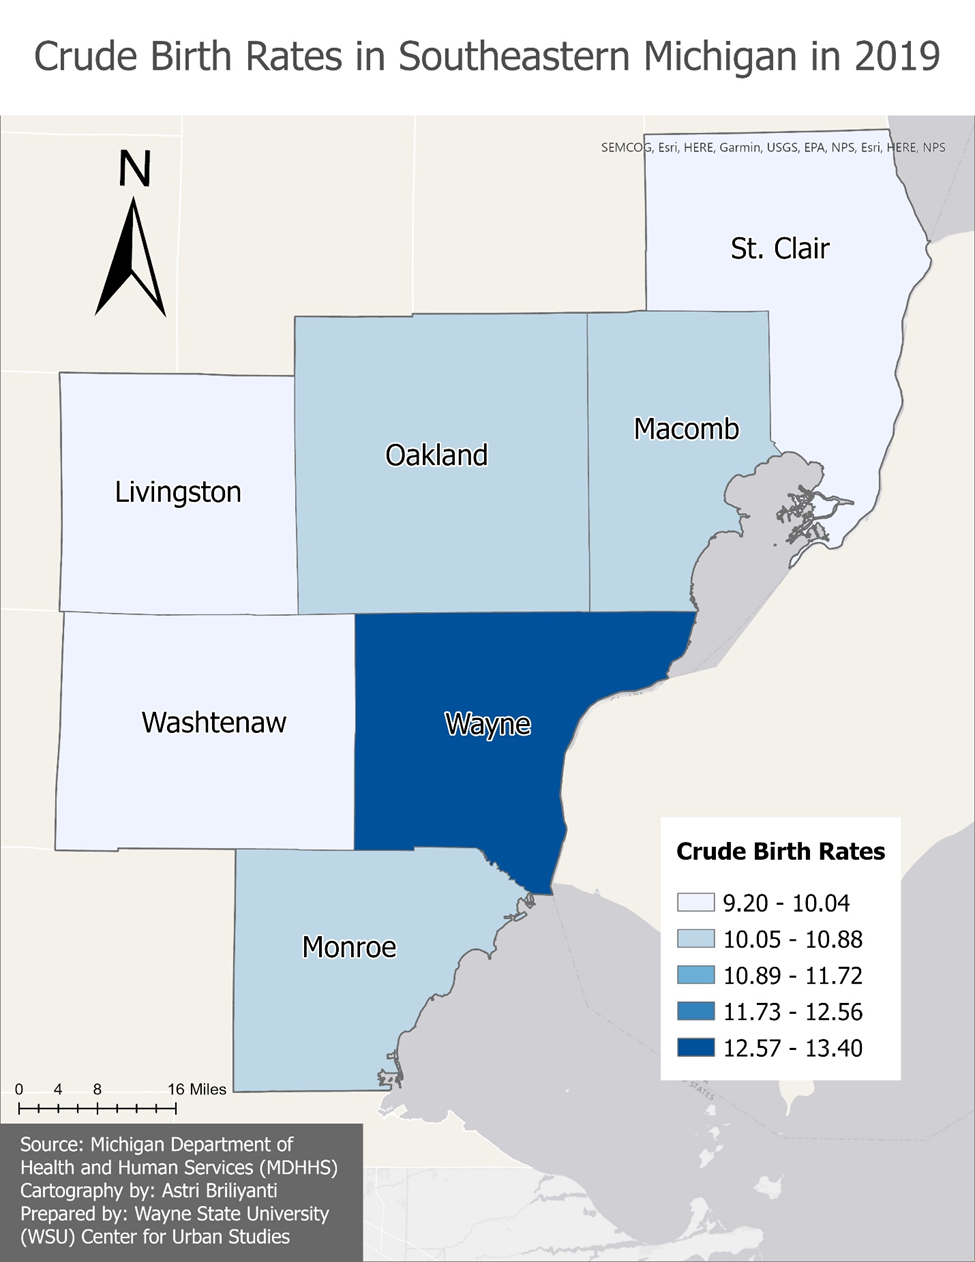
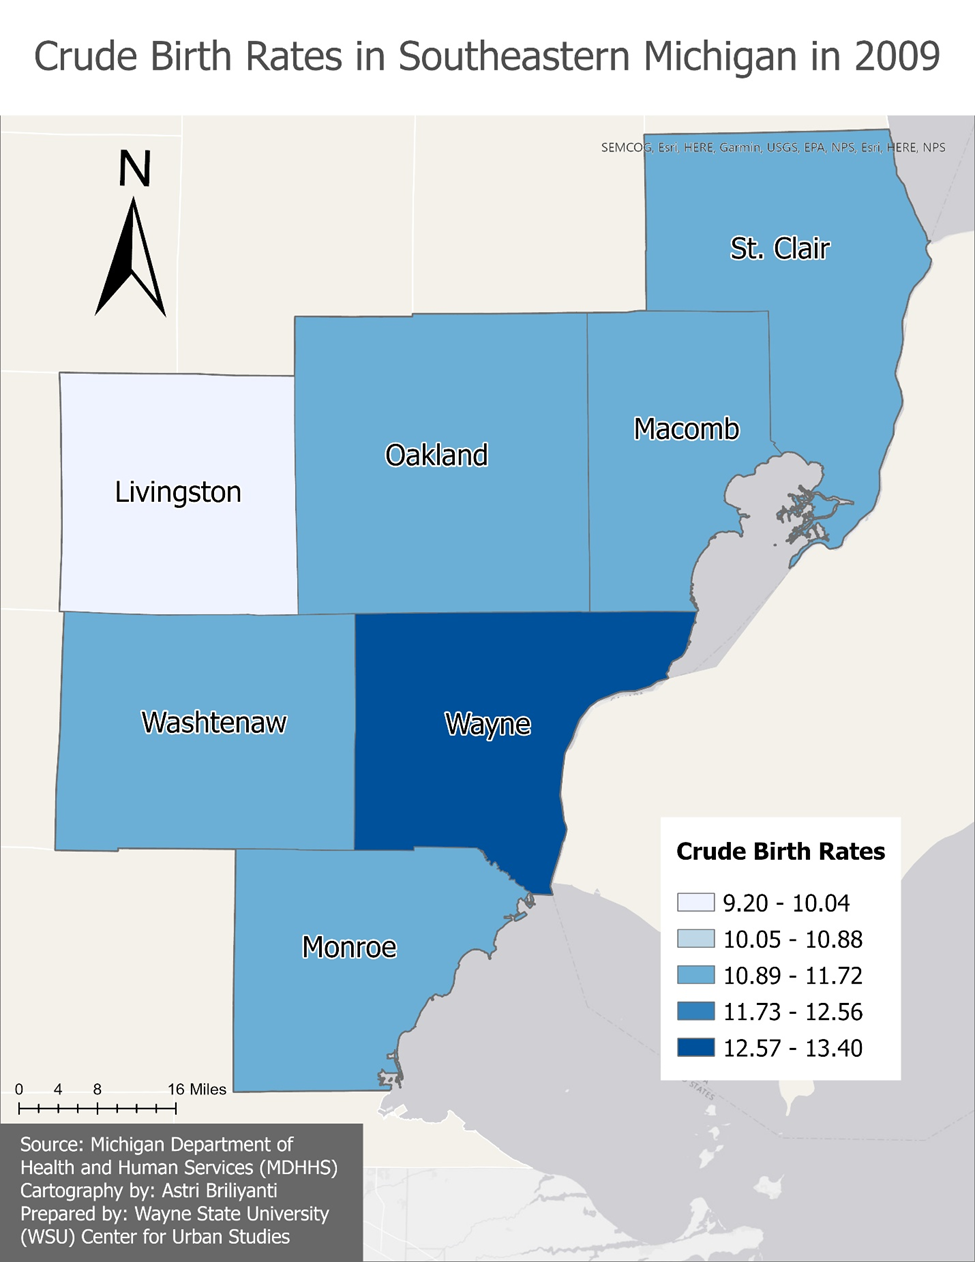
While 2020 data is not yet available at the county level, the 2019 data shows how birth and death rates have long been trending toward more deaths than births. In Wayne County, the largest county in the state, a birth rate of 12.9 births per 1,000 residents was reported, which was equivalent to 22,553 births. Wayne County had the highest birth rate in the region in 2019, but it did not have the largest change in birth rates between 2009 and 2019. According to the data, there was a birth rate of 12.9 births per 1,000 residents in Wayne County in 2019 and a birth rate of 13.6 births per 1,000 residents in 2009. Washtenaw County had the largest difference in birth rates between 2009 and 2019 at a rate decrease of 1.4 per 1,000 residents. In 2019 Washtenaw County had a birth rate of 9.7, which was equivalent to 3,560 births, and in 2009 that birth rate was 11.1. Oakland, Macomb, Monroe and St. Clair counties all also reported birth rates above 10 in 2009 (11.1, 11.1, 11.4 and 10.9, respectively); Livingston County was the only one in the region to report a birth rate below 10 in 2009. By 2019 only Macomb, Monroe, Oakland and Wayne counties reported birth rates above 10 (10.4, 10.1, 10.3 and 12.9, respectively).
Michigan’s birth rate per 1,000 residents was 11.8 in 2009 and 10.8 in 2019.
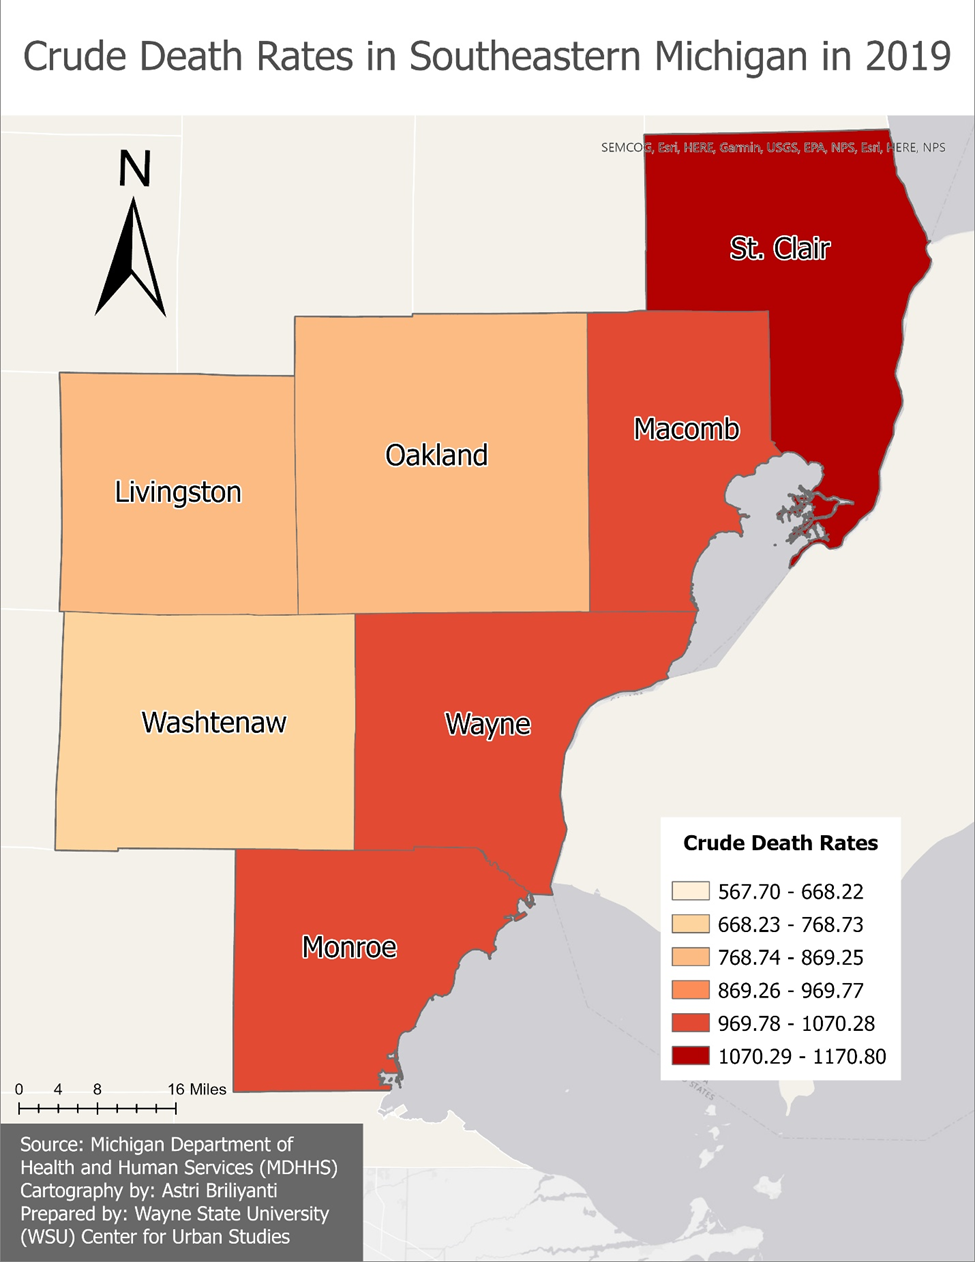
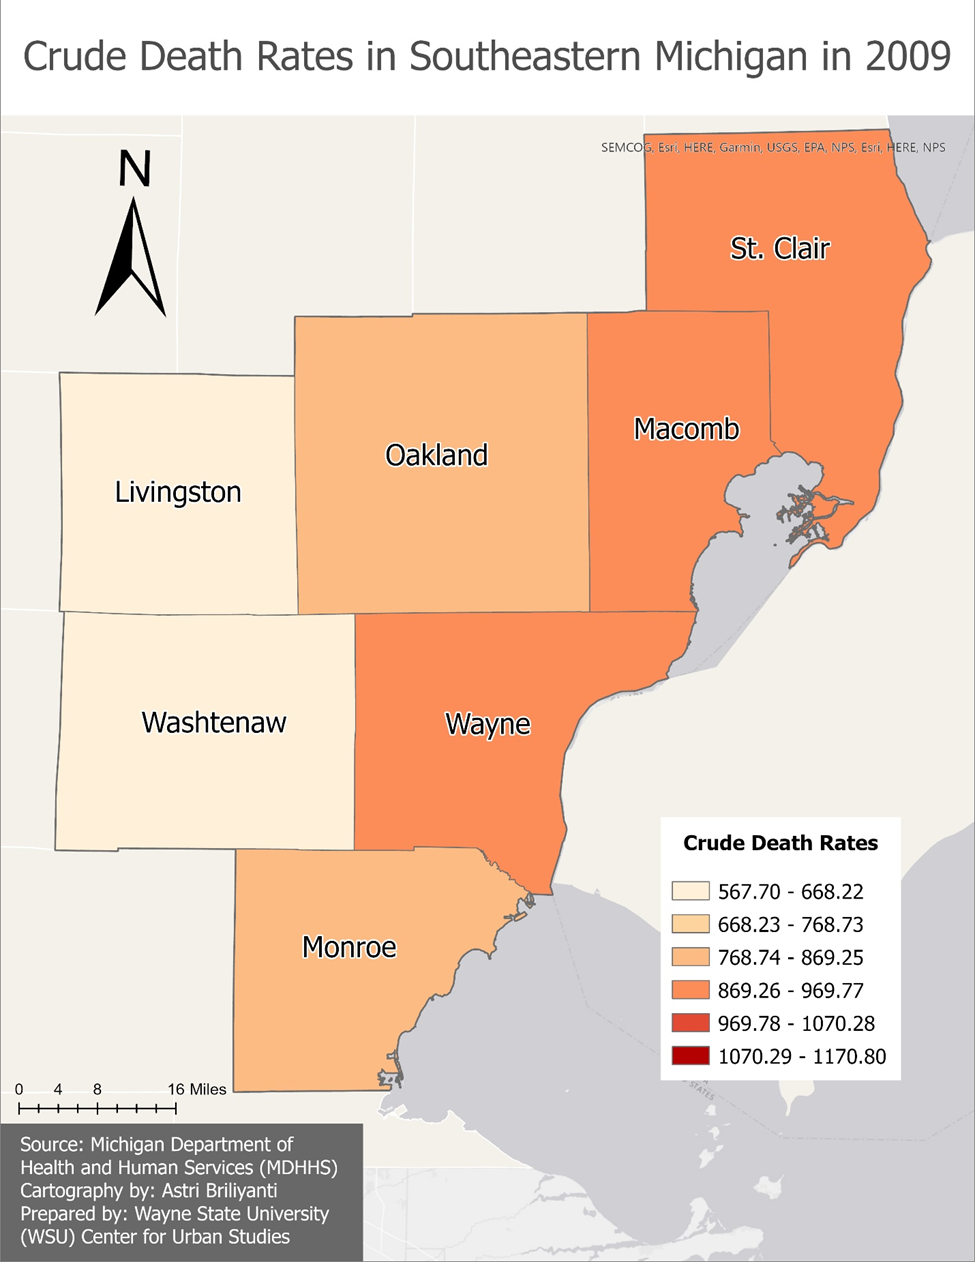
As birth rates in Michigan were declining, death rates were on the rise. In 2019, St. Clair County had the highest death rate at 1,170.8 per 1,000 residents in 2019, which was equivalent to 1,863 deaths. Macomb, Monroe and Wayne counties were the only other counties with death rates above 1,000 ( 1,026.2, 1,047.8 and 1,044.7, respectively). In 2009 though there was not one county in the region with a death rate above 1,000. St. Clair County reported 961.5 deaths per 1,000 residents, which was the highest death rate in the region reported. Overall, Monroe County experienced the highest increase in its death rate between 2009 (847 per 1,000 residents) and 2019 (1,047.8 per 1,000 residents) at a 221.8 rate increase per 1,000 residents.
It should also be noted that Michigan’s death rate per 1,000 residents was 871.7 in 2009 and 992.3 in 2019.
A decline in births will certainly impact Michigan long-term if things don’t turn around. While
Michigan did experience a small uptick in its population between 2010 and 2020 probably because of immigration, the rate of increase wasn’t as high as compared to other states, hence why Michigan lost a Congressional seat. Population decline, and even stagnation, could cause negative economic impacts and further loss of political power. On the other hand, it would give the environment a break from human interventions, giving forests and wildlife a chance to expand, perhaps.
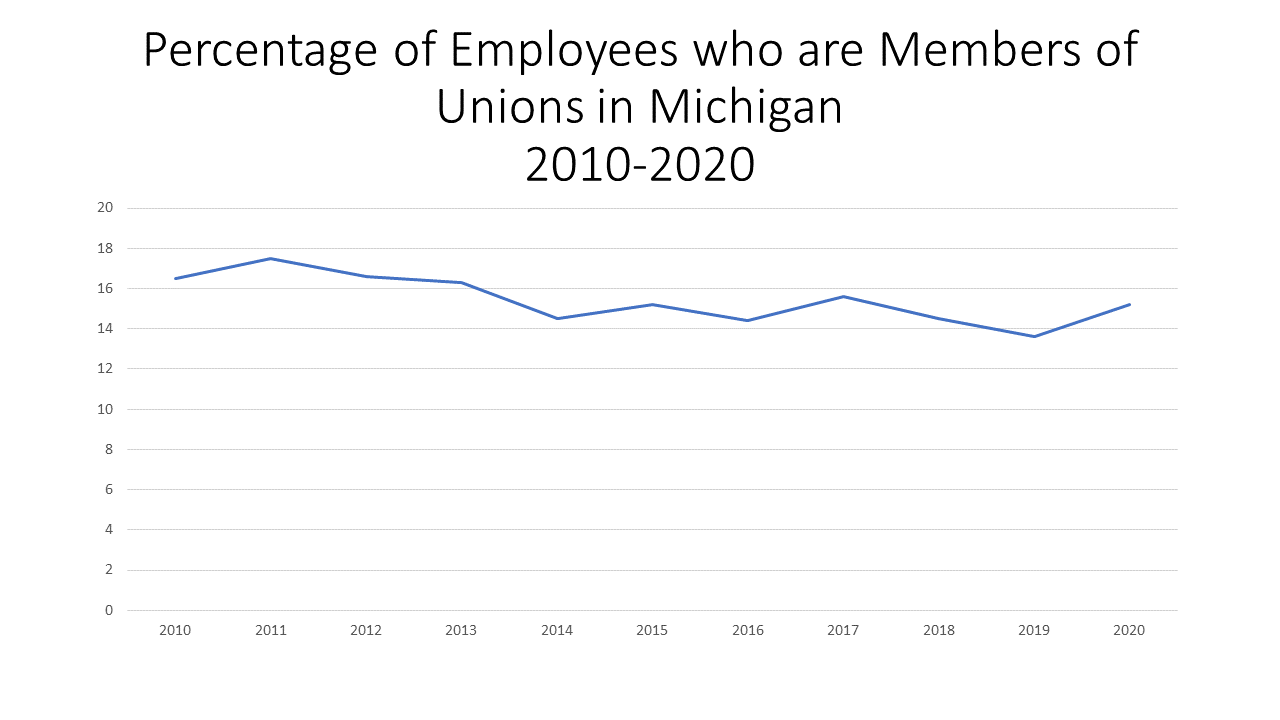
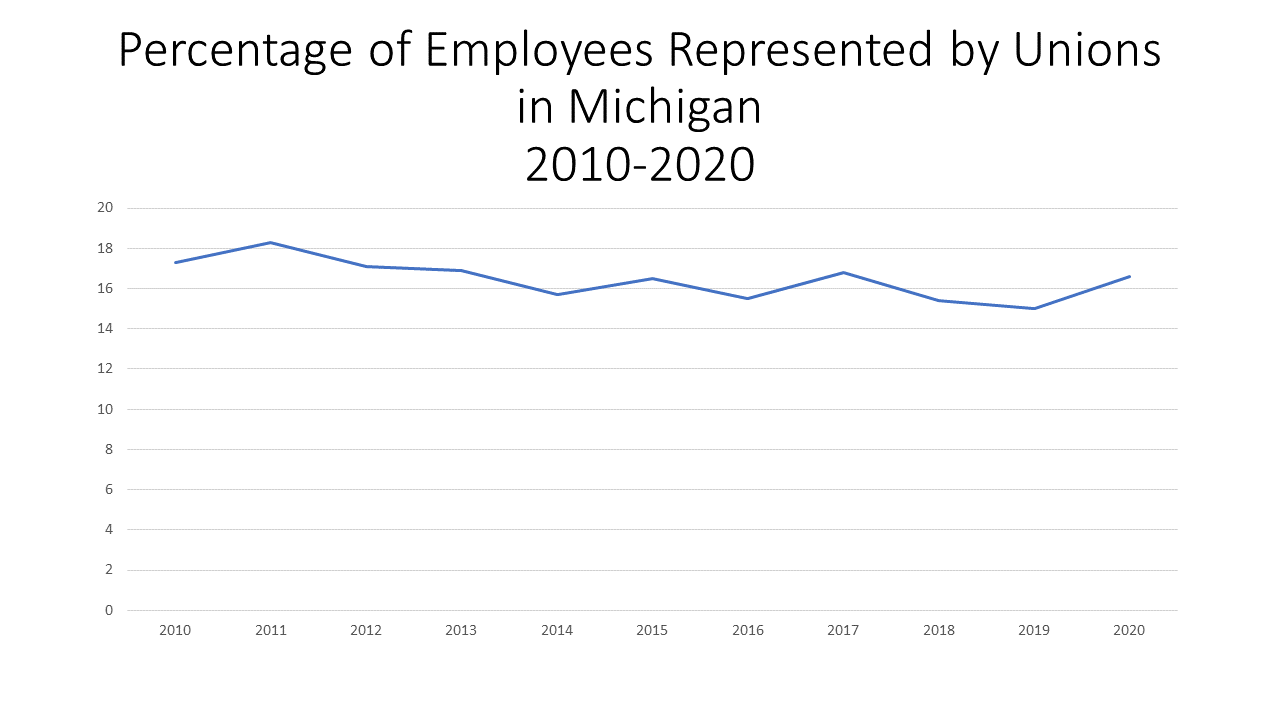
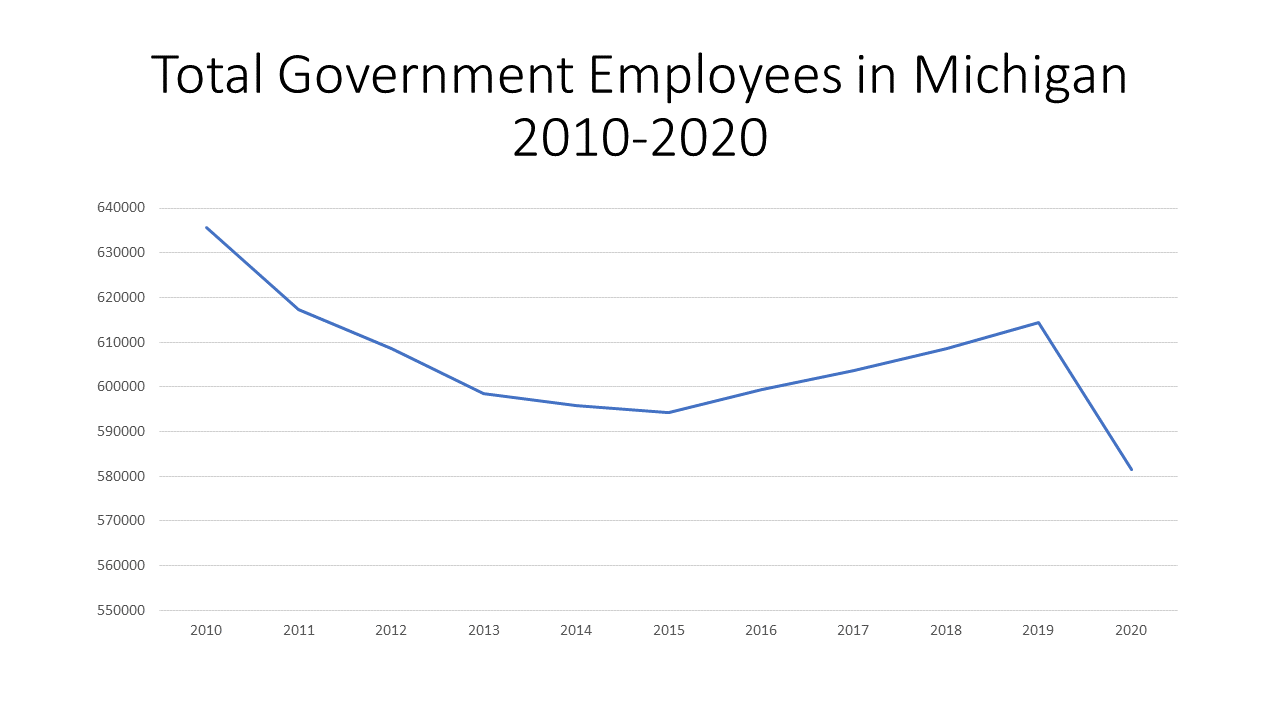
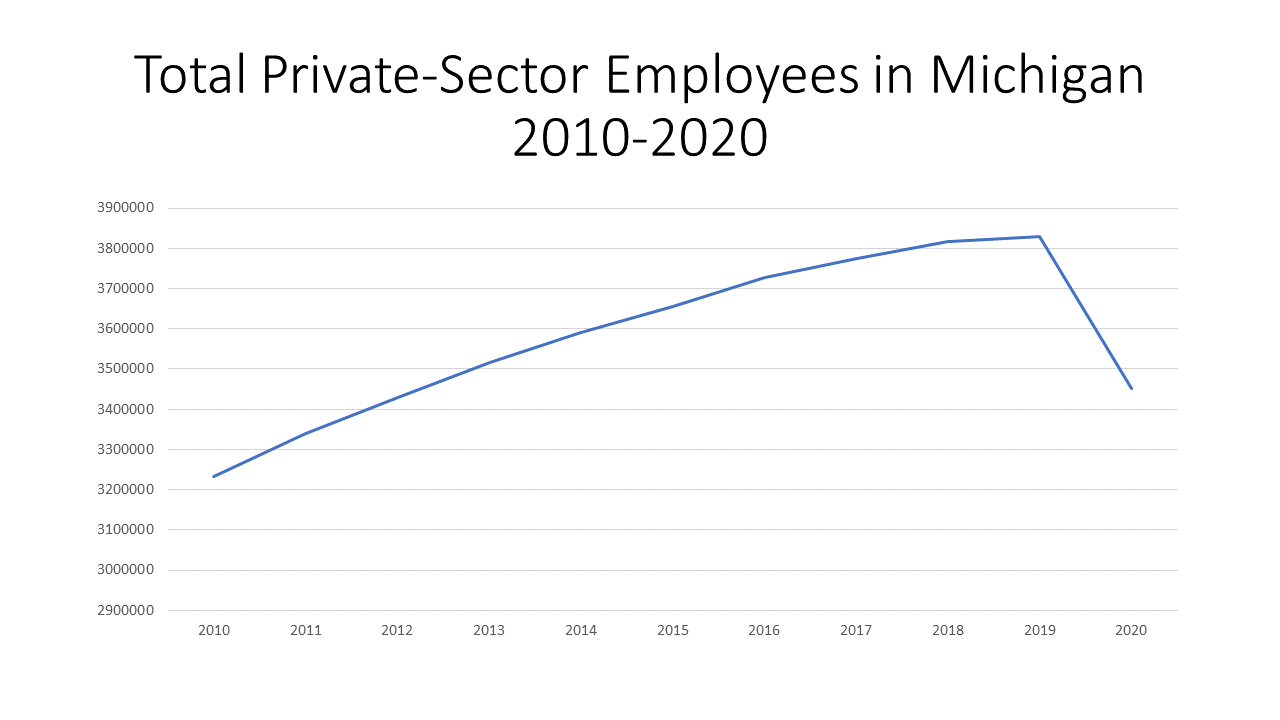
In 2020 there was an increase in the percentage of employees who were members of a union; there was also an increase the percentage of employees who were represented by unions. This comes after an overall decline in union membership and representation since 2010, according to the Bureau of Labor Statistics (BLS). In 2010 16.5 percent of employees were members of a union in Michigan and 17. 3 percent were represented by a union. In 2020 15.2 percent of employees were members of a union and 16.6 percent were represented by a union; both categories experienced increases from 2019. Overall in Michigan in 2020 there were 604,000 union members. In addition to these members, another 57,000 wage and salary workers in Michigan were represented by a union on their main job or covered by an employee association or contract while not union members themselves.
While the BLS does not track union membership by sector or occupation at the state level, nationally the BLS reports that the union membership rate of public-sector workers is more than five times higher than the rate of private-sector workers who are union members. According to the BLS, 33.9 percent of the public-sector employees were union members in 2021. Of those public-sector employees in the union, majority were represented those in the education, training, library and protective service occupations. The percentage of private-sector employees who were union members was 6.1 percent in 2021. According to the BLS, and a recent New York Times article, majority of the union membership decline has come from the private sector. Nationally, private-sector union membership was at 6 percent in 2021 and in 1983 it was at 17 percent.
Overall there are a greater number of private-sector employees than government employees, and while the charts below show there was a decline in the total number of employees in both sectors after COVID, the lack of union representation in the private-sector is causing, at least some, to leave their jobs, according to the New York Times article. With a shift in the labor market and workplace practices since the pandemic began, more and more workers are feeling confident in their ability to leave jobs that don’t fit their needs. While the New York Times sites that this doesn’t always leave to increased union activity, the current labor market has certainly allowed more people to be more vocal and how their employer can meet their needs, and not just the other way around.
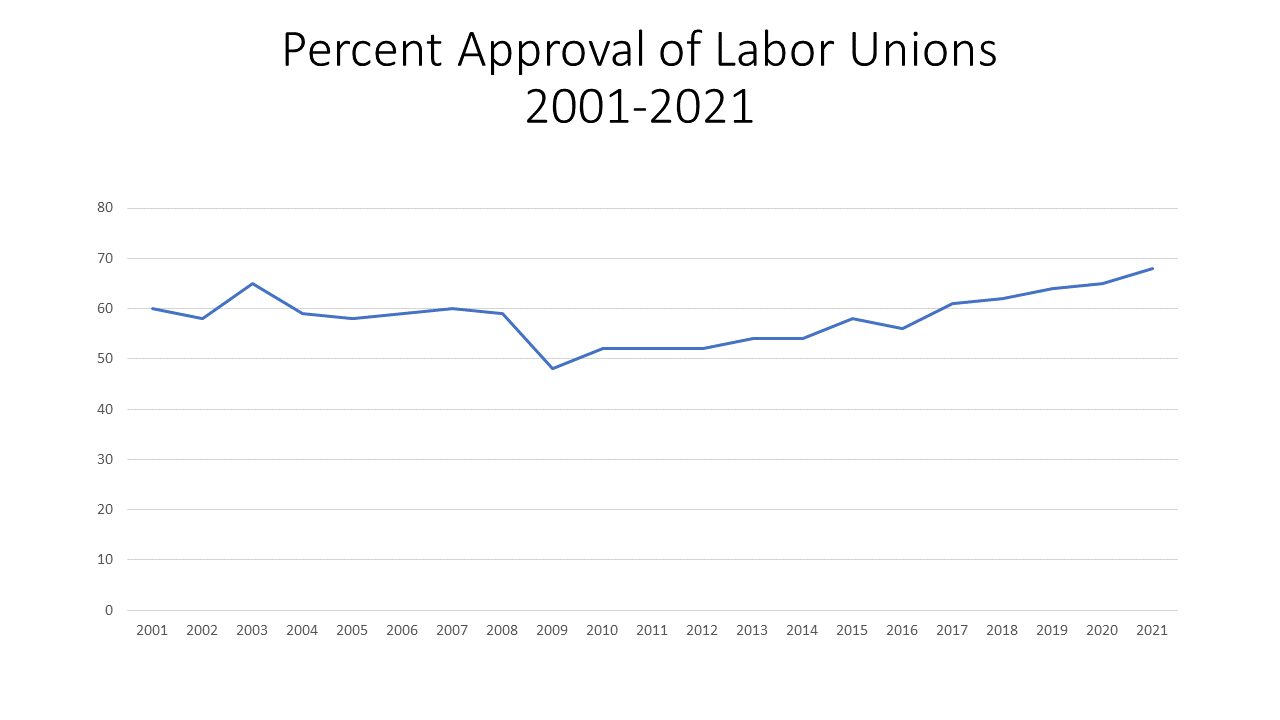
Labor unions have experienced an overall increase in sentiment since 2009, according to Gallup, with 68 percent of those polled expressing approval of labor unions in 2021. This approval rate is the highest it has been since 1965 when there was a 71 percent approval rating. With increased media attention on the successful efforts of employees at Kellogg in Battle Creek, Kroger (King Sooper) employees in Denver, and more throughout the country to earn better wages and benefits, it should not be surprising there is an increased interest and approval in the purpose of a union. Additionally, with the makeup of the current labor market, as noted earlier, individuals have more room to seek jobs that offer better wages, benefits and overall safer and better experience—much of which the mission of unions is based around.
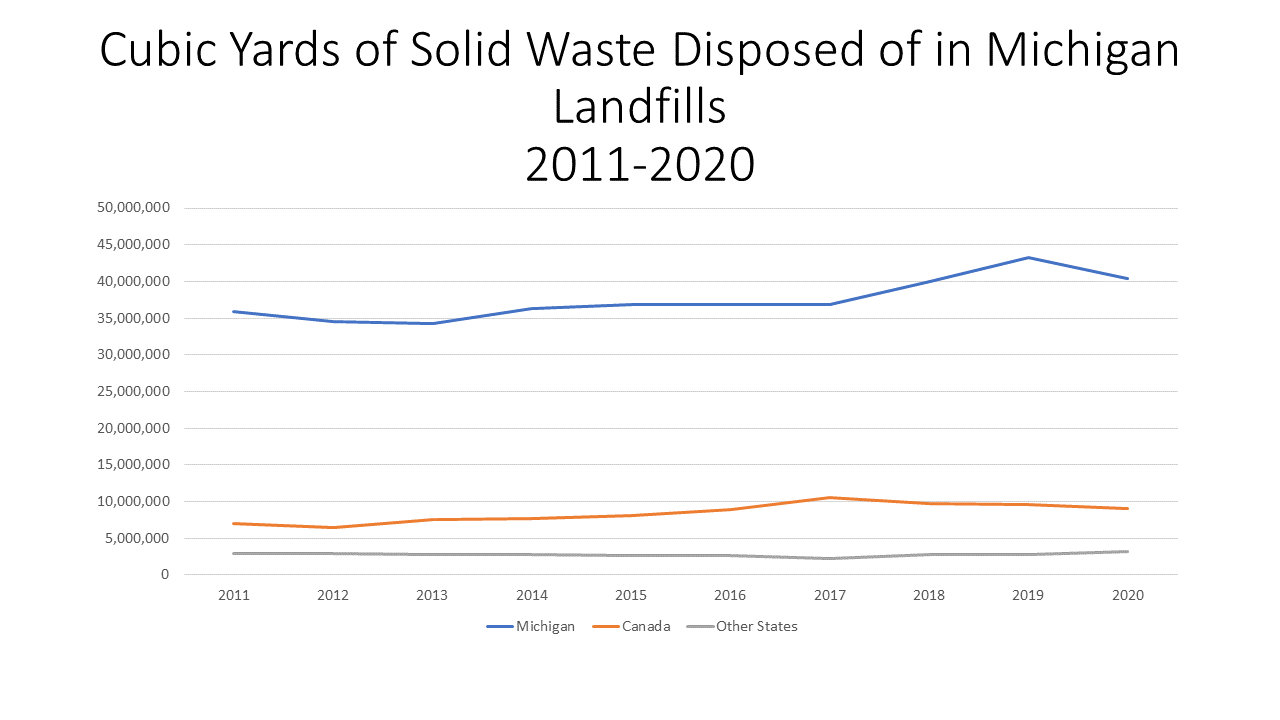
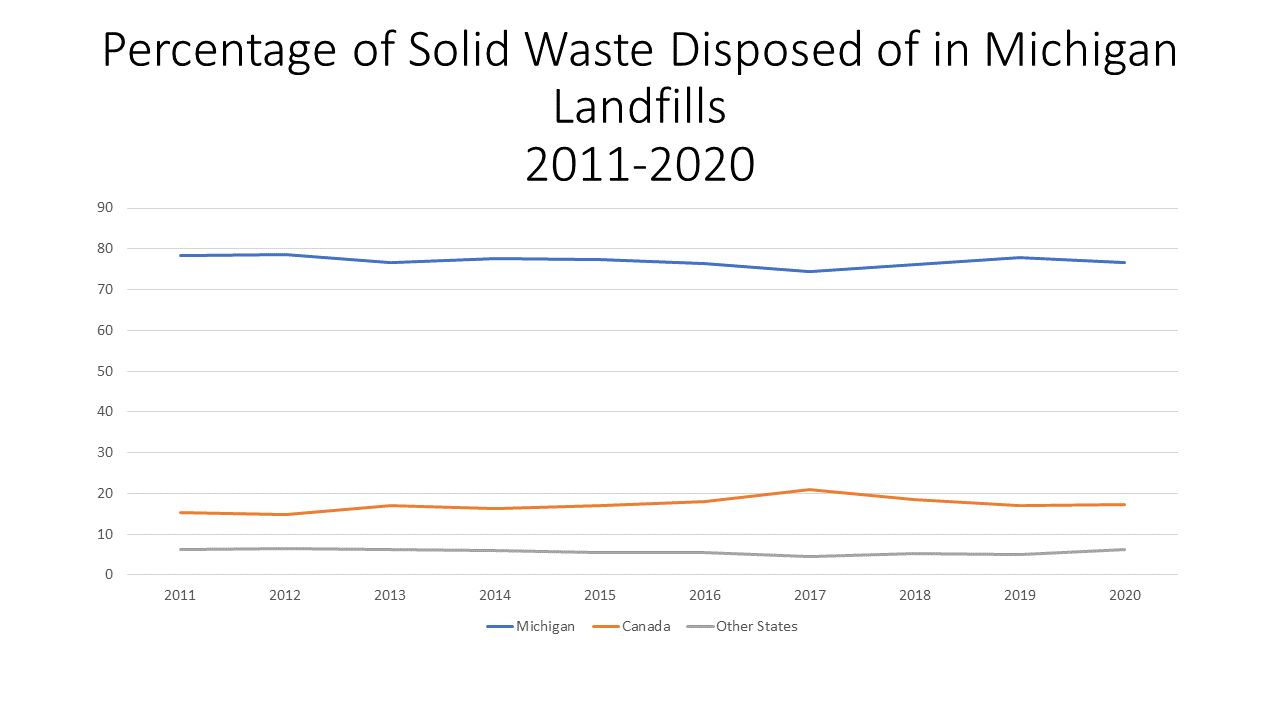
In Michigan, the total amount of solid waste disposed in the state decreased between fiscal year 2019 and 2020, as did the total amount of solid waste imported into Michigan. However, while the total amount of waste disposed of in Michigan decreased, the amount of waste disposed of in Michigan from other states increased.
The total amount of solid waste disposed in Michigan in 2020 decreased by about 3 million cubic yards, or about 5.4 percent from the previous fiscal year (2019). The amount of solid waste generated in Michigan decreased from about 43.3 million cubic yards in fiscal year 2019 to about 40.4 million cubic yards, a decrease of about 6.8 percent. Overall, the total amount of imported waste into Michigan landfills decreased from 12,380,141 cubic yards in 2020 to 12,310,608 cubic yards in 2019, a decrease of about 0.6 percent. The largest source of waste imported to Michigan continues to be from Canada, with a total of about 9.1 million cubic yards, down 480,274 cubic yards reported for fiscal year. Overall, the amount of solid waste Canada imported to Michigan in 2020 was about 17.2 percent of all waste disposed in Michigan landfills, while Michigan created about 77 percent of the waste. Other states also contributed to the total amount of solid waste in Michigan, with waste from other states brought to Michigan making up 6 percent of Michigan’s total waste. As noted, while the total amount of waste disposed of in Michigan decreased, the amount imported from other states increased from 5 to 6 percent. So, while the total amount of waste disposed of in Michigan declined, due to a decline in the waste generated in Michigan and imported from Canada, the amount of waste being brought to Michigan from other states has increased.
The data discussed above is shown in the Chart 1 and Chart 2 below and has been provided from the Michigan Department of Environment, Great Lakes, and Energy.
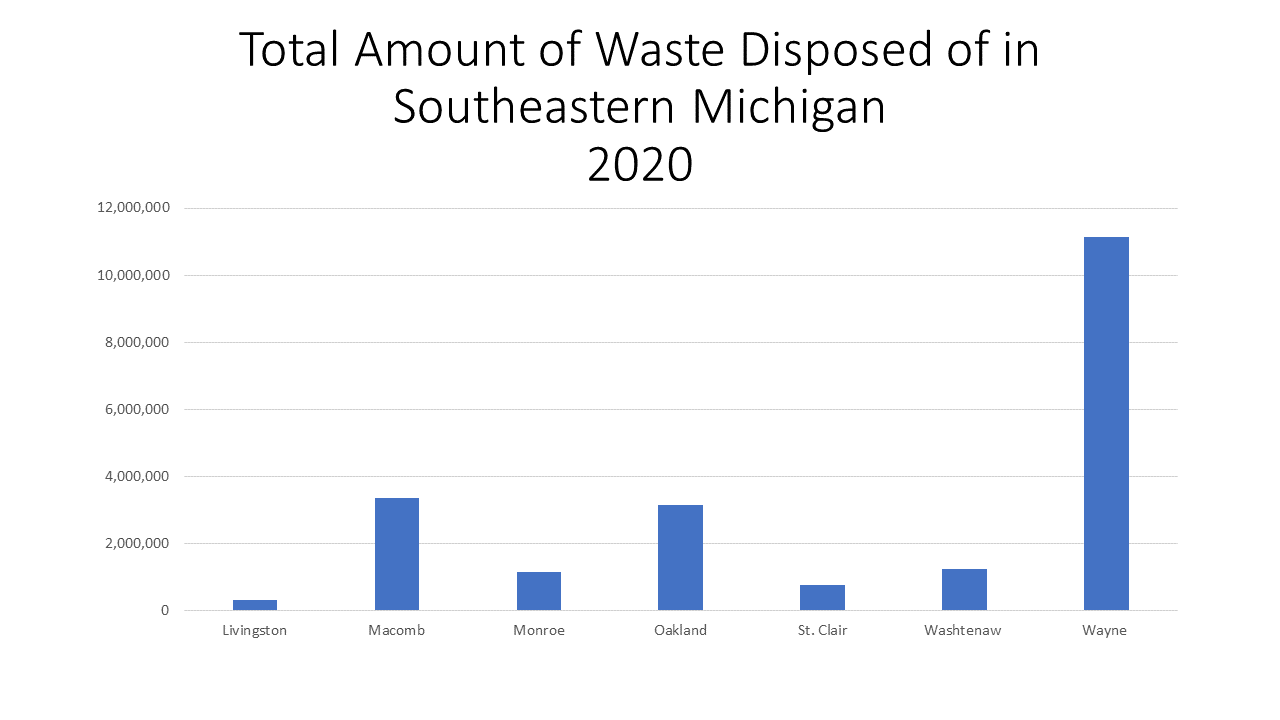
As noted, Michigan creates, and disposes of most of the waste in Michigan. Below we see how much waste was disposed of in each county in Southeastern Michigan. The chart below does not reflect the amount of waste created in each county, but rather disposed of, meaning waste from other counties, Canada and other states are included in the numbers below.
Wayne County had the highest amount of waste disposal at more than 11.1 million cubic yards in 2020. This was more than twice the amount of any other county in the region. Macomb County had the second highest amount of waste disposed in 2020 at about 3.3 million cubic yards. Livingston County had the lowest amount of waste disposed at about 330,000 cubic yards.
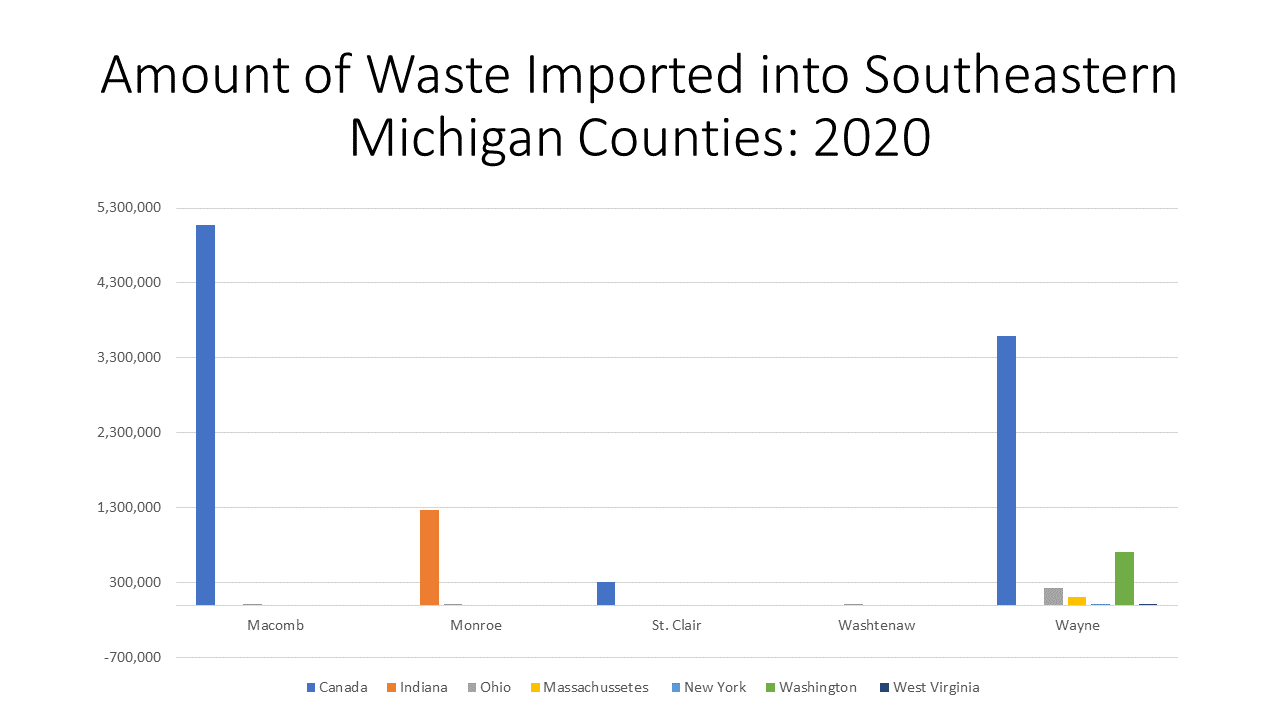
Wayne County not only had the highest amount of waste disposed of in it in 2020, it also had the highest number of importers. In 2020, there were six different places that imported waste into Wayne County. Canada imported the highest amount at about 3.6 million cubic yards, followed by Washington state and then Ohio. Of the counties in the region with imported waste, St. Clair County had the lowest amount of waste imported at about 305,000 cubic yards.
Overall, it is encouraging to see the total amount of waste being disposed of in Michigan has decreased, but it remains a concern that the State continues to allow outside states and countries to import their waste. This is especially concerning as the amount of waste being imported to Michigan from other states has been increasing, despite the total amount of waste being disposed of in Michigan is decreasing.
One of the many ways to combat climate change is to decrease the amount of waste we, as a society, produce. Ways to achieve this include reusing items, recycling and being mindful in our purchases and consumption.
Maternal deaths remain a concern, especially with Michigan’s maternal mortality rate at 16.4 per 100,000 live births in 2018, according to the National Center for Health Statistics, and the United States rate at 17.4 per 100,000 live births. As described in the Surgo Venture Maternal Vulnerability Index (MVI), there are many factors that contribute to maternal mortality rates including, but not limited to, accessibility, affordability and utilization of healthcare.
Health insurance plays an important role in a woman’s pregnancy, allowing for both the mother and unborn child to receive necessary care to ensure each individual remains healthy through regular checkups and addressing any issues that may be identified during the pregnancy.
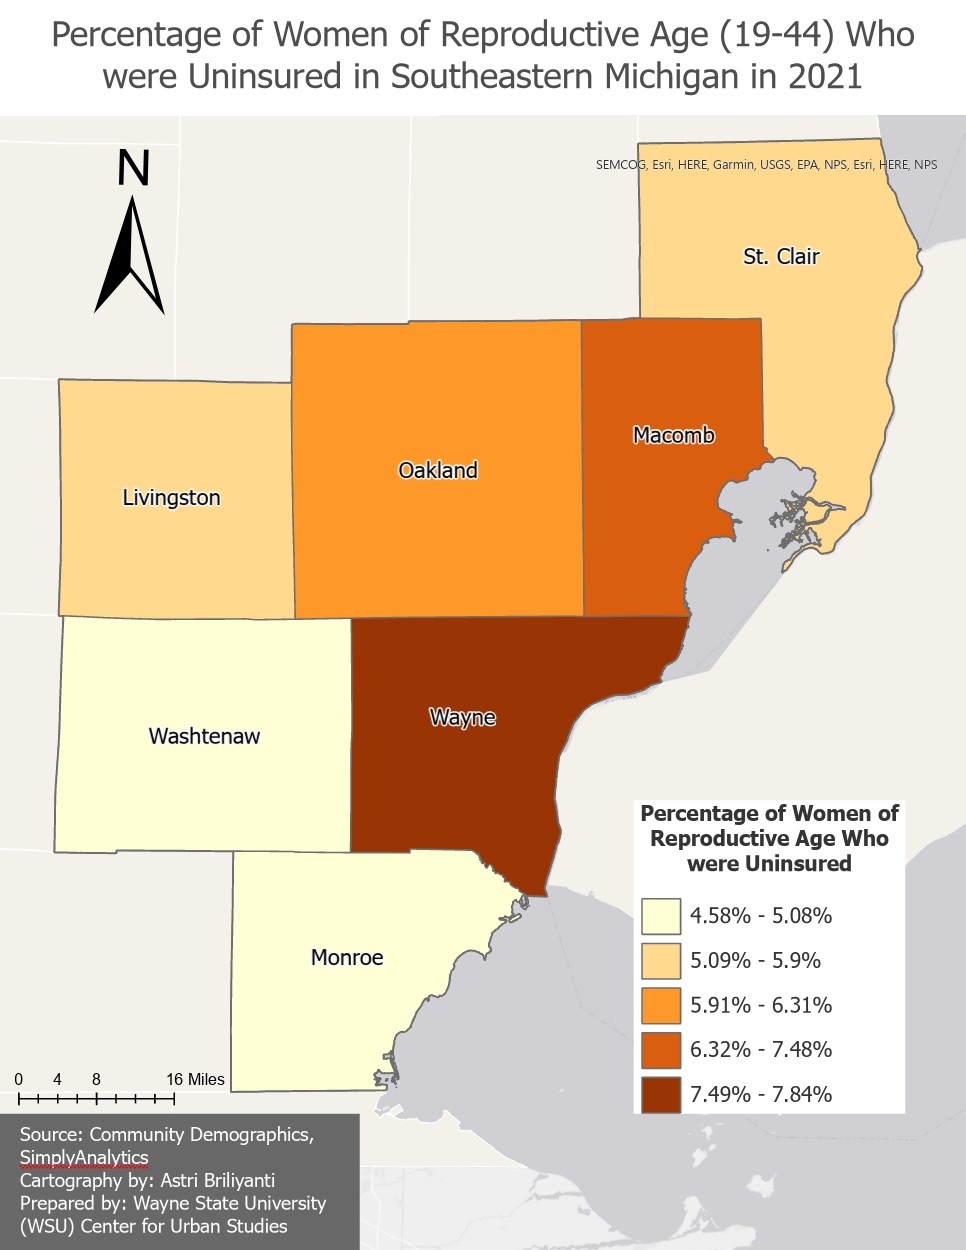
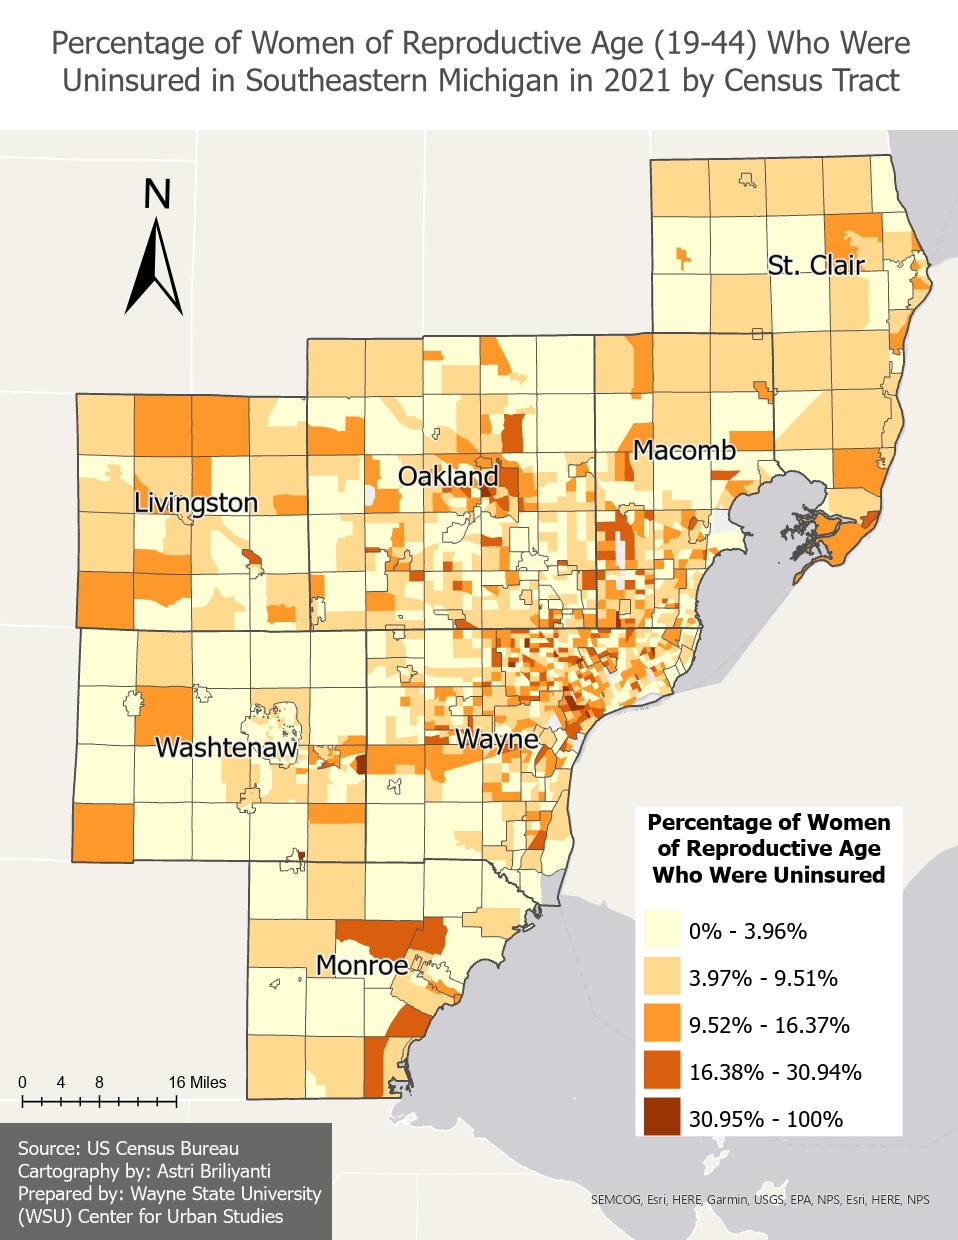
Wayne County has the highest percentage of women of childbearing age (19-44) who were uninsured at 7.8 percent, followed by Macomb County where 7.5 percent of women of childbearing age are uninsured. In Wayne County 203 of the 610 Census Tracts have 10 percent or more of women of childbearing age without health insurance and in Macomb County that number is 57 of the 217 Census Tracts. As the second map below shows, the Census Tracts with the highest percentage of women of childbearing age without health insurance are in Wayne County, with additional pockets in Macomb and Monroe counties, where more than 16 percent of women of childbearing age in a Census Tract are without health insurance.
Washtenaw County has the lowest percentage of women of childbearing age without health insurance at 4.6 percent.
As noted, this data set plays a role in determining where a county or state falls in the General Healthcare Sub-Index of the MVI, which is one of six sub-categories that explores the factors that impact maternal mortality rates and maternal health in general. In Southeastern Michigan, St. Clair County has the highest vulnerability index at 45 while Washtenaw County has an index of 0, meaning there is ease in access to and affordability of healthcare for reproductive age women. Michigan has a General Healthcare Sub-Index of 29.
The fact that Washtenaw County has the lowest percentage of women of childbearing age without health insurance explains, in part, why it also has the lowest General Healthcare Sub-Index of the MVI. However, St. Clair County has the highest General Healthcare Sub-Index of the MVI in Southeastern Michigan but has the fourth lowest percentage of women of childbearing age without health insurance in the region (5.1 percent).
So, while access to and utilization of healthcare is a vital aspect in keeping maternal deaths low, it certainly is not the only factor. Other factors include mental health, substance use, socioeconomic status, education levels and more. We will further dig into these factors to see what factors impact the areas of Southeastern Michigan the most.