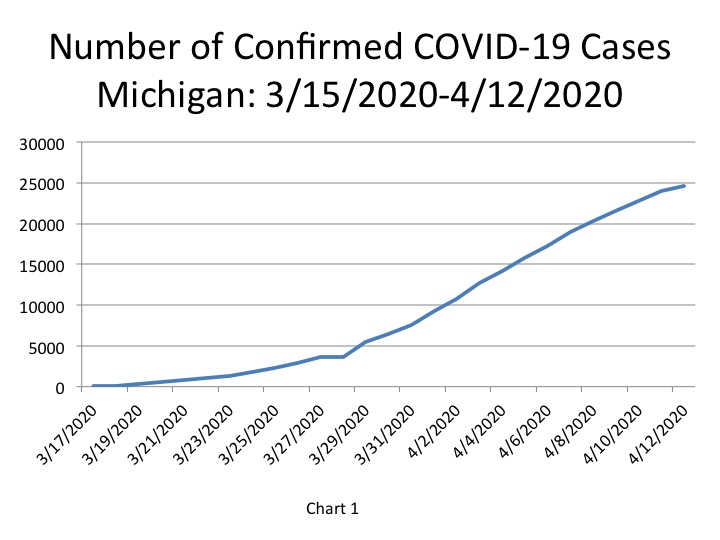
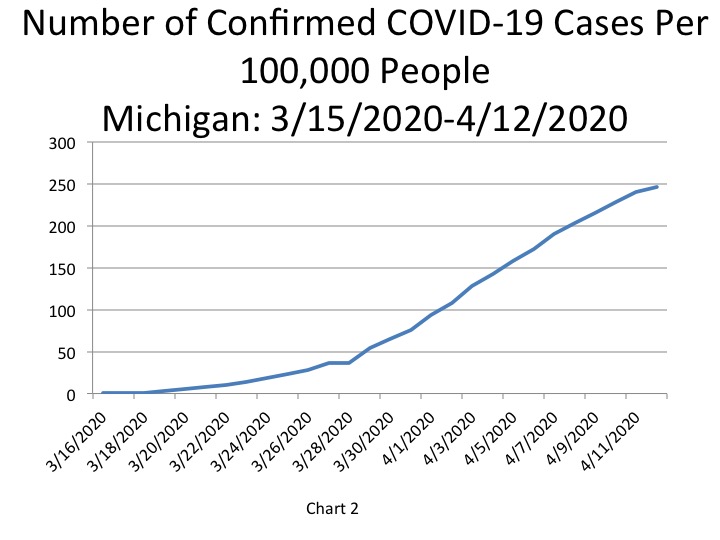
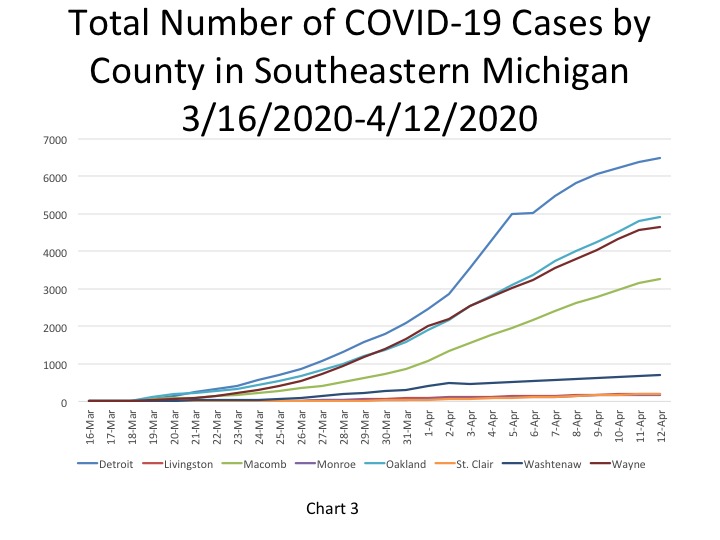
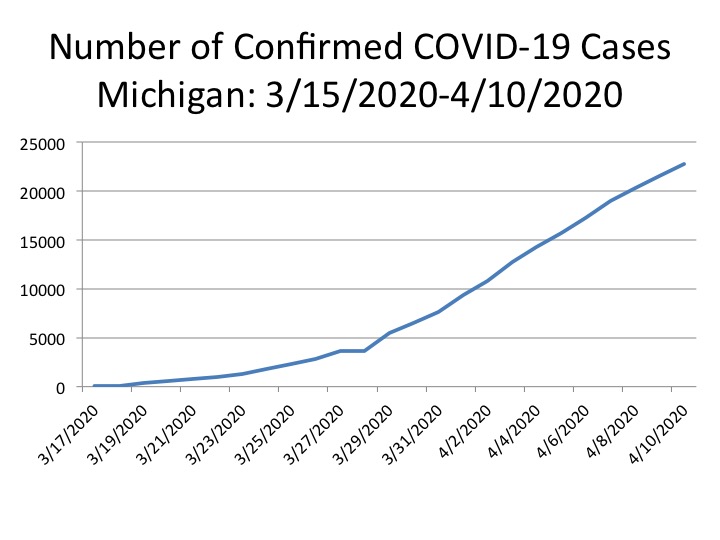
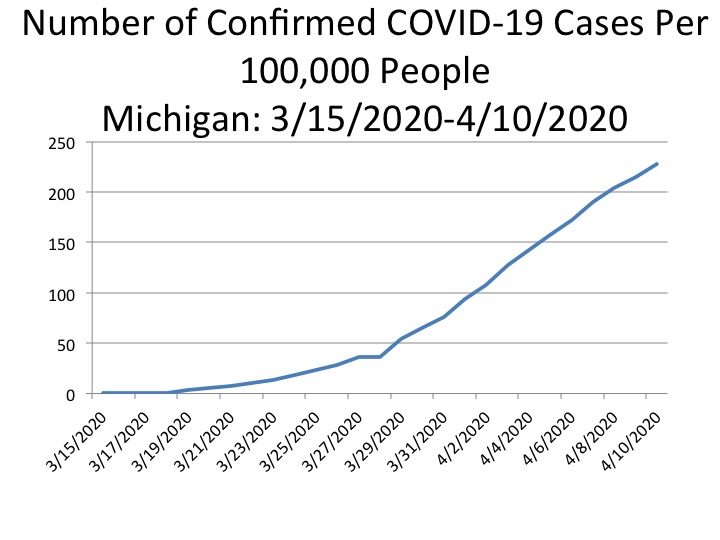
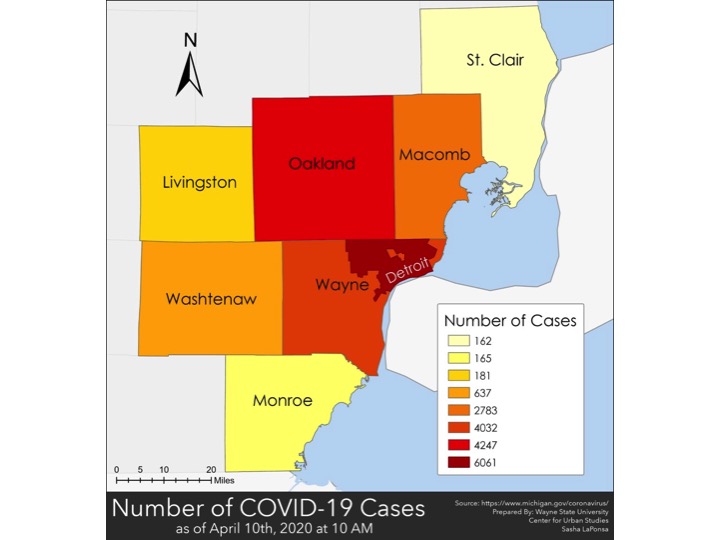
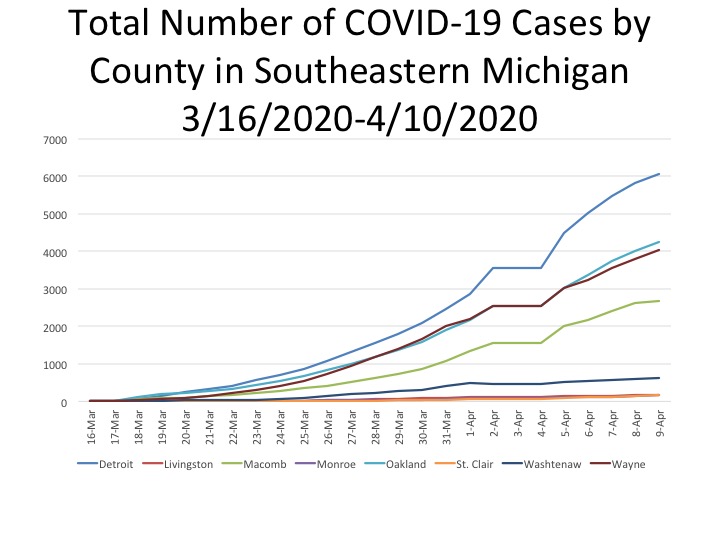
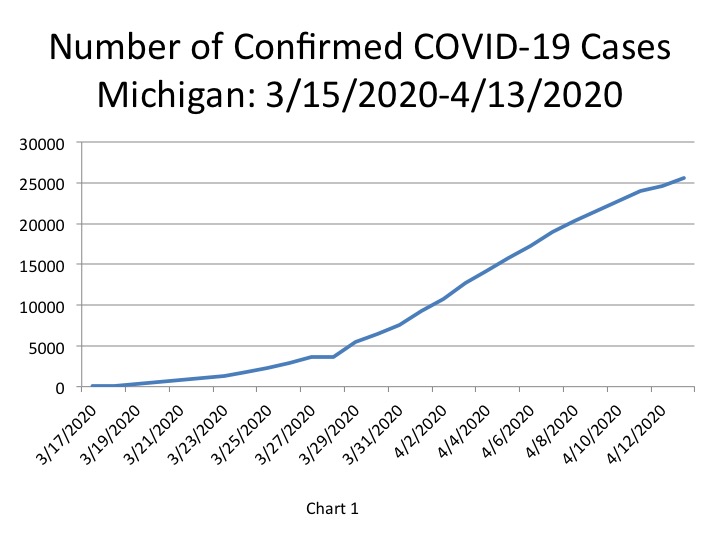
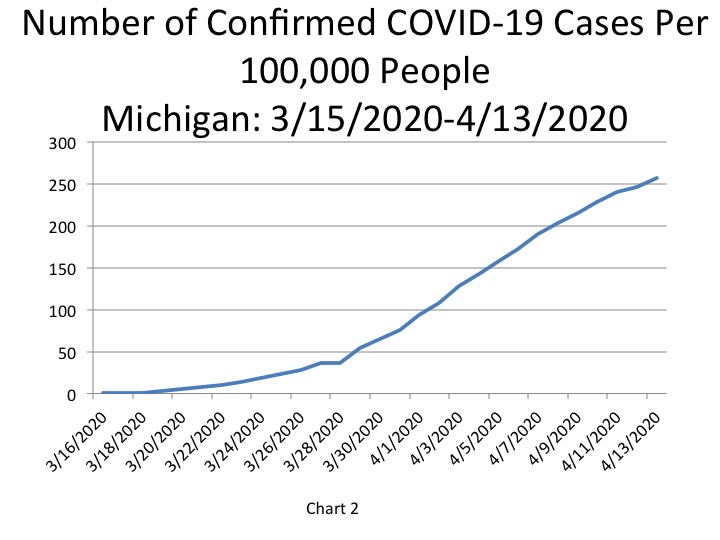
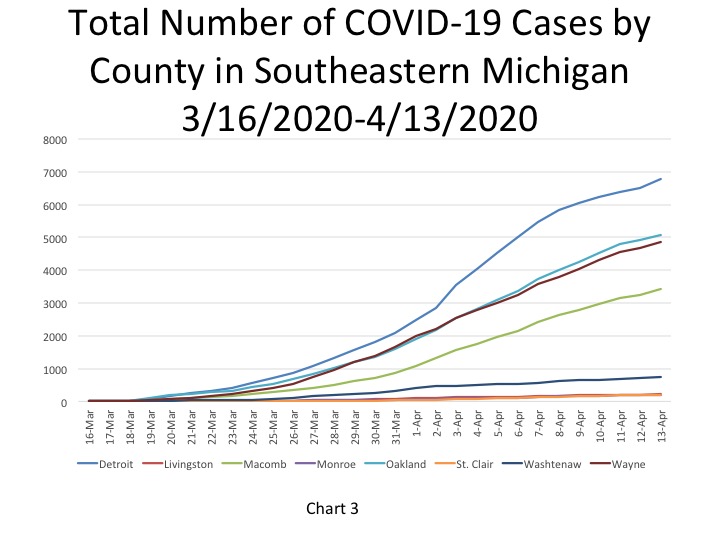
Yesterday, Gov. Gretchen Whitmer announced that it appeared the COVID-19 curve may be flattening, but we are not there yet. On April 13 the total number of COVID cases increased to 25,635 (Chart 1), which was equivalent to 257 cases per 100,000 people (Chart 2). Of those 25,635 total COVID cases, the City of Detroit had 6,781 cases, Oakland County had 5,073 cases, Wayne County (excluding Detroit) 4,867 and Macomb County had 3,418 cases (Chart 3). The number of confirmed cases in Washtenaw, Livingston, Monroe and St. Clair counties combined totaled 1,357, with Washtenaw County accounting for 735 of those cases, according to the most recent data from the State.
Also, yesterday the State announced additional tests were becoming available, including to those with mild symptoms who have just been told to stay home. As these tests become available there may very well lead to continued upticks in the number of cases.
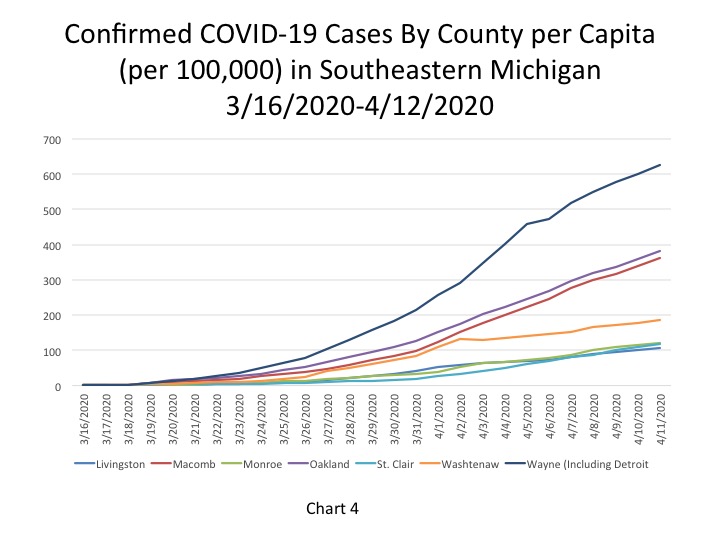
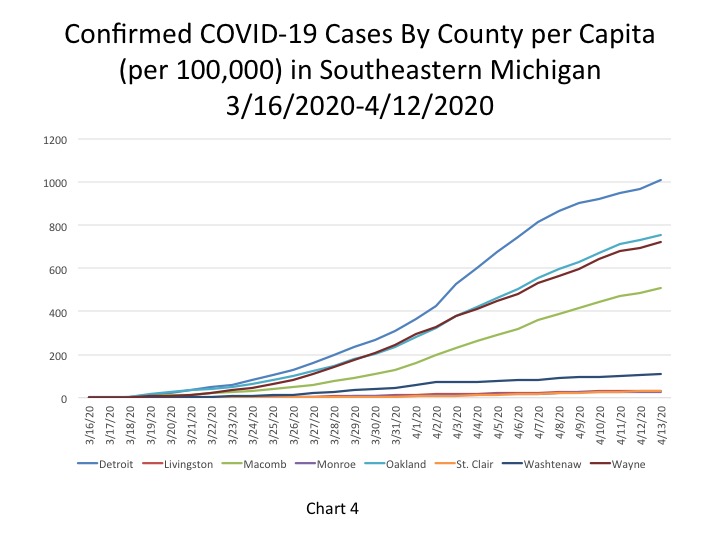
In Chart 4 we see that the City of Detroit has consistently had the highest number of COVID cases per 100,000 people. On April 13 Detroit had 1,008 cases per 100,000. Oakland County had the second highest rate at 754 cases per 100,000 people and Wayne County (excluding Detroit) had 724 cases. Macomb County had 508 COVID cases per 100,000 people.
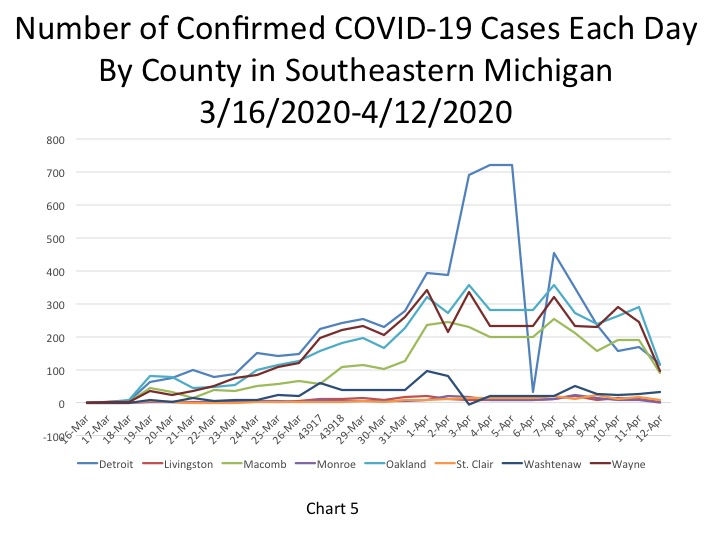
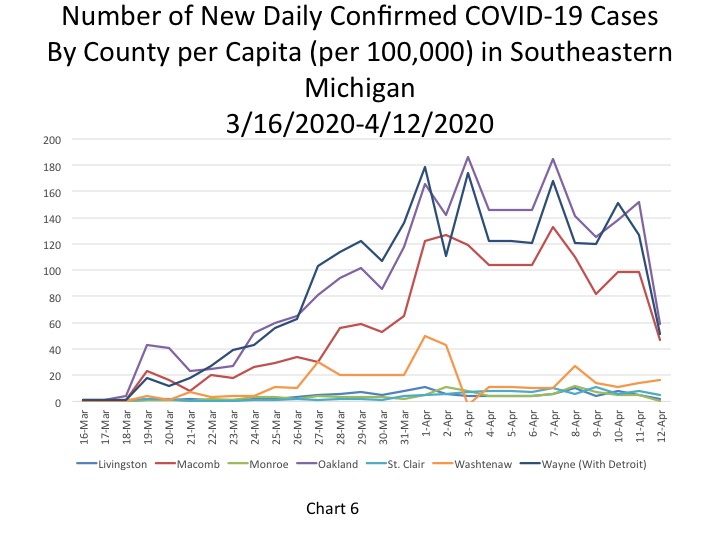
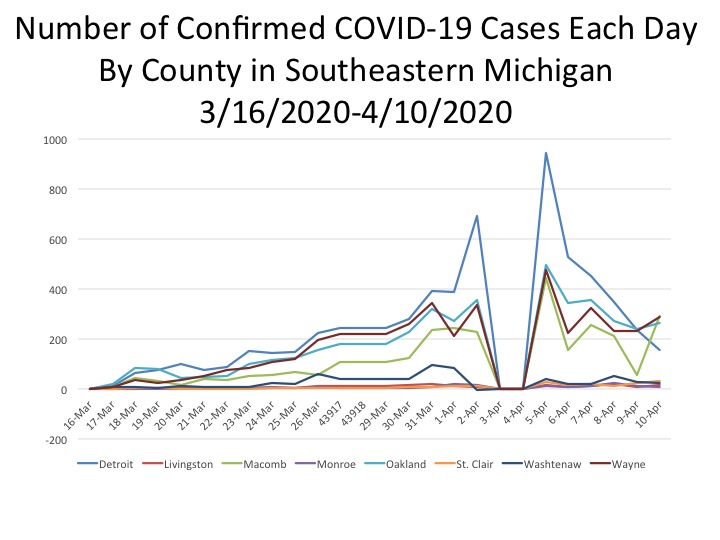
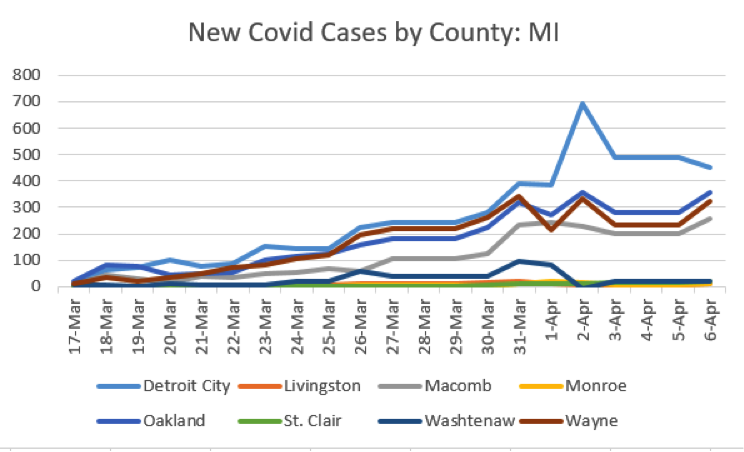
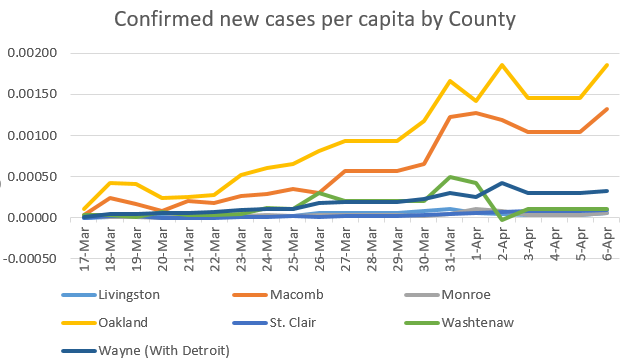
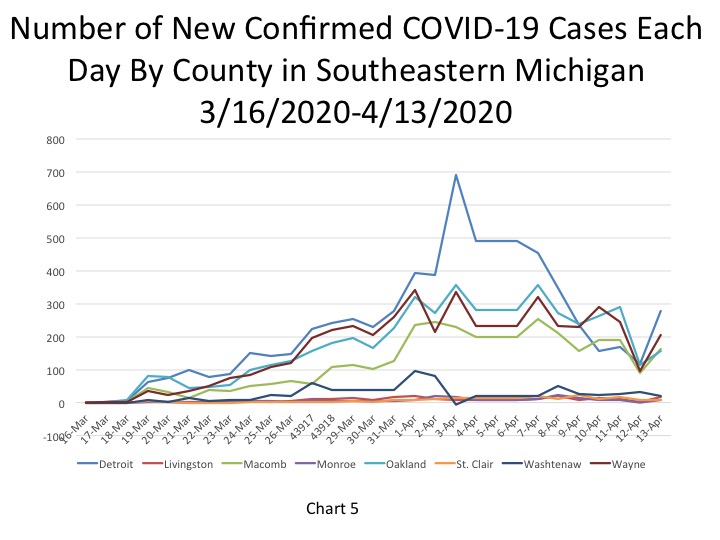
While the total number of cases per capita continues to rise, in Chart 5 and Chart 6 we see that the new COVID cases each day do not consistently increase. On April 13, Washtenaw and St. Clair counties experienced a decrease in the number of new cases, while the other five counties and Detroit experienced increases (Chart 5). Detroit experienced the highest increase at 279 new cases for April 13 and Wayne County had 205 new cases. (The relatively erratic pattern of these data partially reflect variation in how much testing is done and reported on weekends.) The per capita data, Chart 6, shows a similar pattern, with Detroit having the highest per capita for new cases at 41.5 COVID cases per 100,000. Wayne County had 19 new COVID cases per 100,000 people, Macomb County had 18.8 new cases per 100,000 people, and Oakland County had 12.6 cases per 100,000 people.


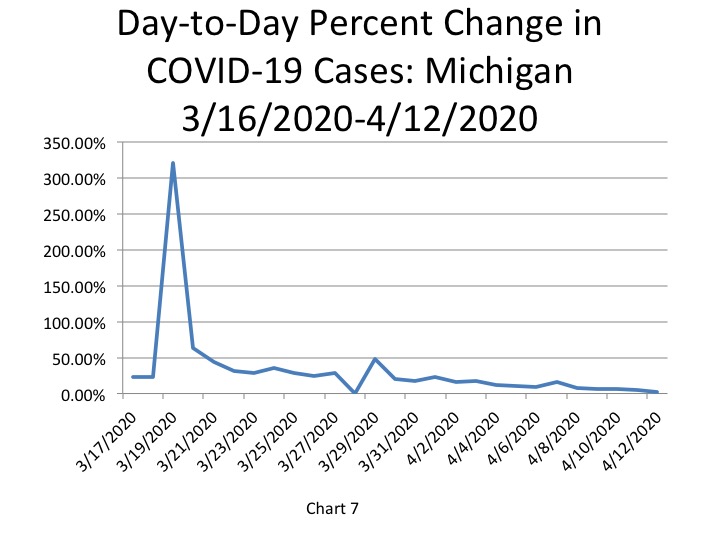
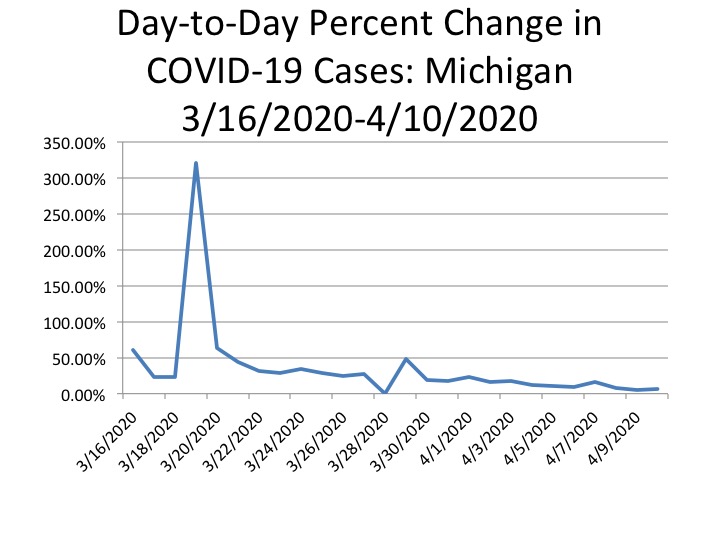
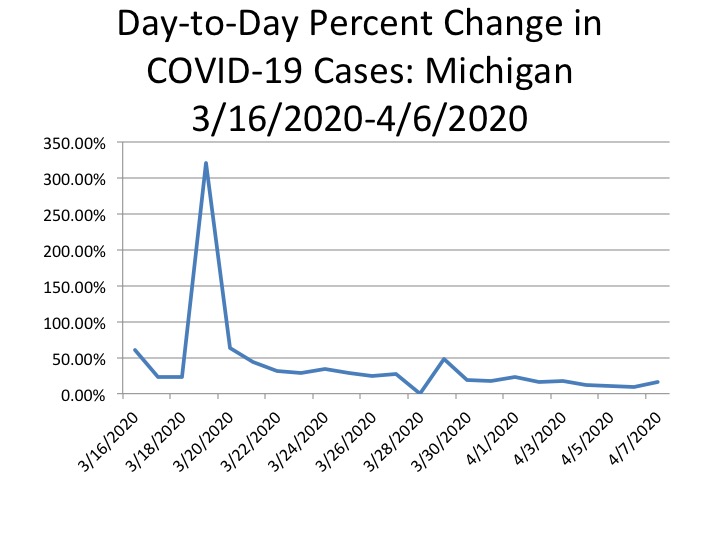
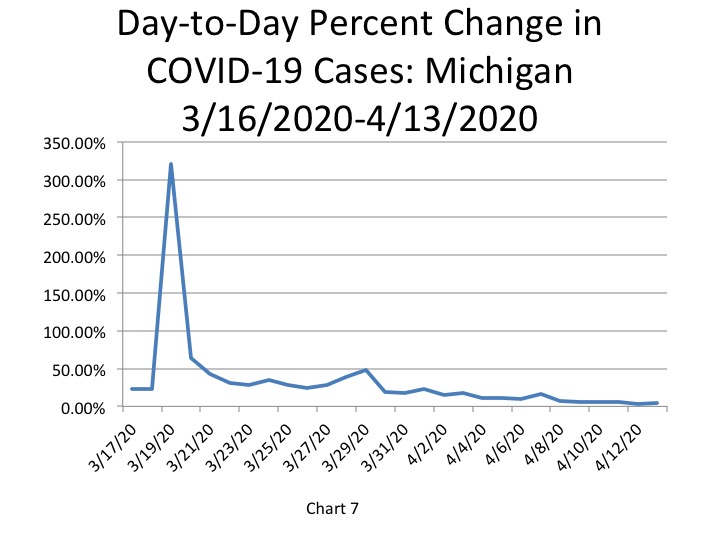
In addition to the raw data of confirmed cases, we also show the percent change in the number of cases reported day-to-day. The largest percent change thus far reported was on March 19 at 320 percent-this increase was also likely related to an increase in the number of available tests. Also the 0 percent change on March 28 reflects that the data reported from the day prior did not change; it is unlikely that no new cases were reported that day. On April 13 the percent change from April 12 was 4 percent, an increase from the day’s prior change of 2.6 percent.
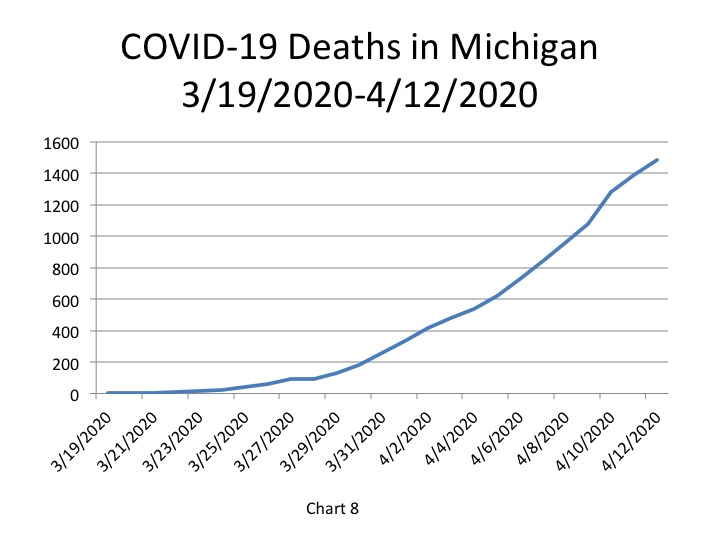
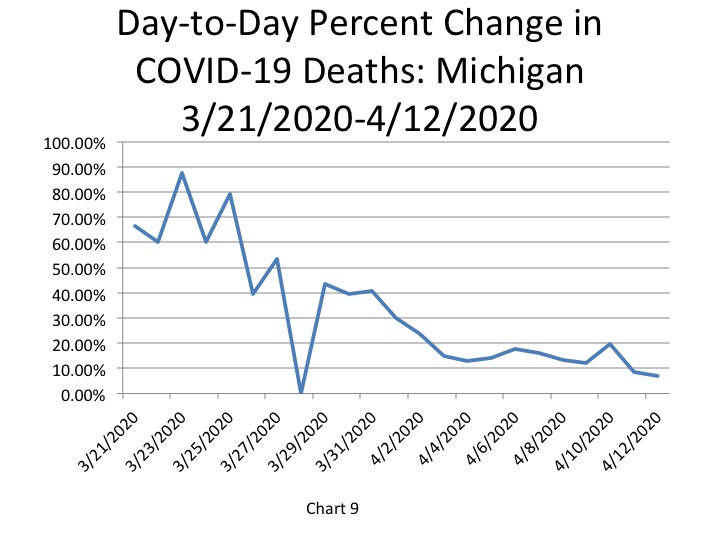
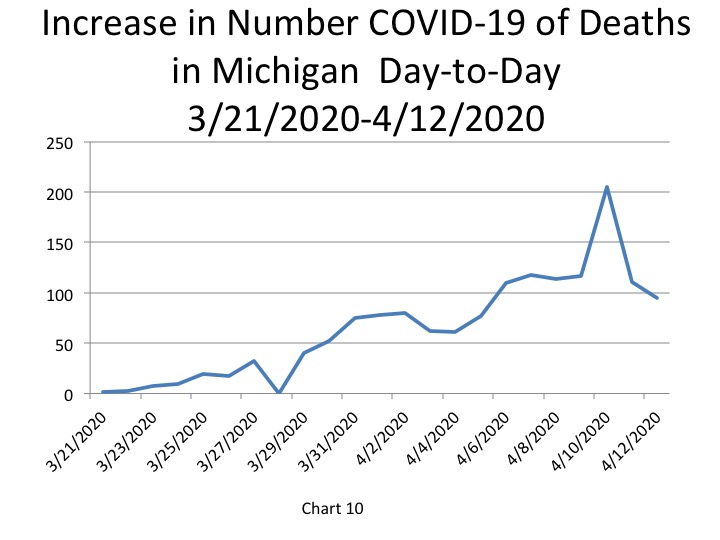
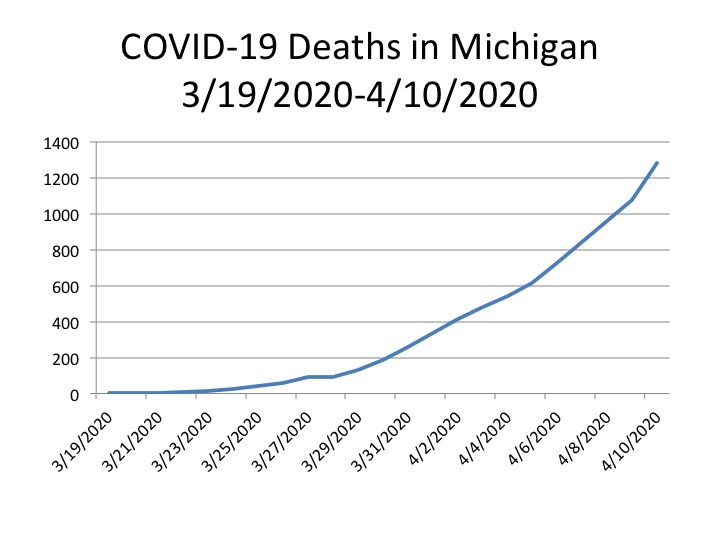
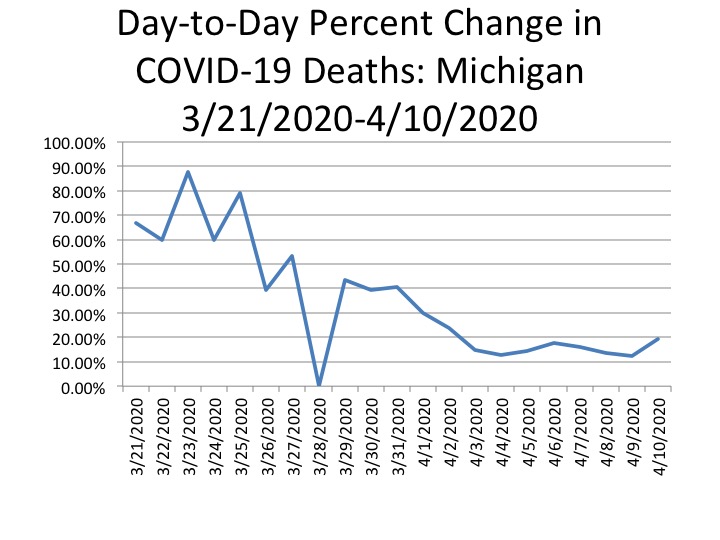
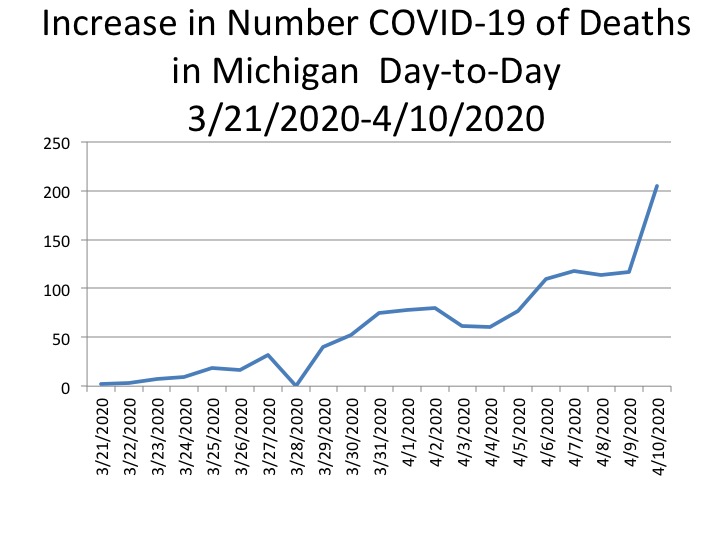
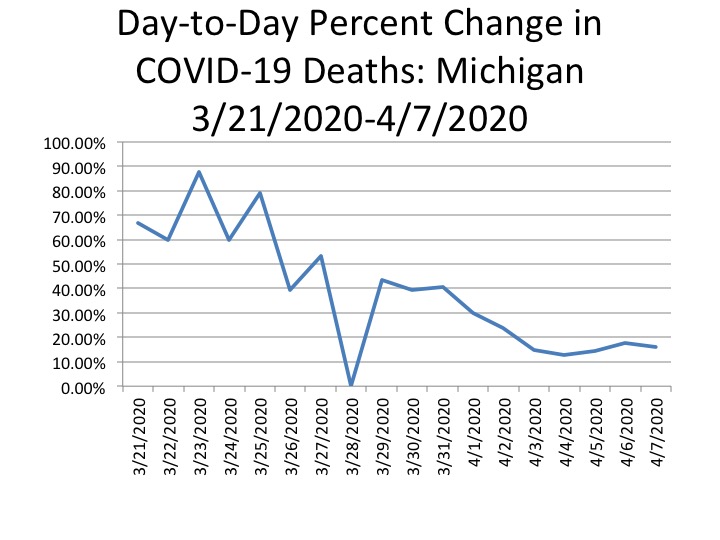
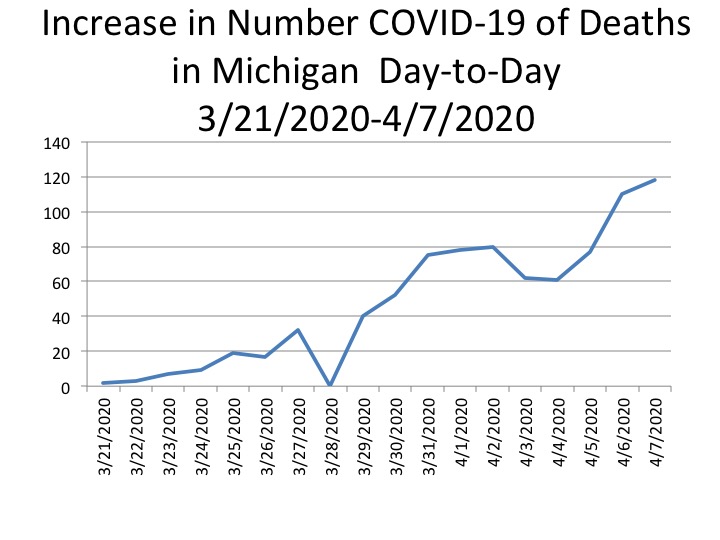
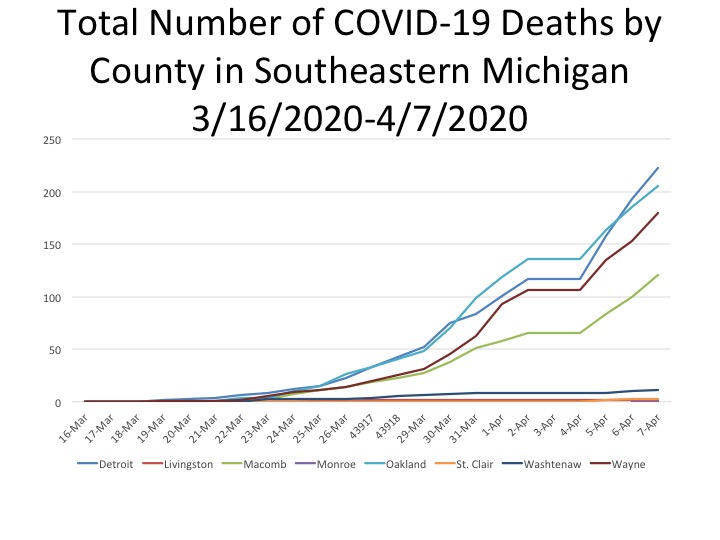
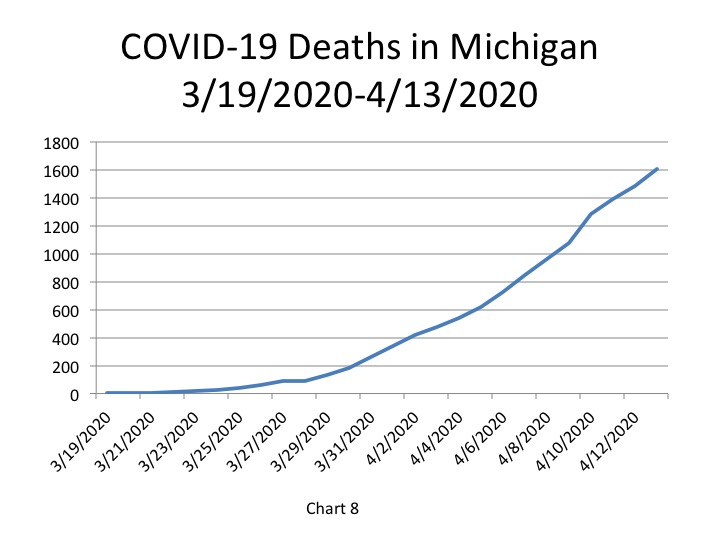
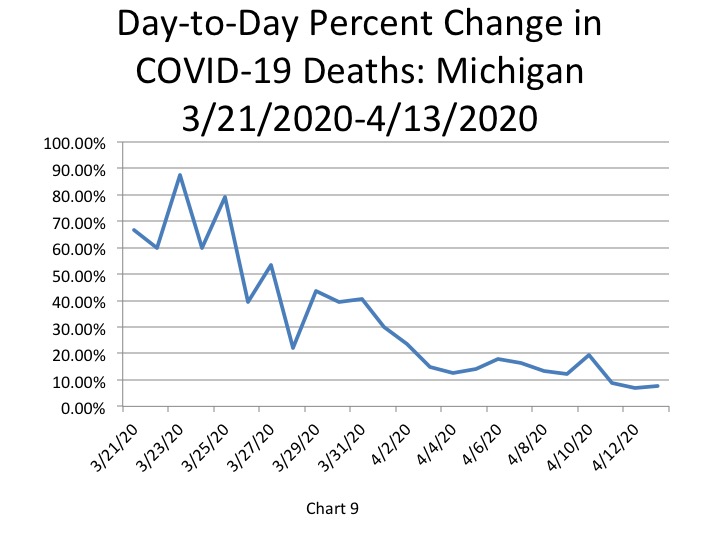
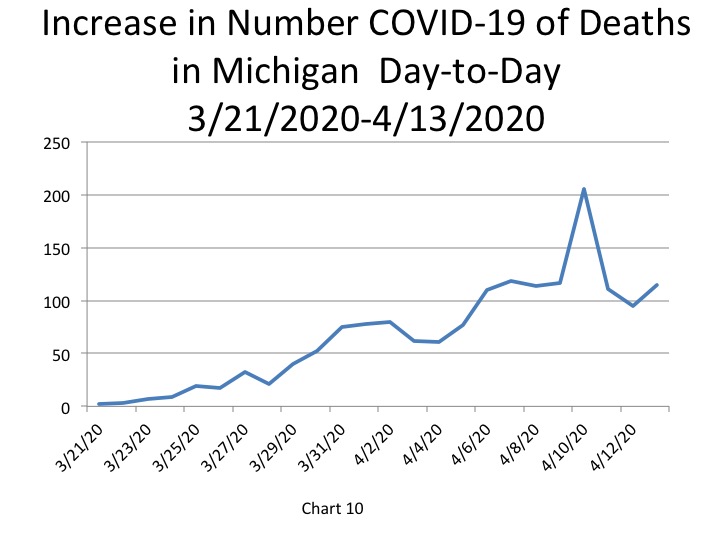
It was reported by the State of Michigan that on April 13 the total of COVID-19 deaths reached 1,602. This was a percent change of 7.7 percent from April 12, which was an increase from the 6.8 percent increase of the day prior (Chart 9).** The 1,602 total deaths reported for April 13 was 115 deaths higher than what was reported on April 12 (Chart 10). The 115 new deaths reported on April 13 was an increase in total daily deaths.
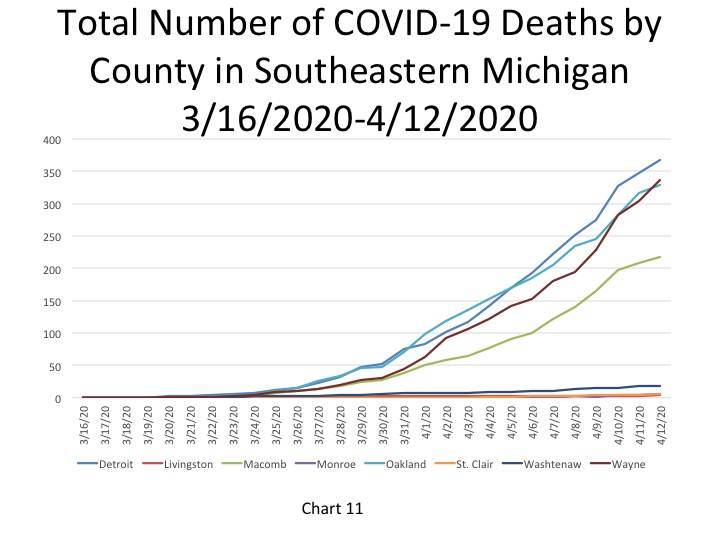
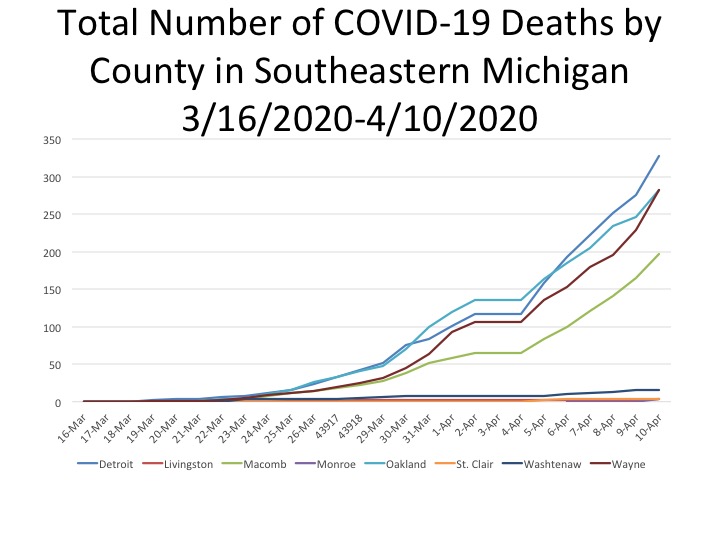
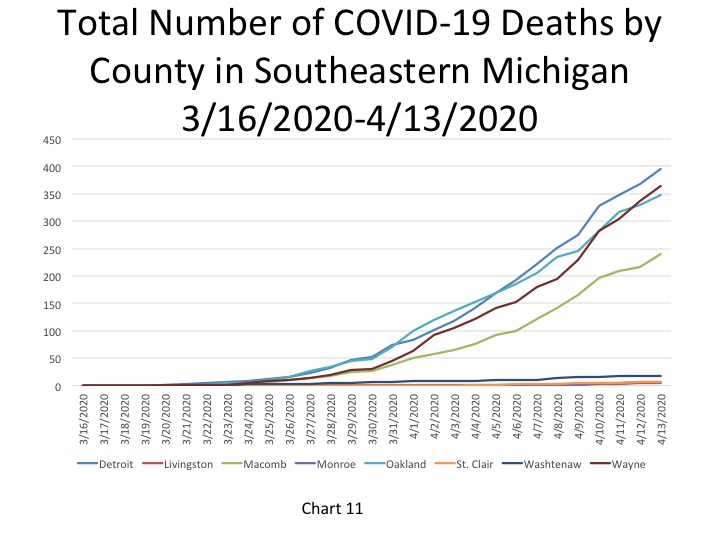
Of the total deaths reported, Detroit continues to make up the majority of those deaths. On April 13 the Michigan Department of Health and Human services reported there were 396 total deaths in the Detroit-the highest total number of deaths in one city or county in the state. Wayne County, excluding Detroit, continued to have a higher number of total deaths than Oakland County. On April 13 there were 365 COVID deaths in Wayne County and 347 deaths in Oakland County (Chart 11)
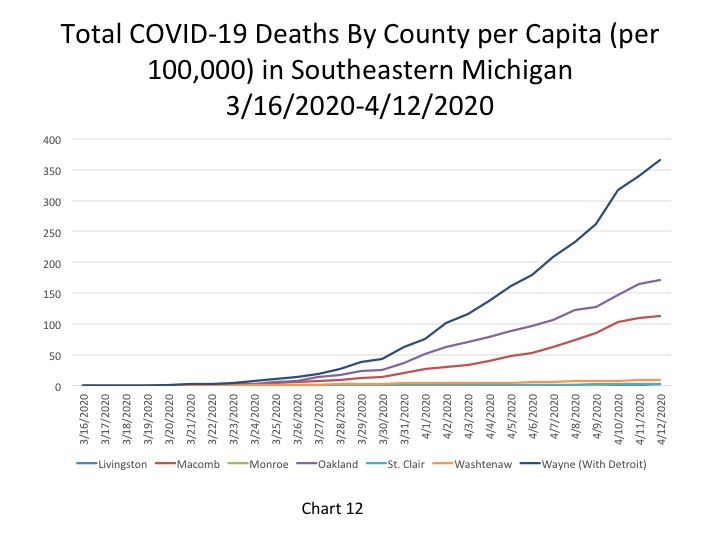
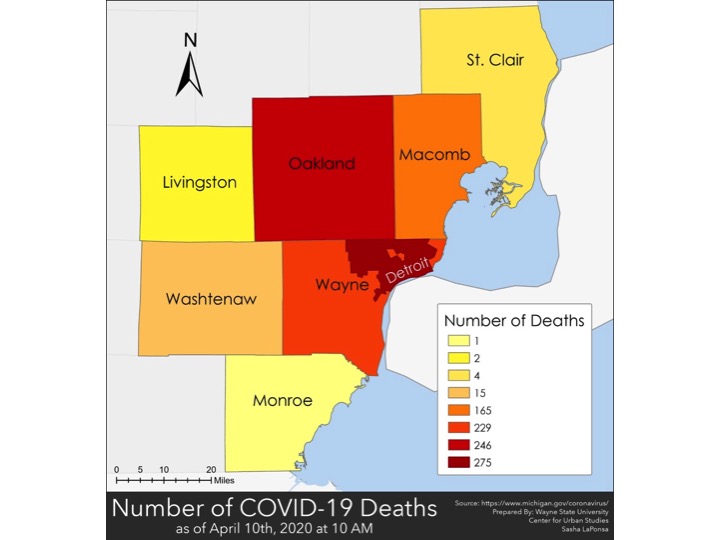
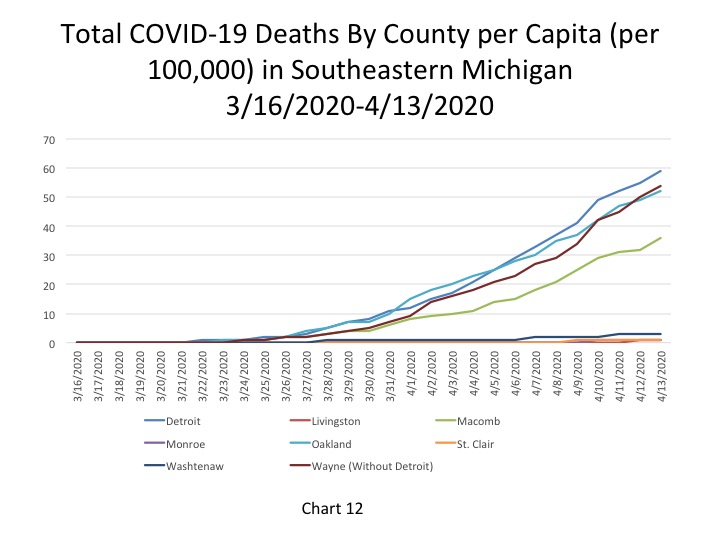
On a per capita basis, per 100,000 people, Detroit also continues to have the highest number of deaths per capita at 59 (Chart 12).
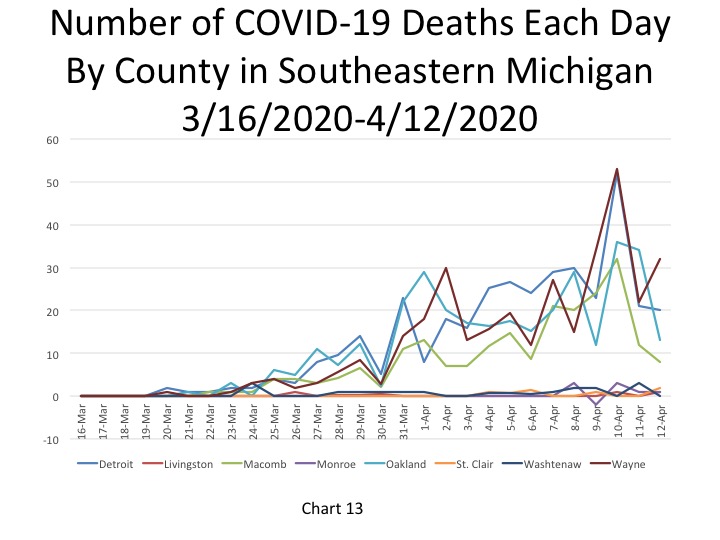
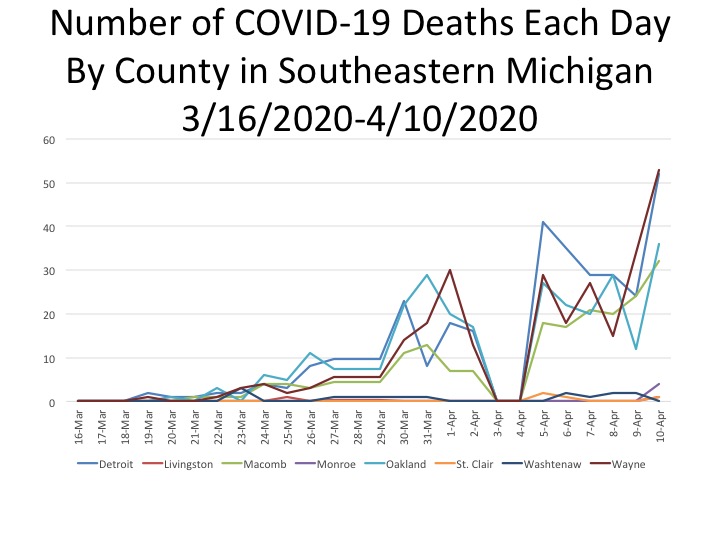
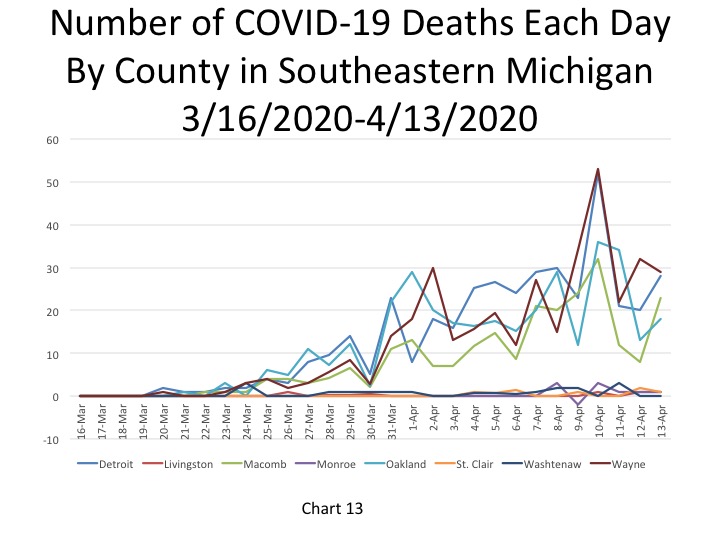
When looking at the total number of daily deaths, Wayne County had the highest for April 13, despite it experiencing a decrease. On April 13, there were 29 new COVID deaths reported in Wayne County and 28 in Detroit. Macomb County had 23 deaths and Oakland County had 18 deaths on April 13.
The overall numbers of COVID cases and deaths continue to rise, but when looking at the new daily cases and deaths the daily changes don’t show a consistent increase. We must remember testing does contribute to this, and numbers may increase regularly due to the additional tests the State announced will soon be available. However, as Gov. Whitmer said, it does appear the curve is starting to flatten, though this pattern is inconsistent even across the counties of Southeastern Michigan.