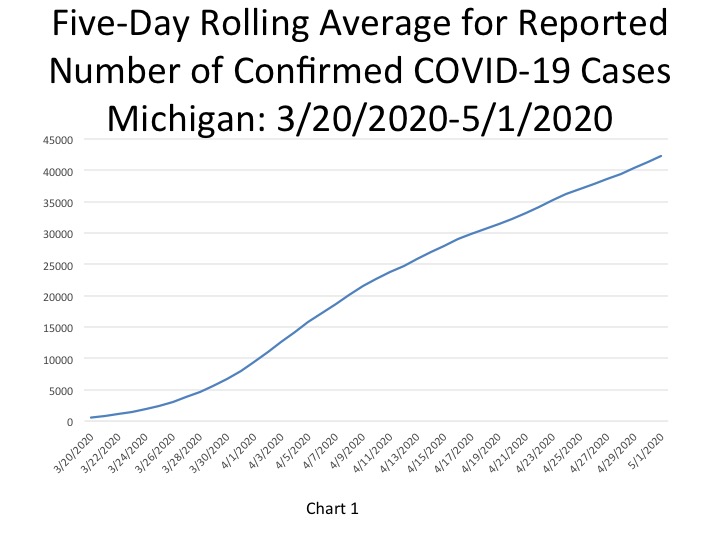
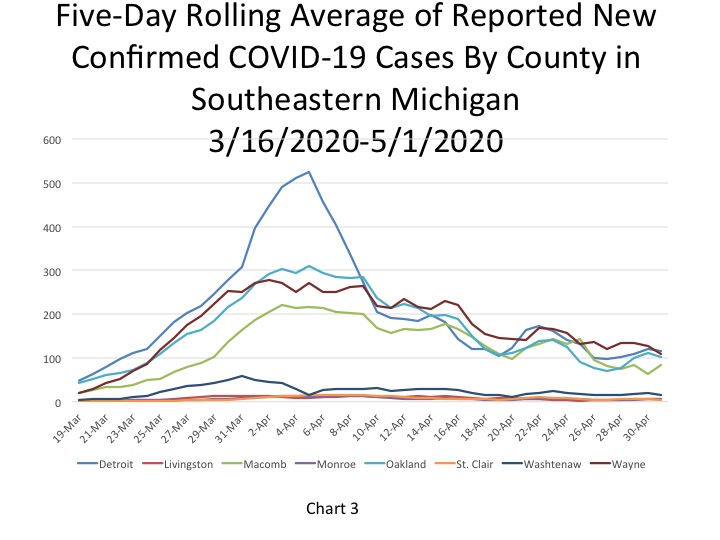
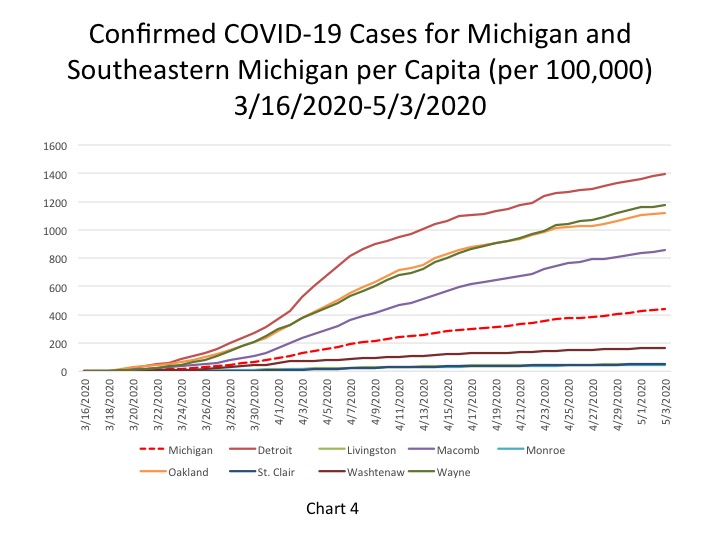
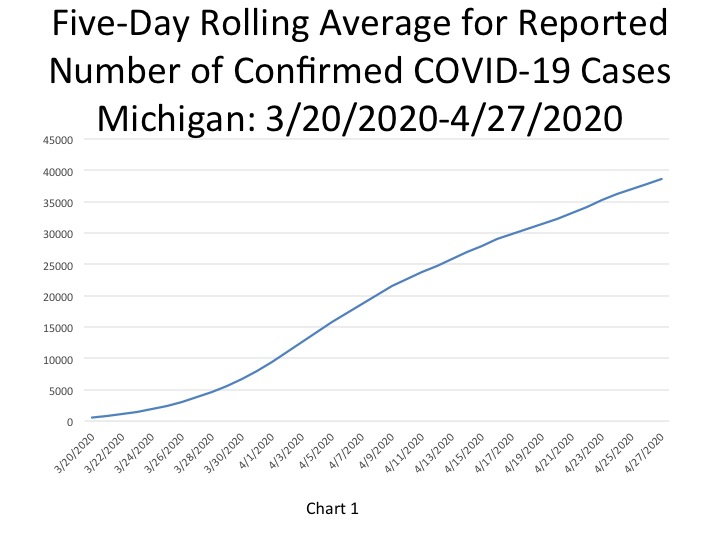
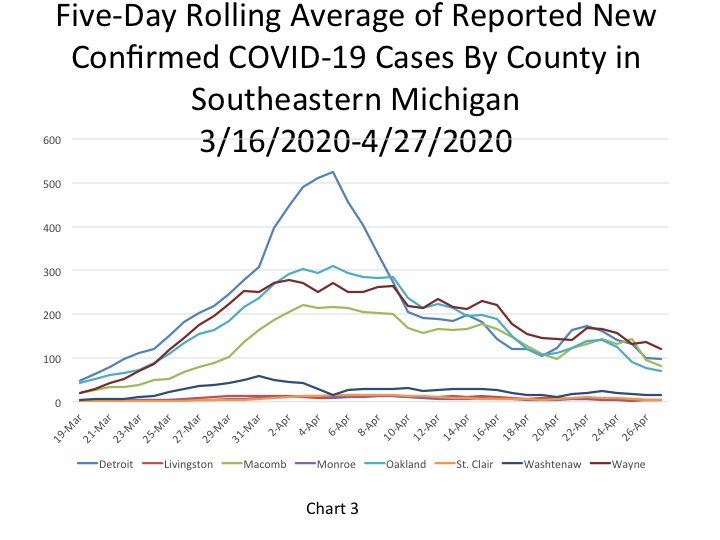
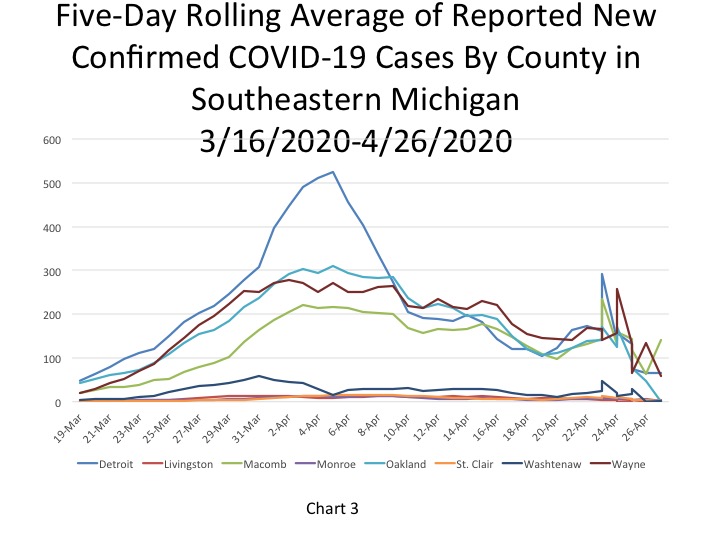
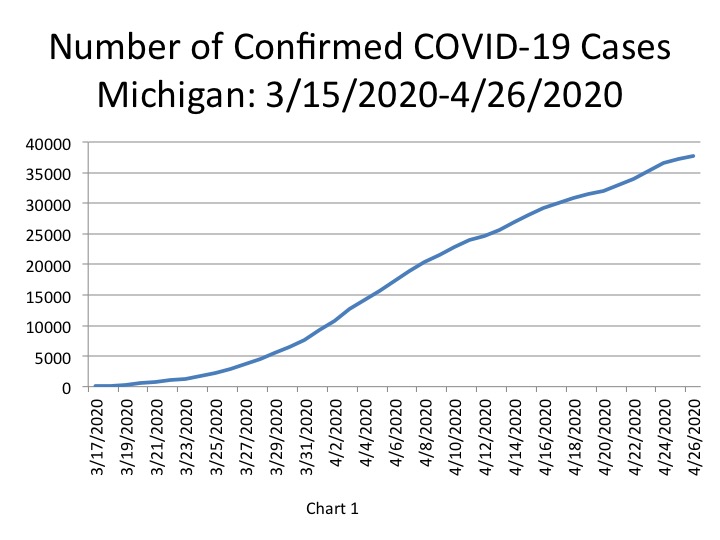
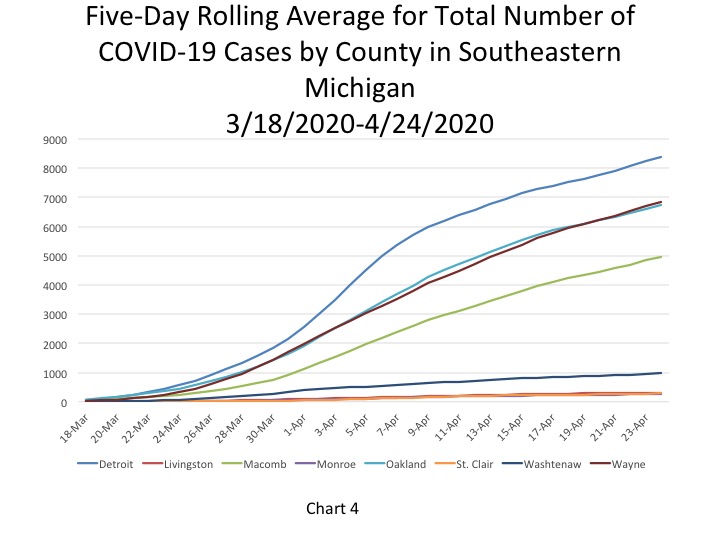
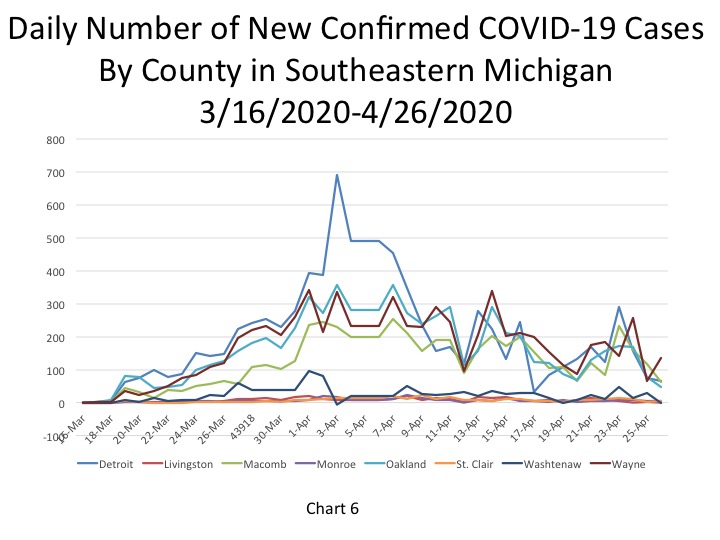
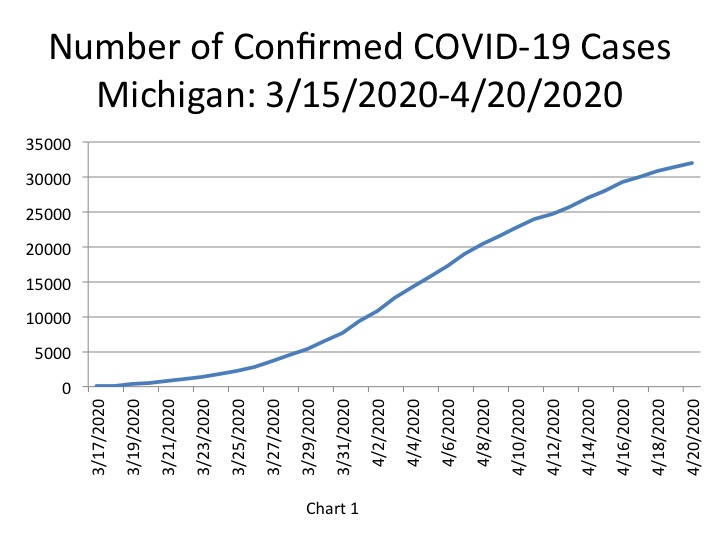
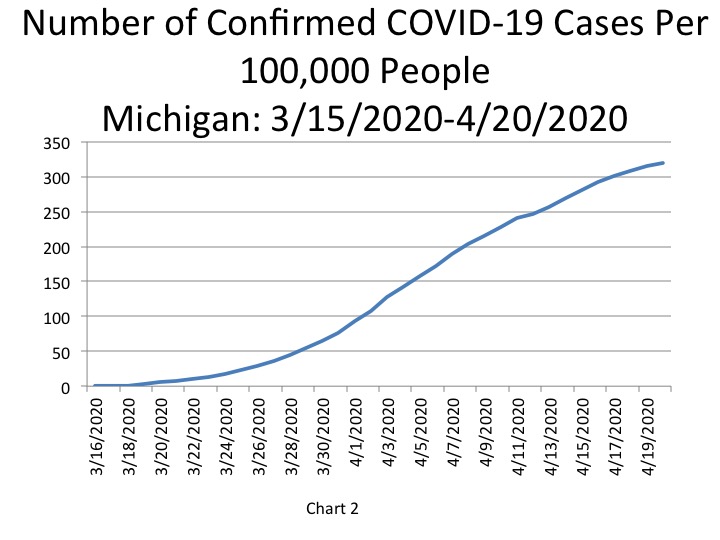
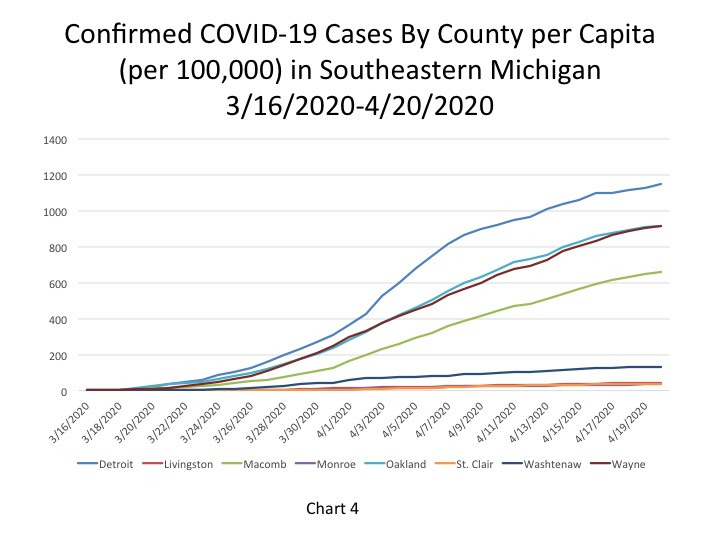
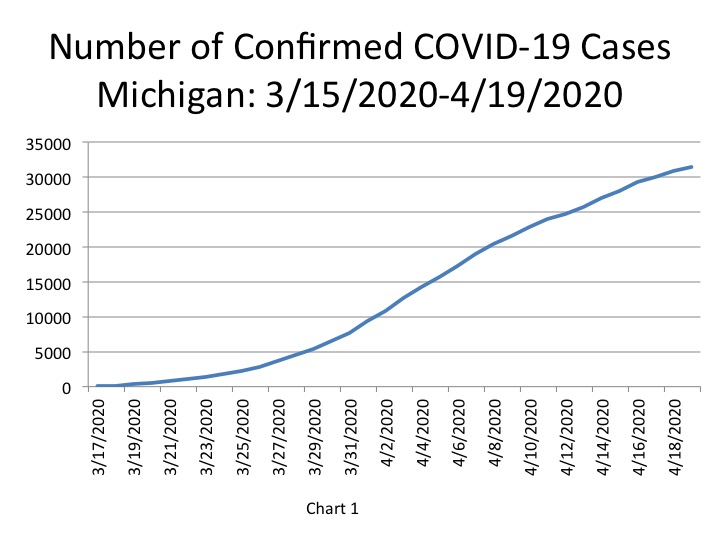
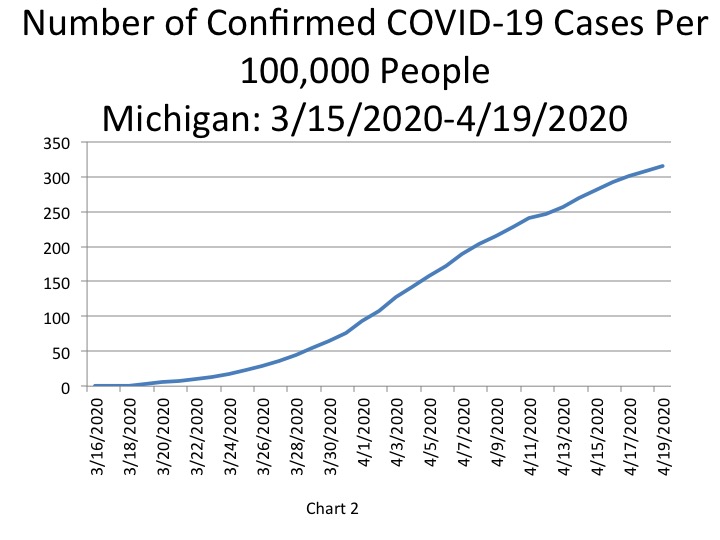
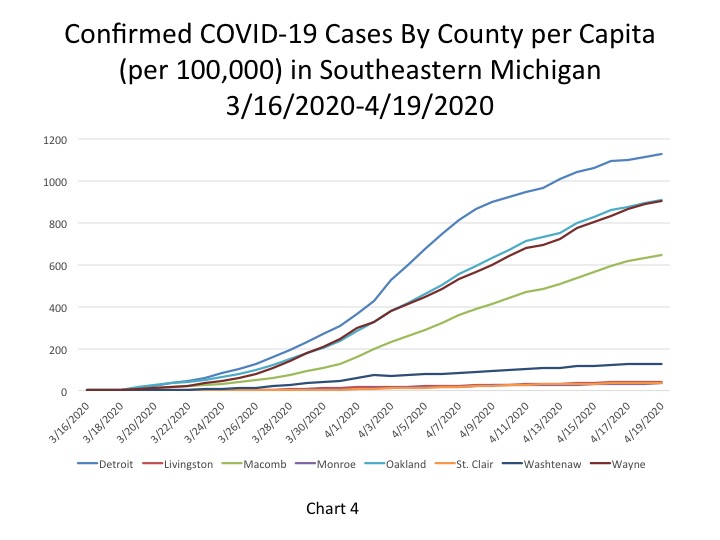
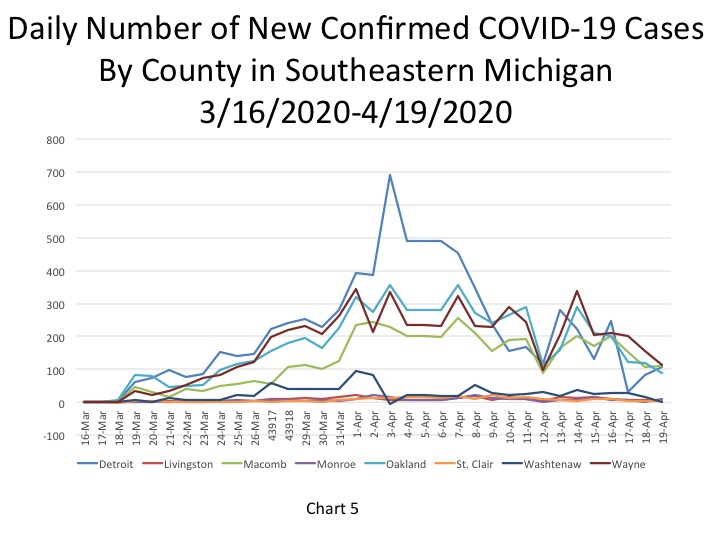
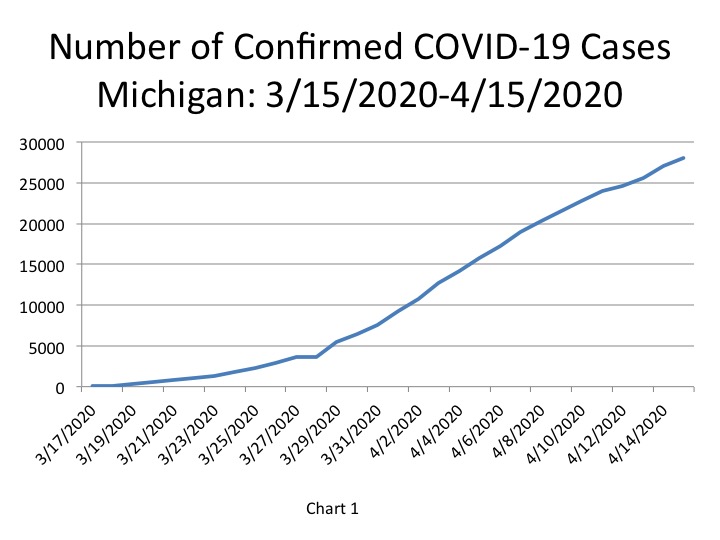
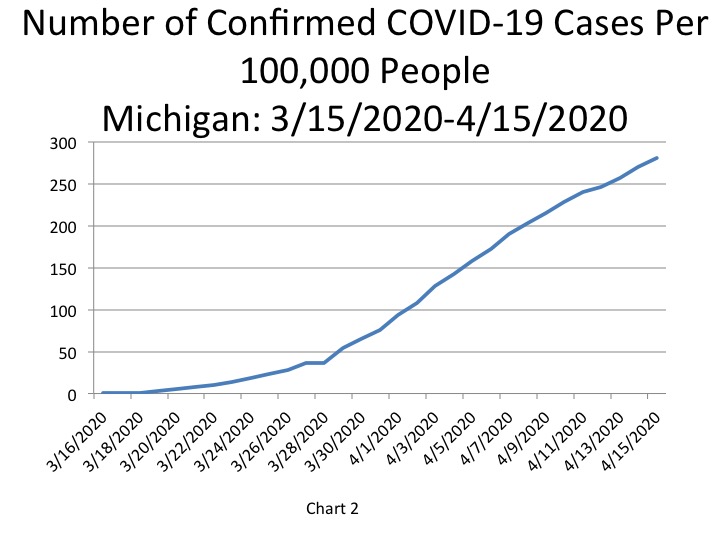
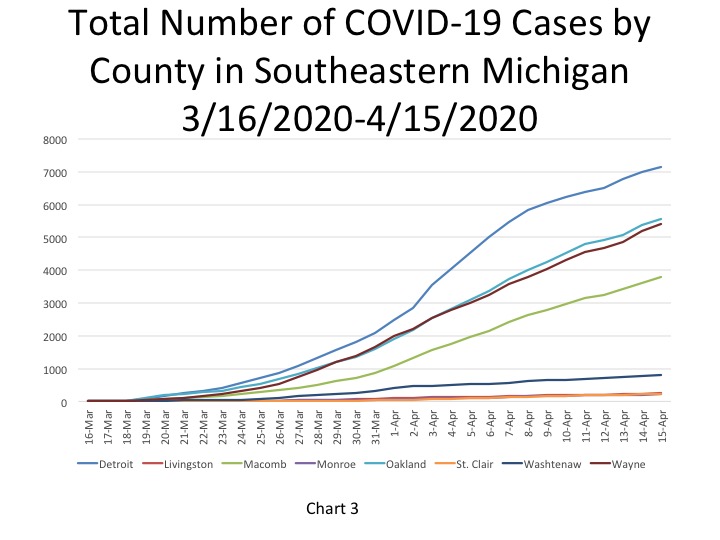
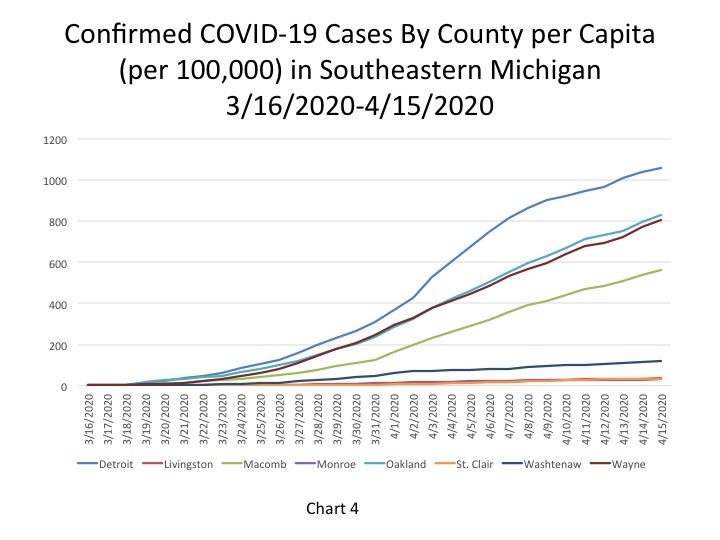
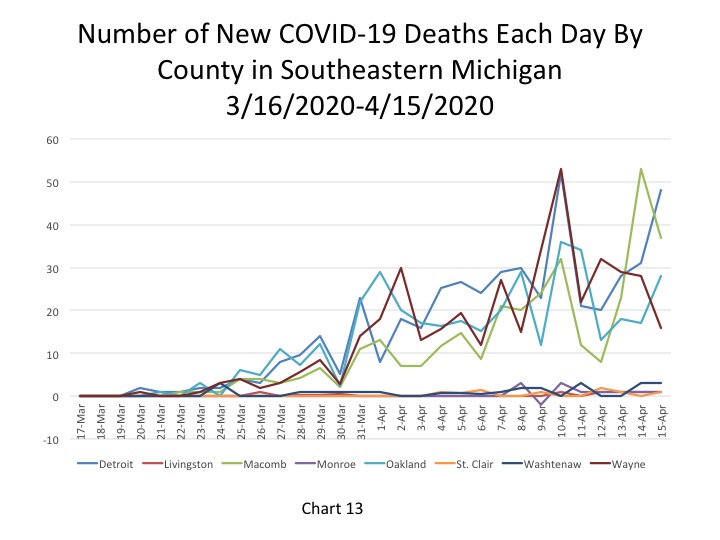
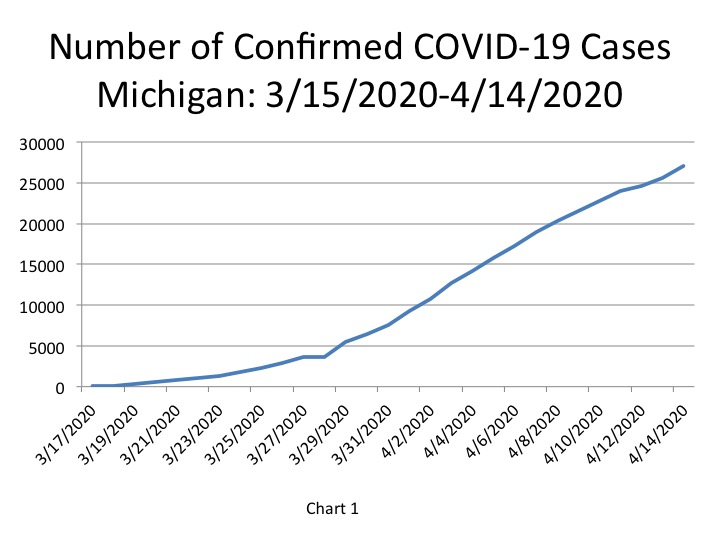
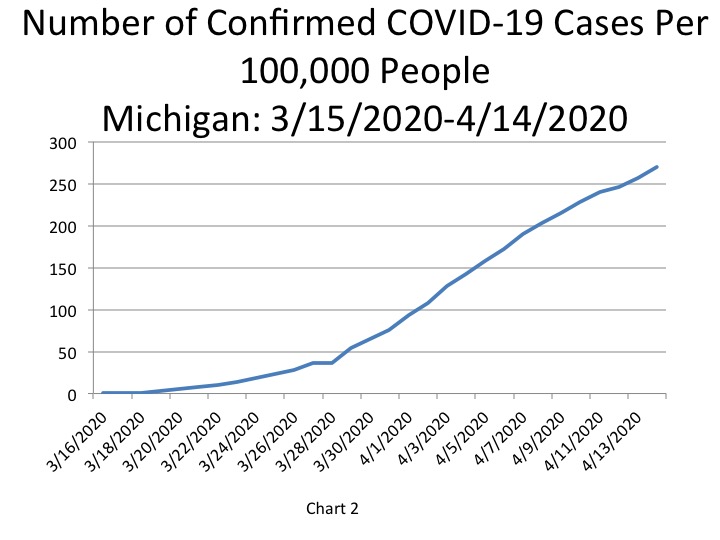
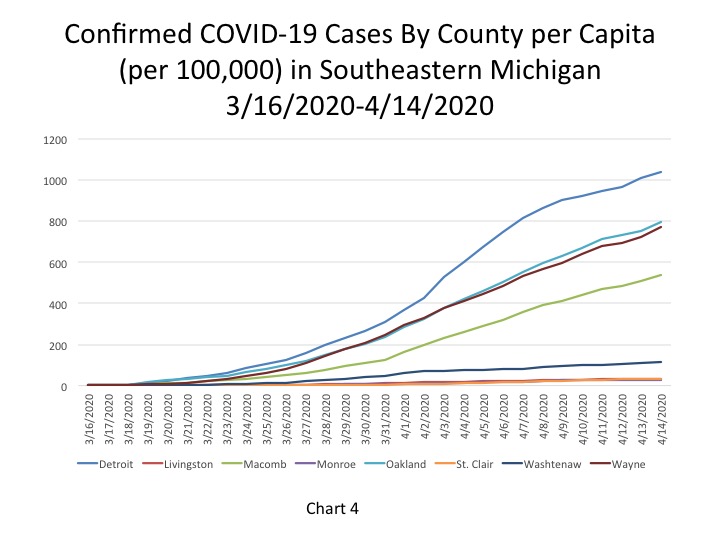
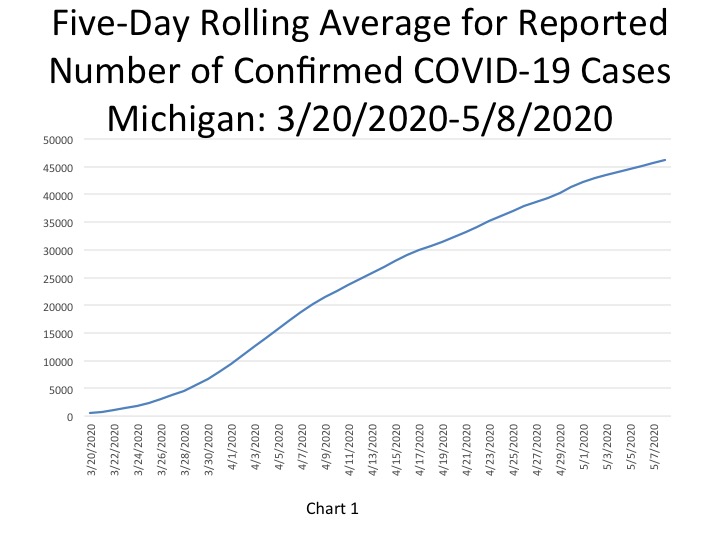
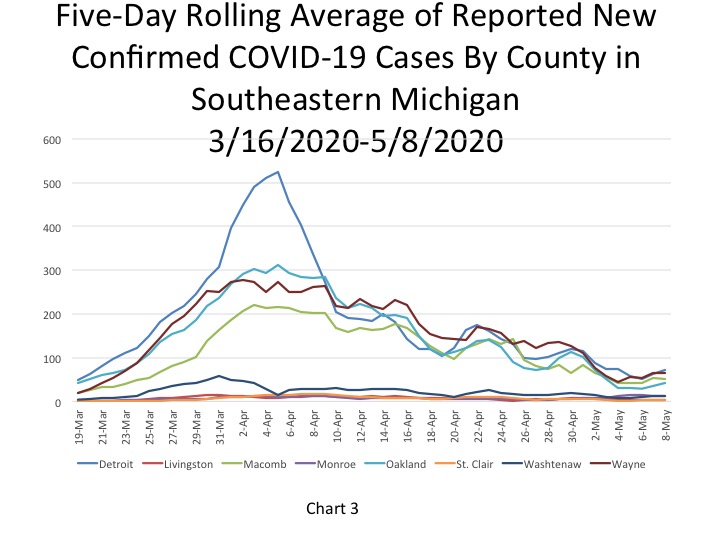
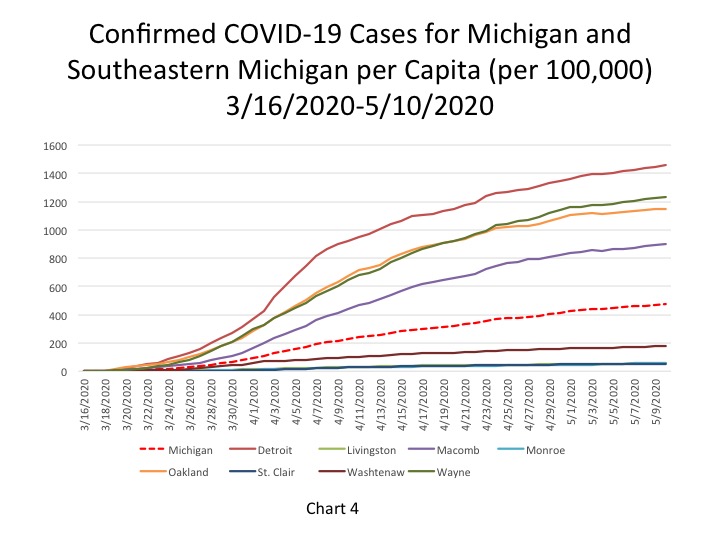
According to the State of Michigan, the total number of COVID cases in Michigan rose to 47,138, an increase of 382 cases from the previous day. This total was equivalent to 472 cases per 100,000 people (Chart 4) on May 10. The five-day rolling average for the total number of COVID cases (Chart 1) reflects a smoother curve and adjusts for fluctuations in testing and/or the quality of reporting or failure to report. That curve continues to trend upward, but the number of new COVID cases identified each day in Southeastern Michigan has been steadily decreasing for about a month. Detroit reported the highest number of daily cases at 72 on May 8 (Chart 3). Note that this five day rolling average causes these daily case and daily death charts to lag two days behind.
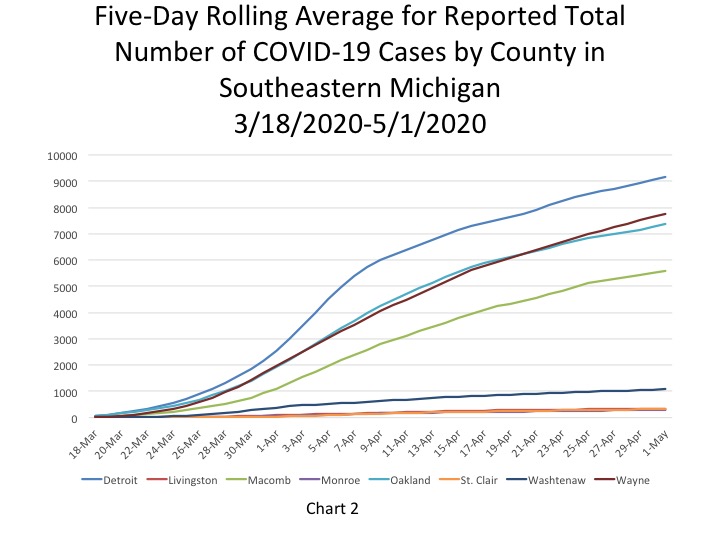
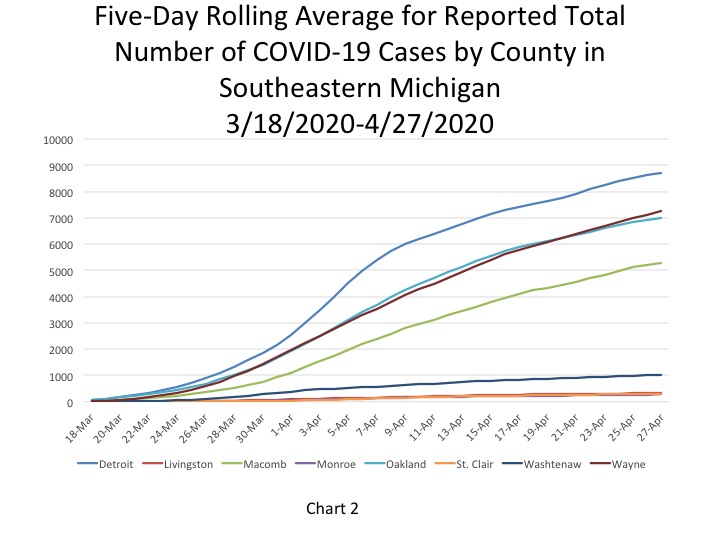
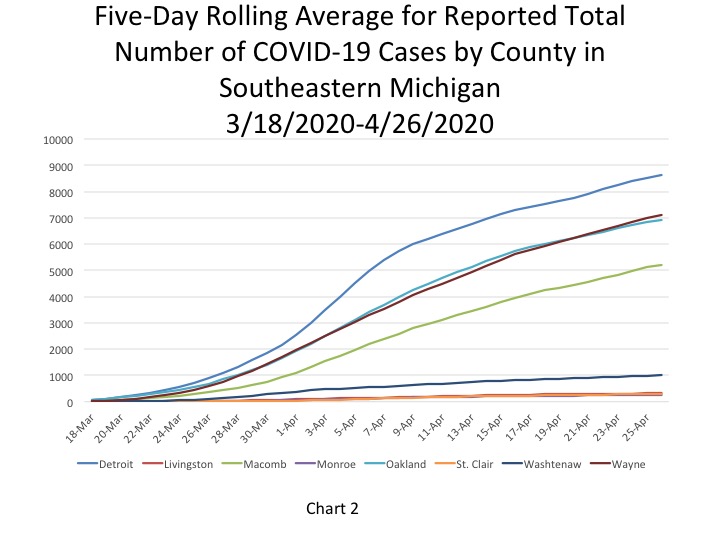
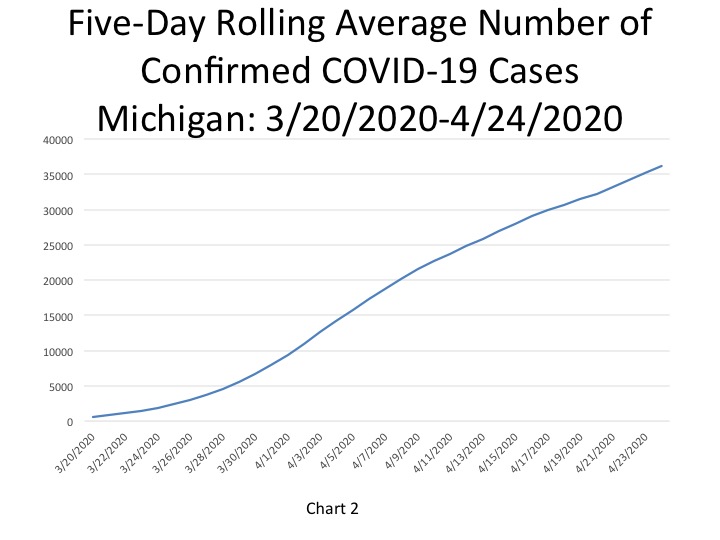
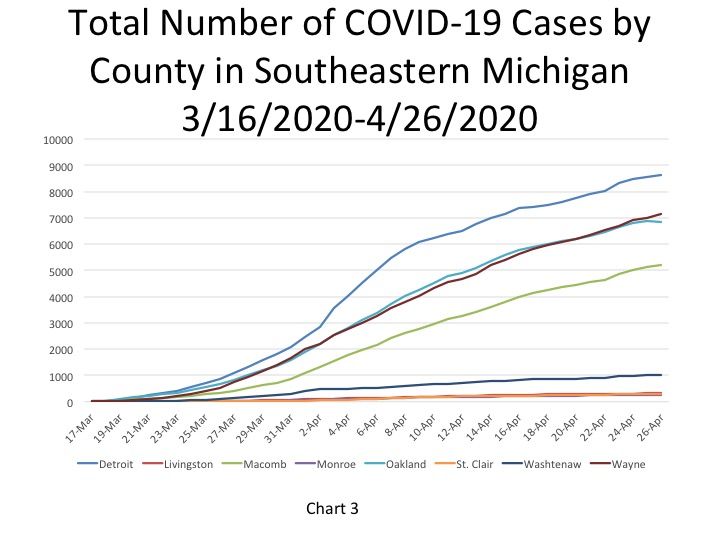
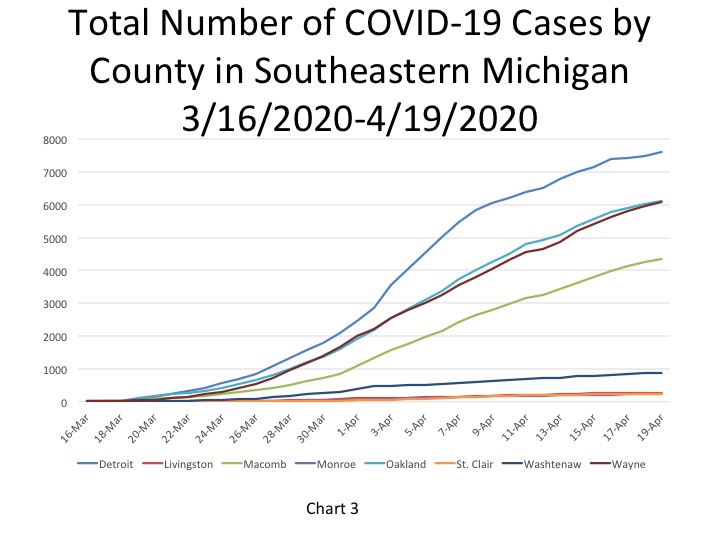
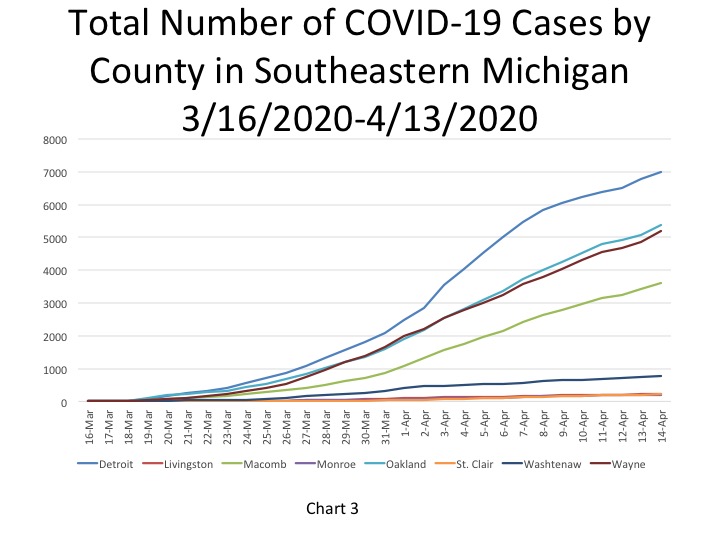
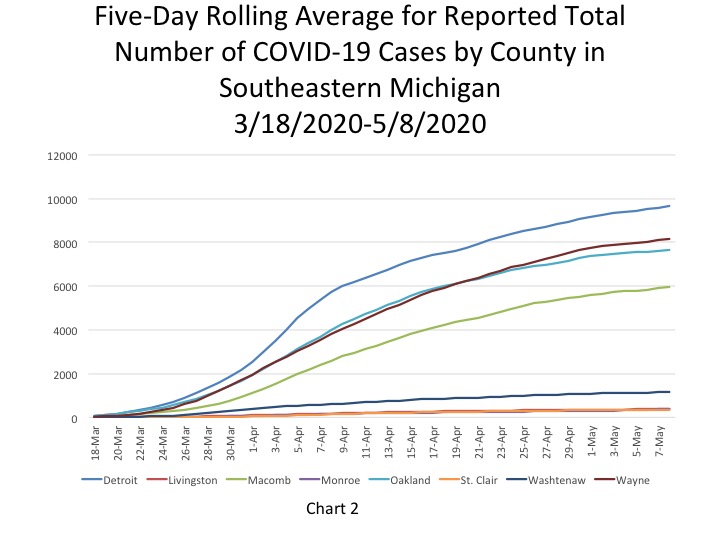
Chart 2 shows how that while the curve is flattening in Southeastern Michigan, based on the five-day rolling averages, there are still small increases in the total number of COVID cases in Southeastern Michigan. The number of cumulative COVID cases remains the highest in Detroit at 9,649 on May 8, with Wayne County following at a reported 8,170 cases. On May 8, the five-day rolling average for the number of COVID cases in Oakland County was 7,658, and Macomb County reported 5,946.
The daily data highlighted in these posts is from Michigan.gov/coronavirus, where data is updated daily at 3 p.m. Historical data were supplied from covidtracking.com, which republishes COVID data from the State.
The City of Detroit had 1,455 COVID cases per 100,000 people on May 10, an increase from 1,443 the day before (Chart 4). This is based upon a reported increase of 77 new cases, bringing the total number of COVID cases in Detroit to 9,786. Wayne County reported 1,232 cases per 100,000 people, and Oakland County had 1,150 cases per 100,000 people. These per capita rates were based upon 8,289 total cases for Wayne and 7,736 for Oakland. Macomb County reported 898 cases per 100,000 people, which is based upon 6,042 cases.
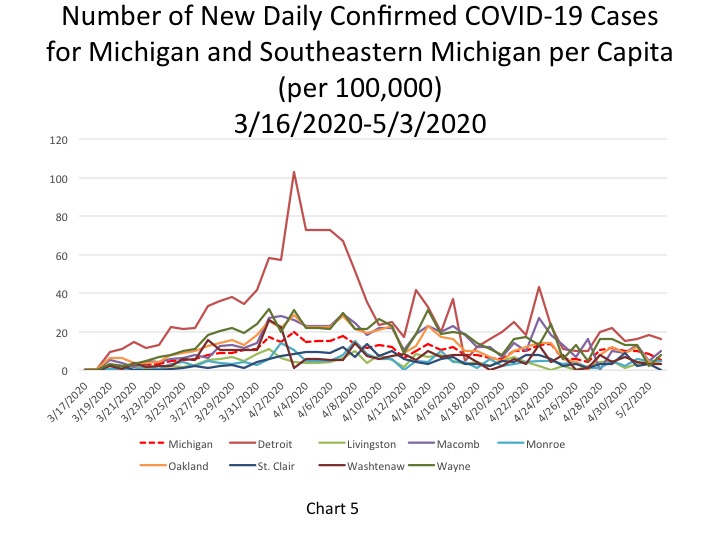
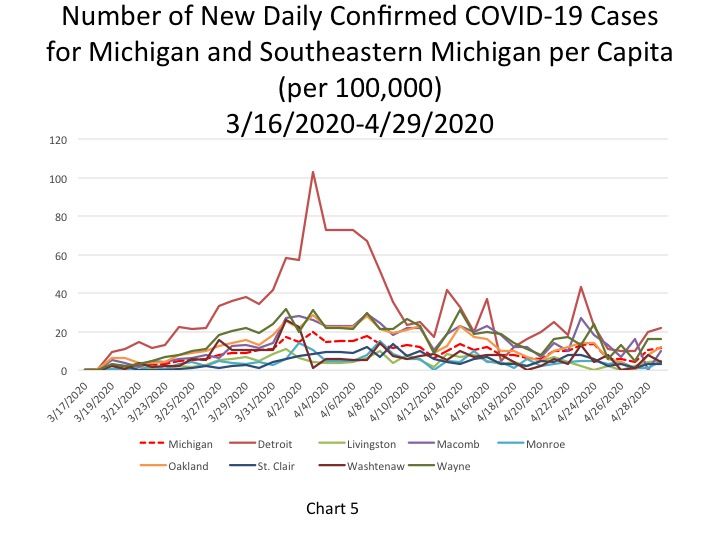
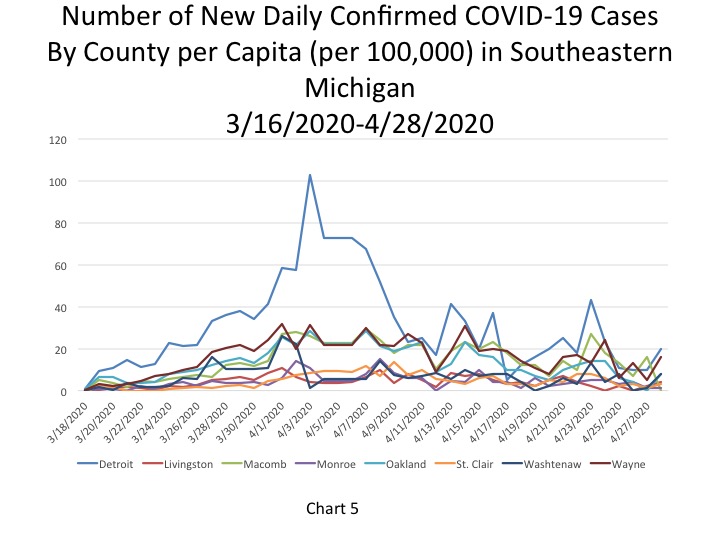
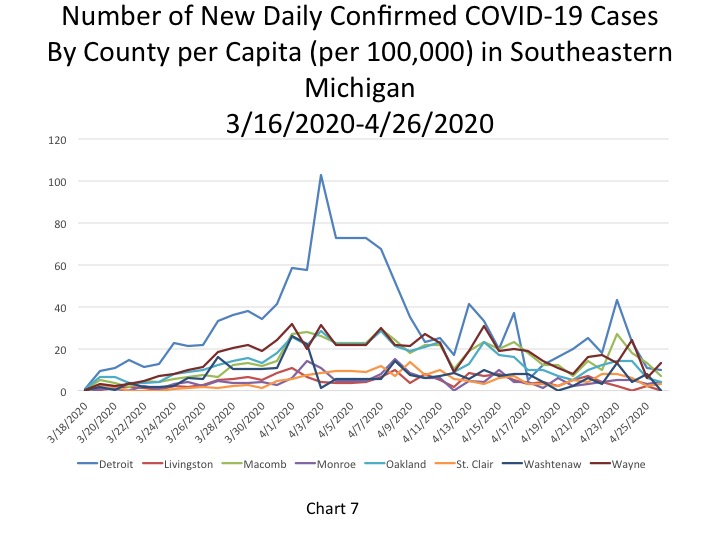
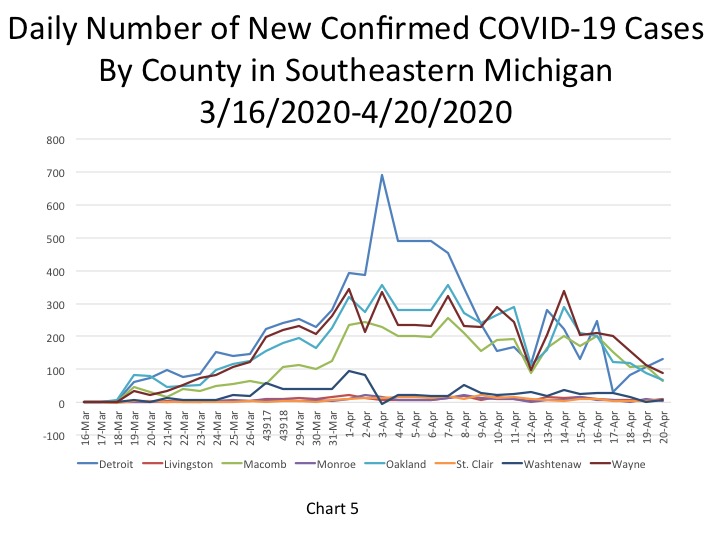
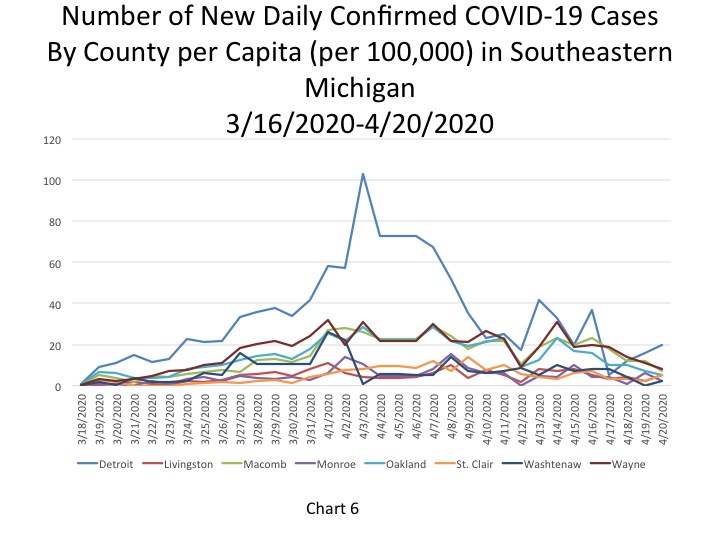
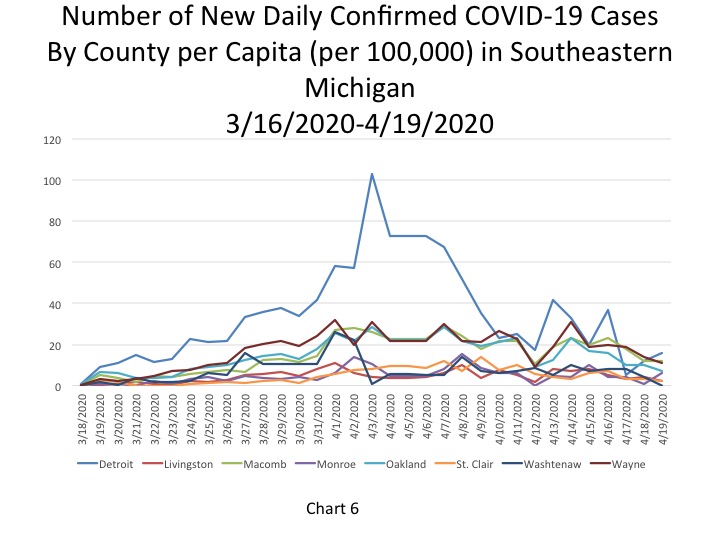
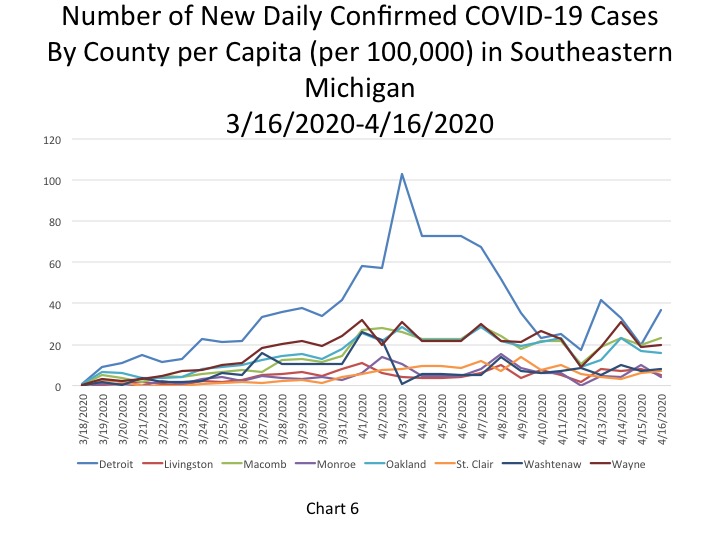
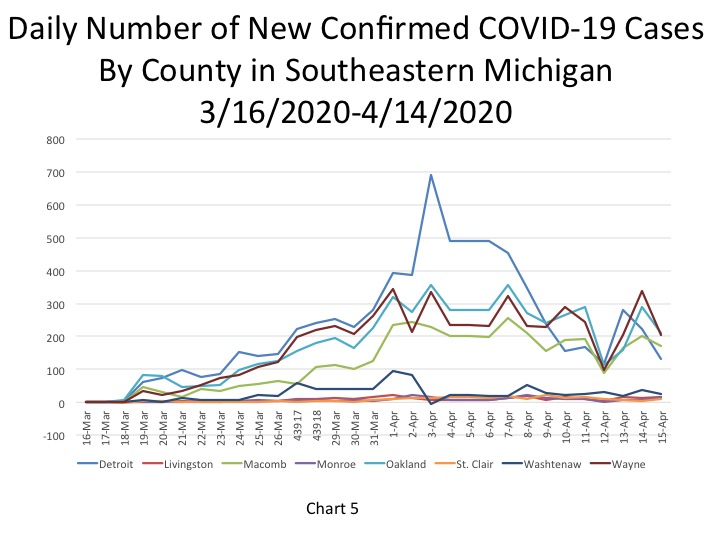
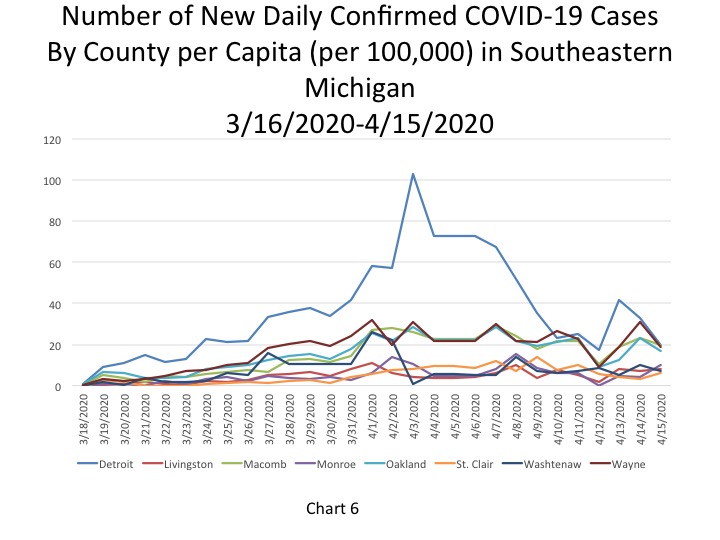
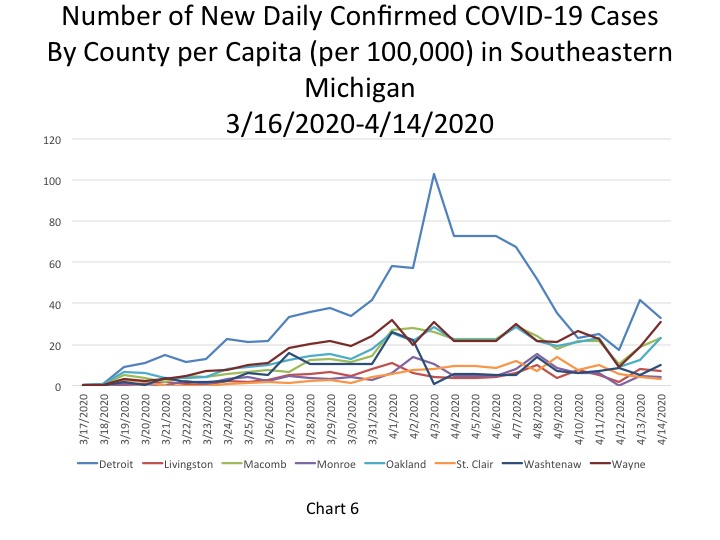
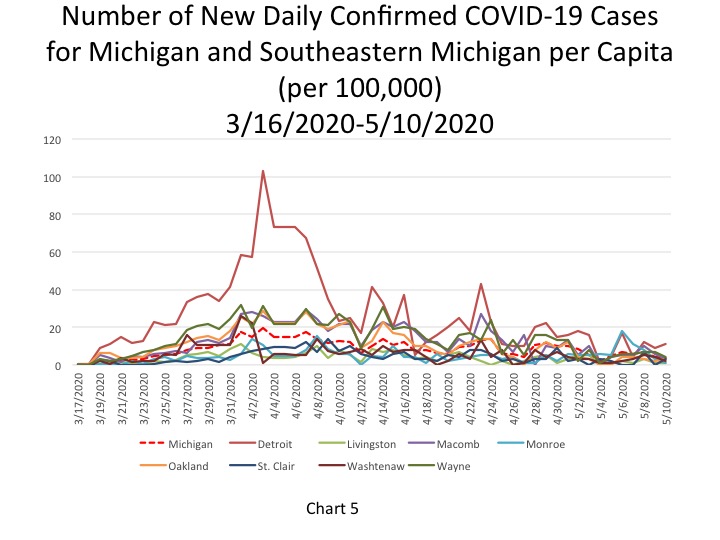
Chart 5 shows that the per capita rate for the number of new daily COVID cases per 100,000 people remained fairly stable for Detroit over the last few days. Detroit’s rate was reported at 11 new daily COVID cases per 100,000 people on May 10 (equal to 77 new cases), an increase from 9 the day before. Oakland and St. Clair counties were the only other two government entities that reported a rate increase between May 9 and May 10; both entities reported per capita rates of 3 new cases per 100,000 people. Oakland County reported 44 new COVID cases on May 10 while St. Clair County reported 4 new cases. Wayne County reported a per capita rate of 4 new cases per 100,000 people on May 10, which was equivalent to 38 new cases, and Macomb County reported a rate of 3, which was equivalent to 23 new cases. Over the weekend (May 9 and 10) the 77 new cases Detroit reported on May 10 was the highest number across these local governments.
The State’s per capita rate was 3.8 new cases per 100,000 people, equivalent to 382 new cases. In total, of the 680 new cases, Southeastern Michigan accounted for 195 of them.
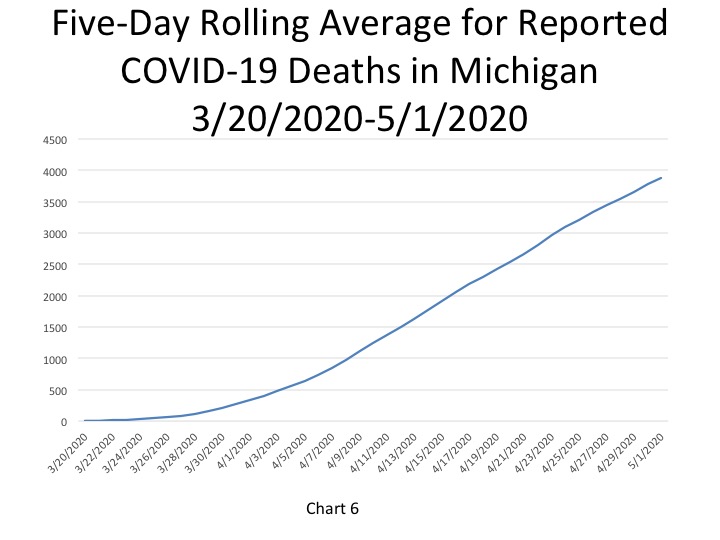
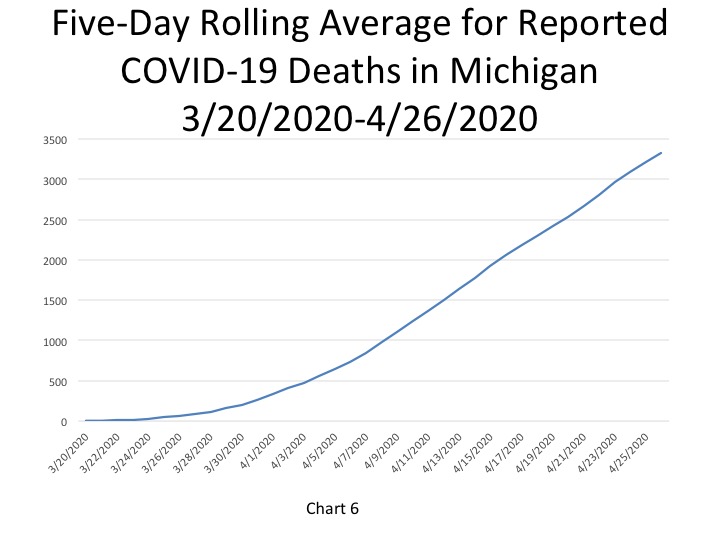
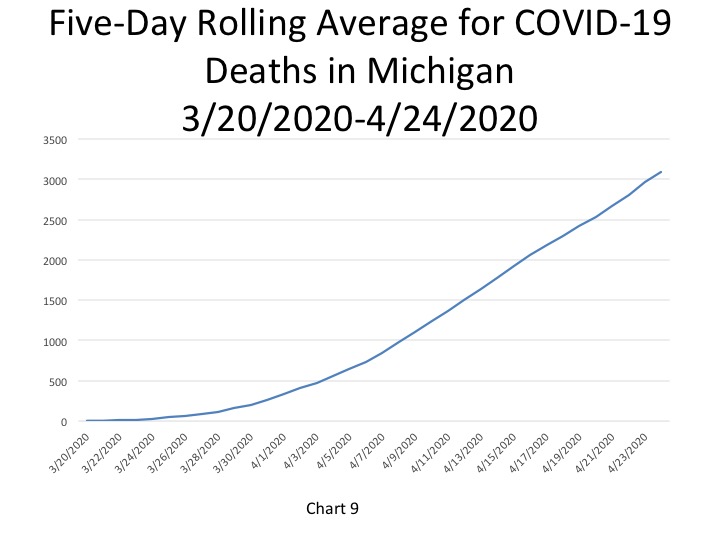
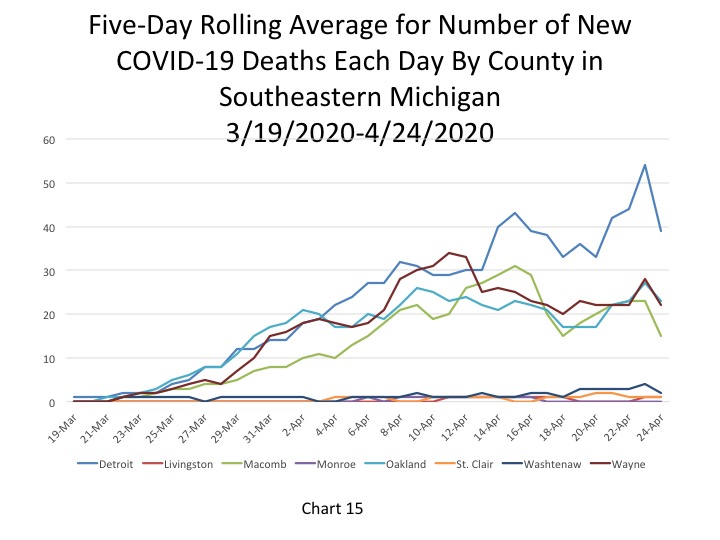
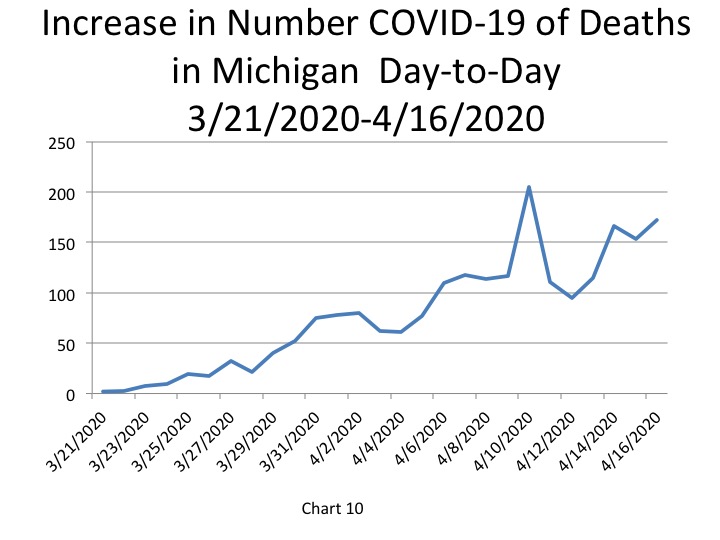
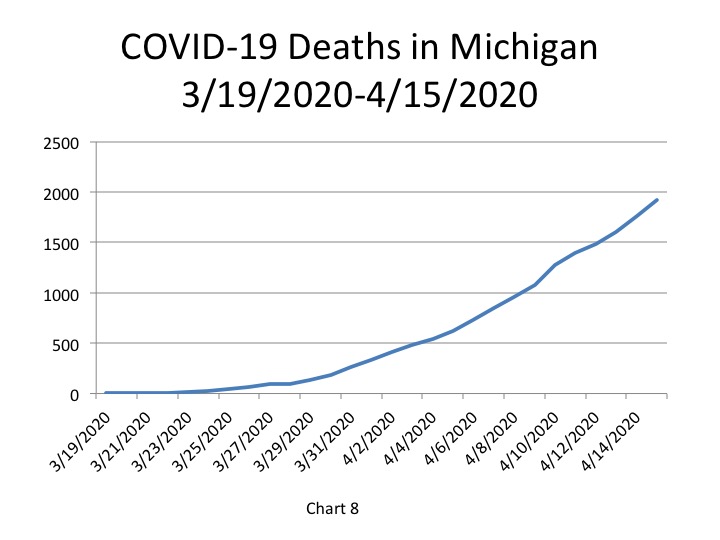
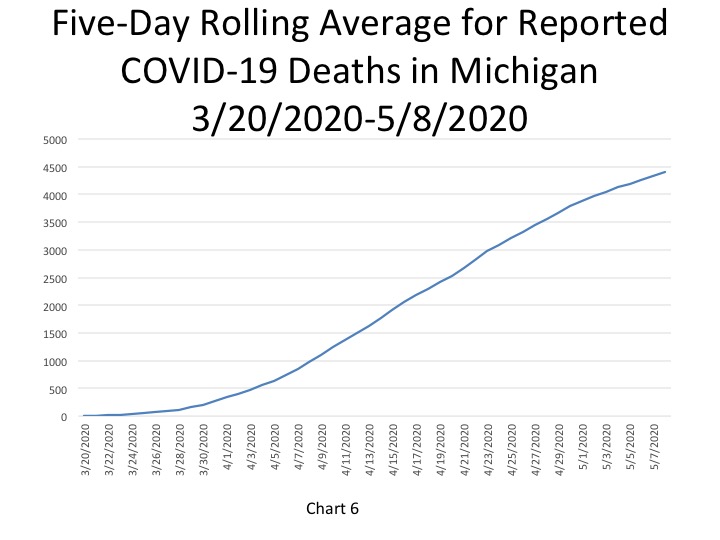
In Chart 6 the five-day rolling average for the number of deaths shows a continuing steady increase (a lagged number of 4,413 deaths, an increase of 74 deaths). The actual reported COVID-19 deaths reached 4,551 on May 10, an increase of 25 deaths from the day prior. Of those 25 daily deaths reported on May 10, 18 were in Southeastern Michigan. Overall, the 25 daily deaths reported on May 10 is the lowest number that has been reported in the State since March. On May 9 the State reported 133 additional deaths, however 67 of those were added to the May 9 total as a result of comparing death certificates and the State’s COVID database. The number of additional COVID deaths reported on Sunday was a substantial decrease in reported daily deaths. We hope that this is a trend that will continue, however recently COVID data reported to the State over the weekend is lower than what is reported during the week.
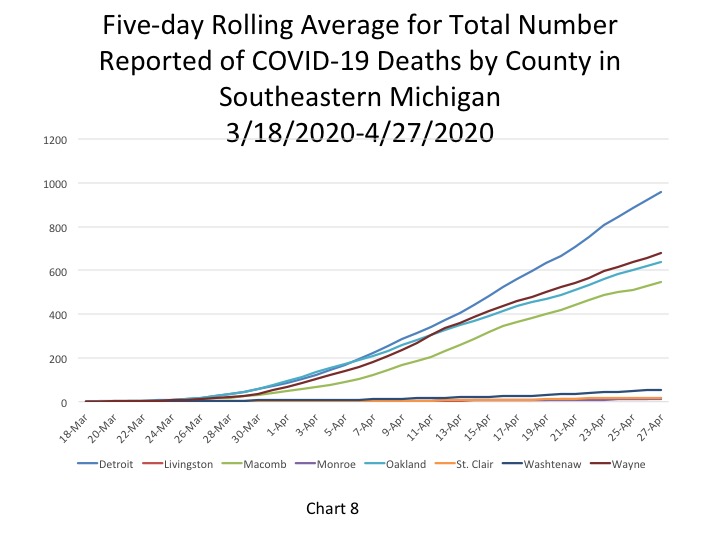
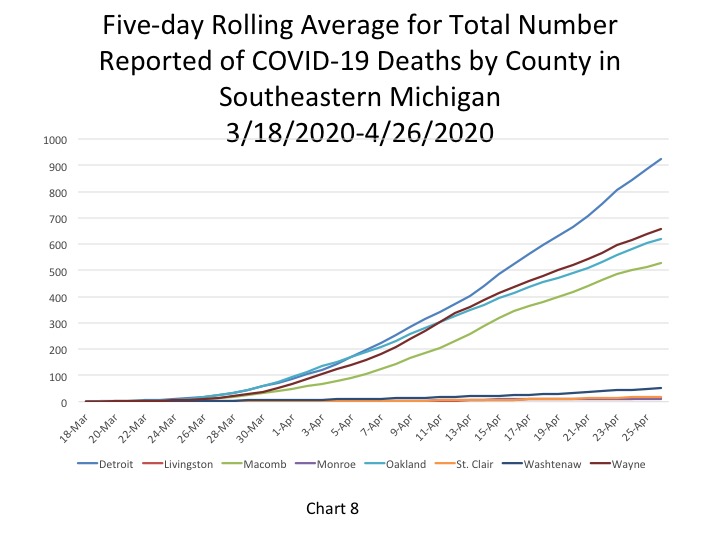
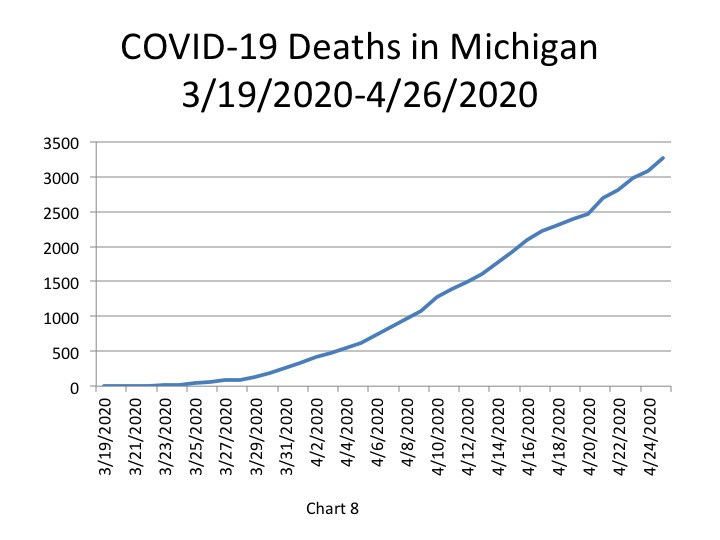
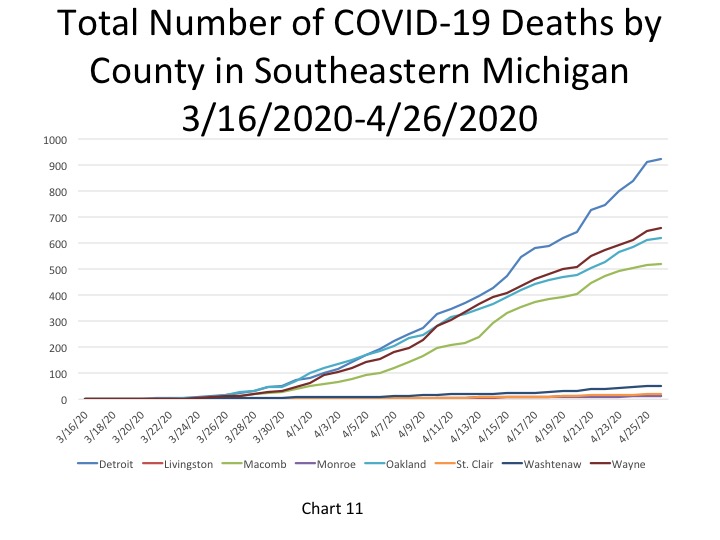
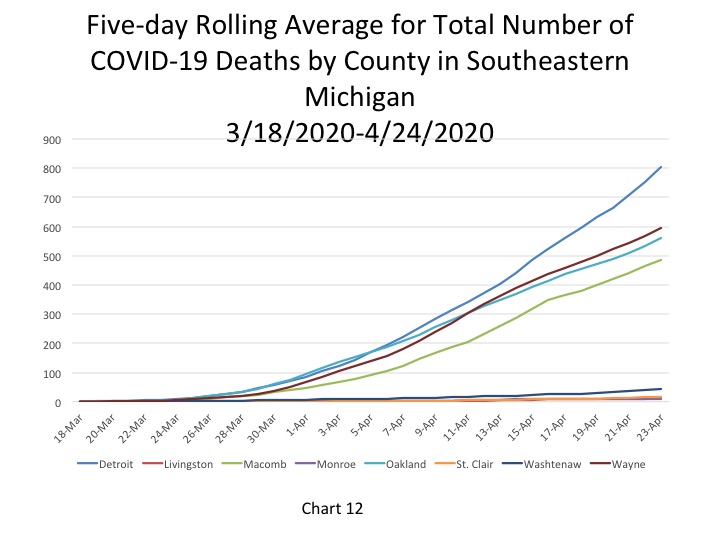
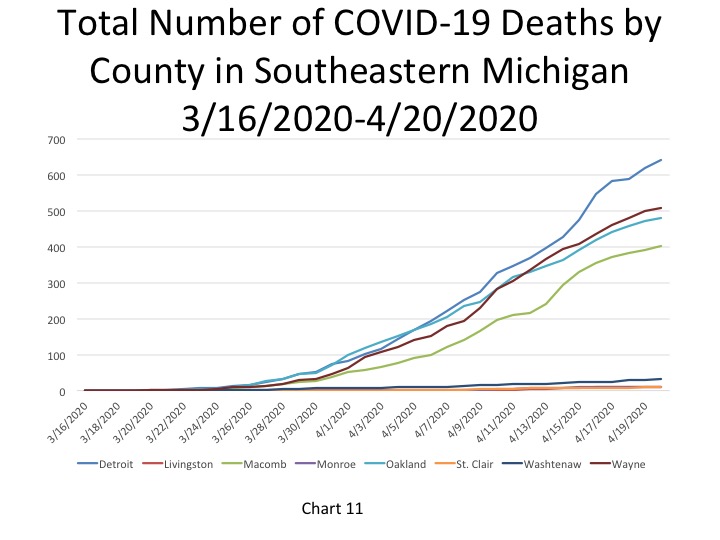
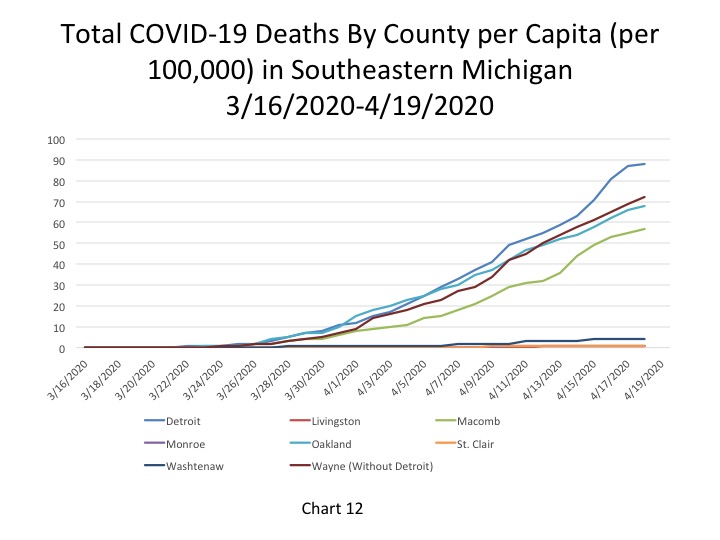
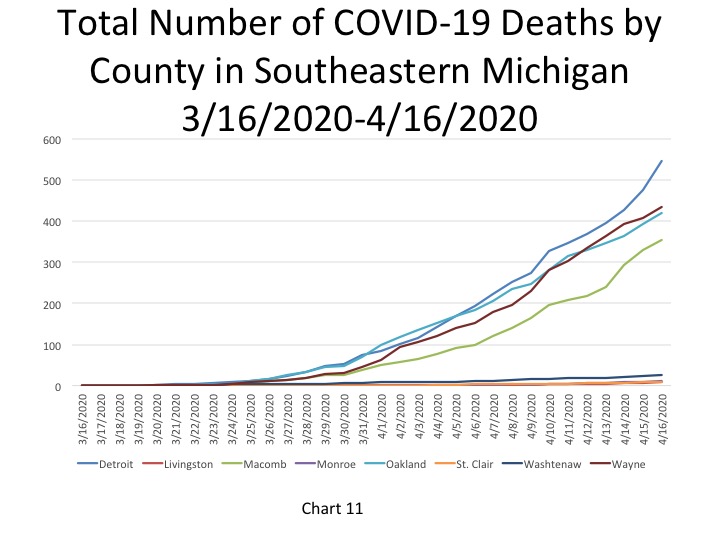
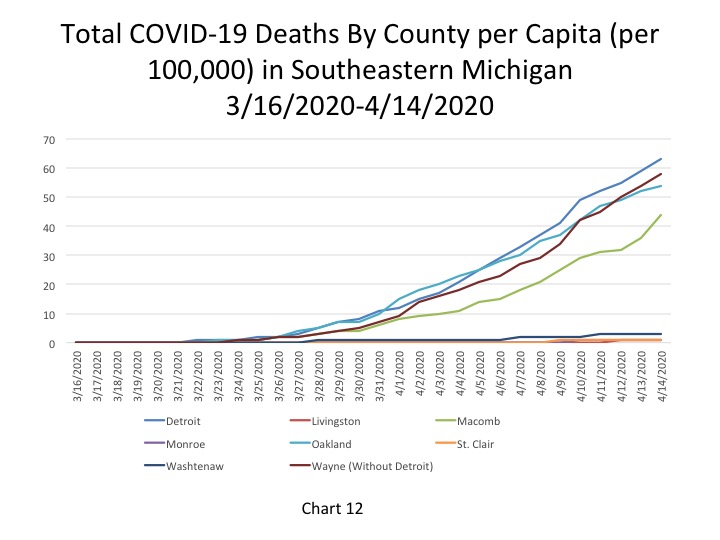
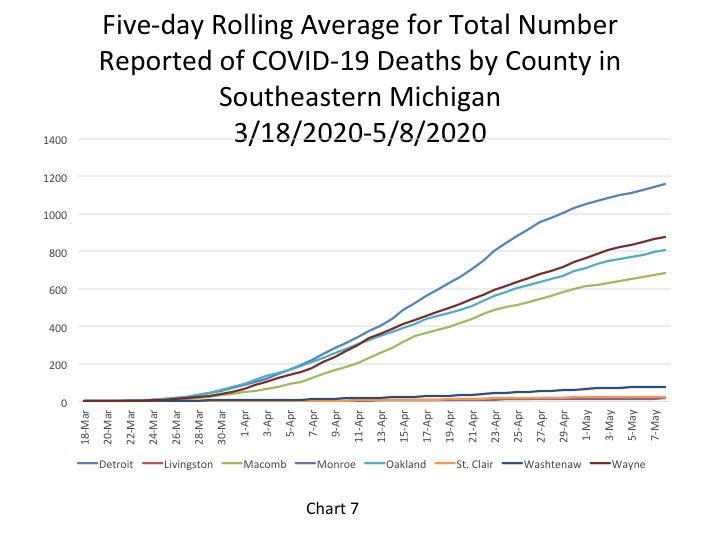
Chart 7 portrays how the total number of COVID deaths in Southeastern Michigan continues to increase, but that rate has been gradually declining overall, showing that the curve is slowly starting to flatten. The rate at which the number of deaths is increasing in Detroit and Wayne and Oakland counties has been hovering in the mid-teens for the last several days. Detroit continues to have the highest cumulative number of COVID deaths though, inching toward 1,200.
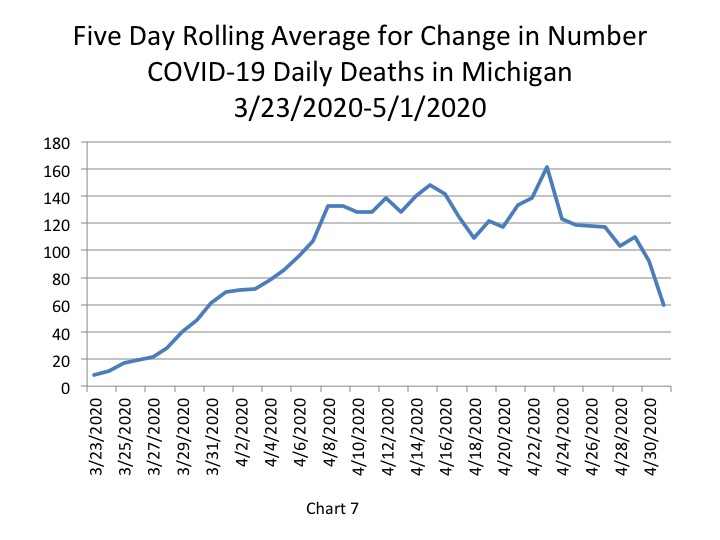
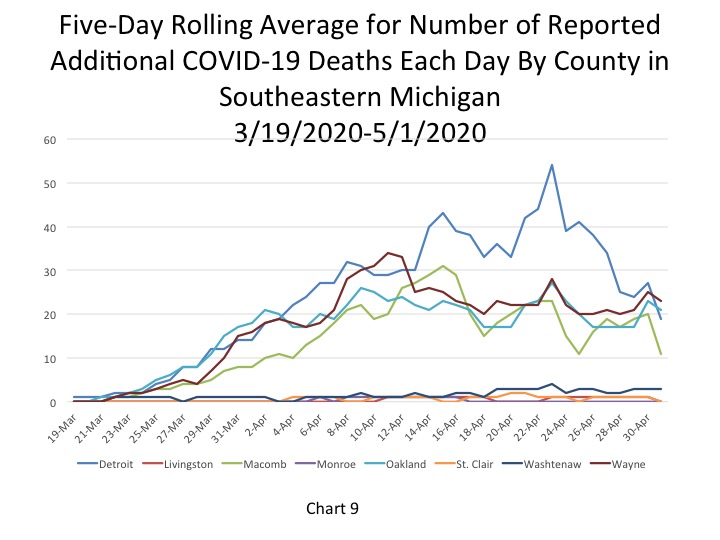
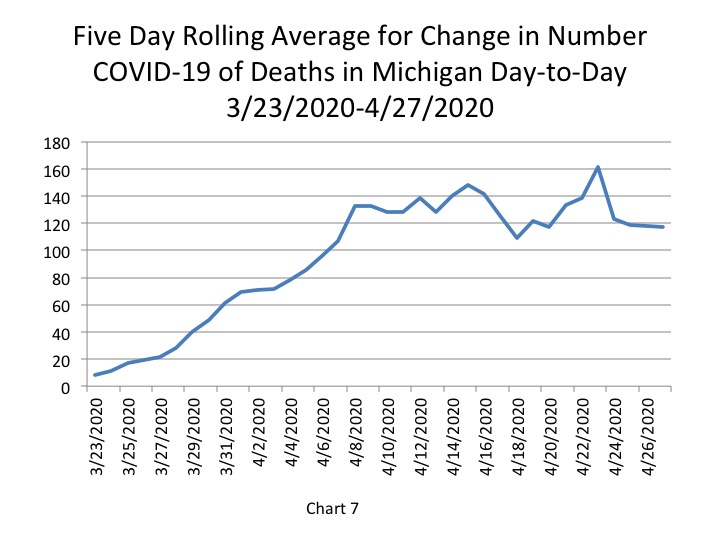
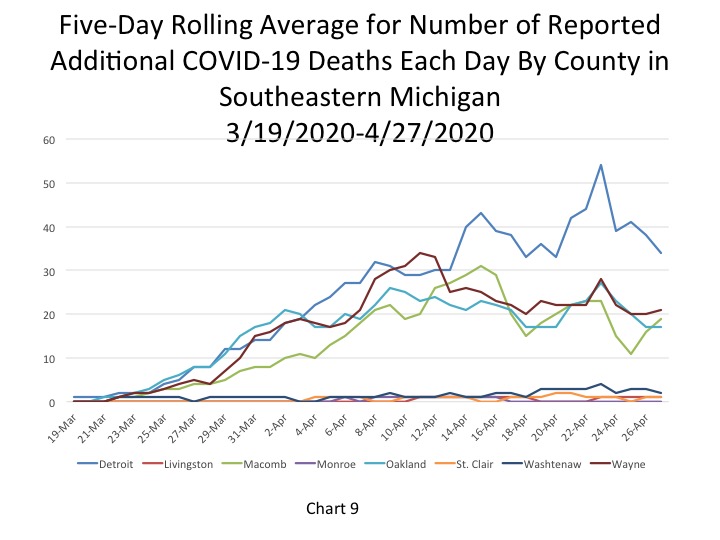
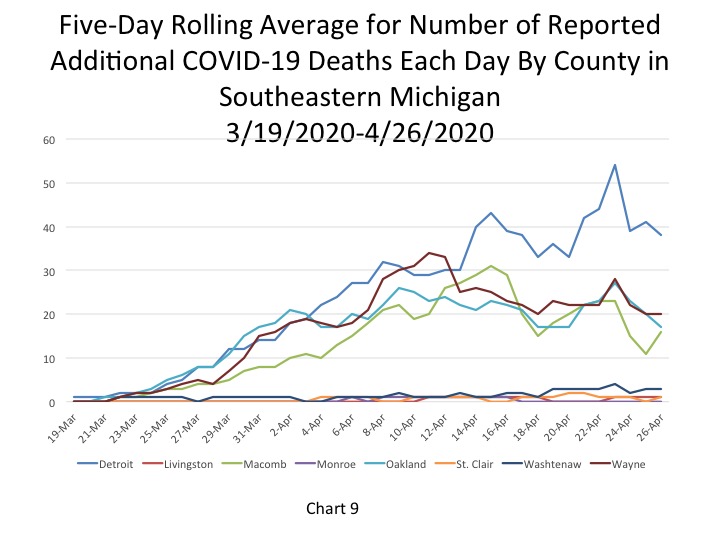
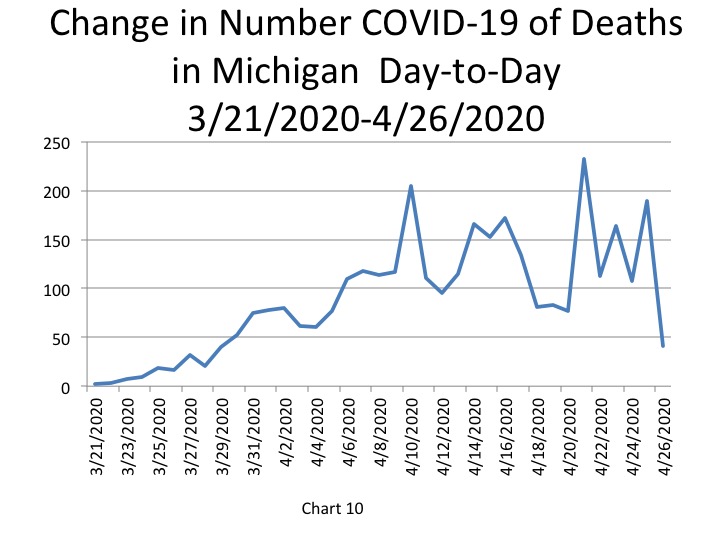
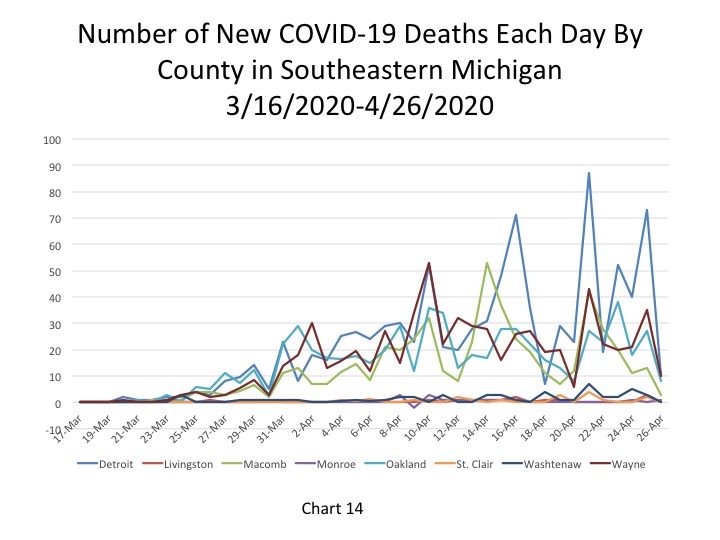
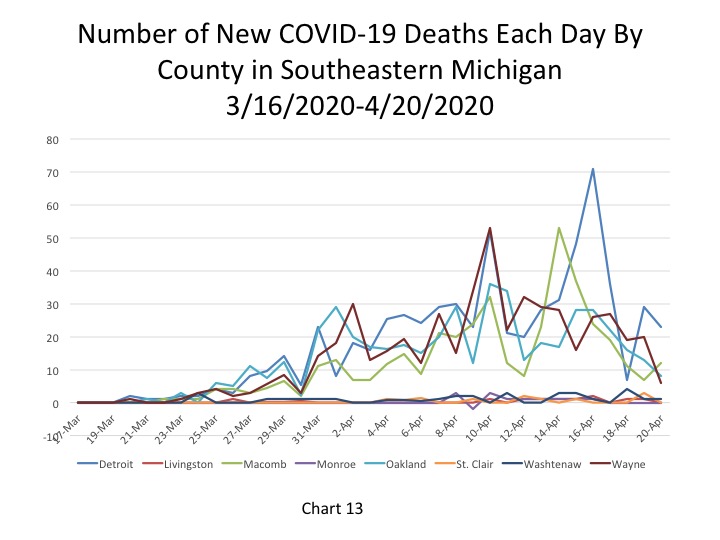
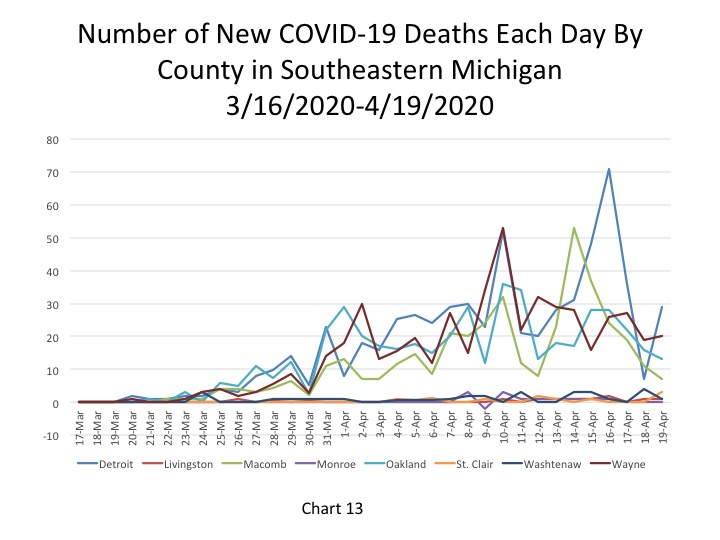
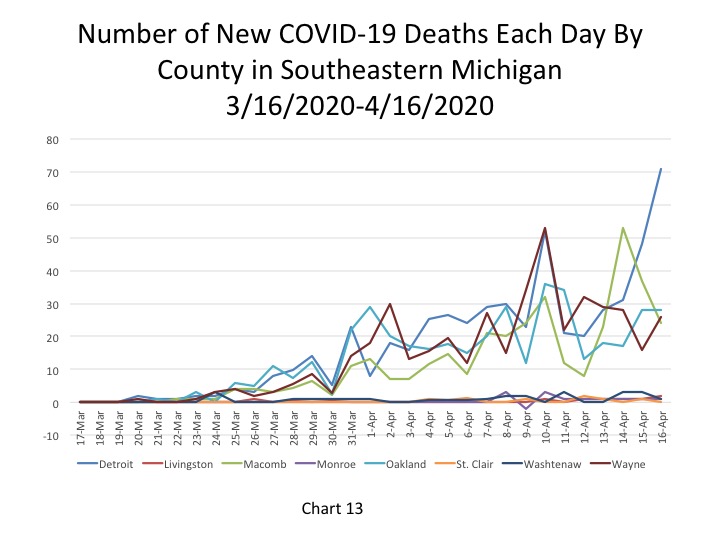
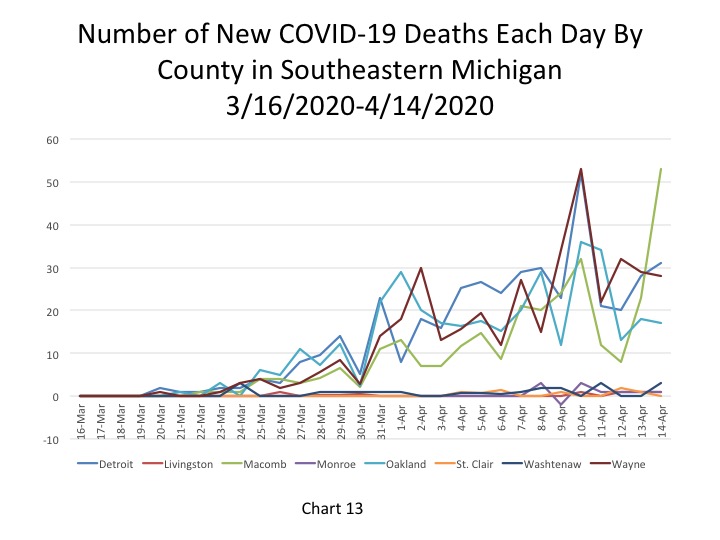
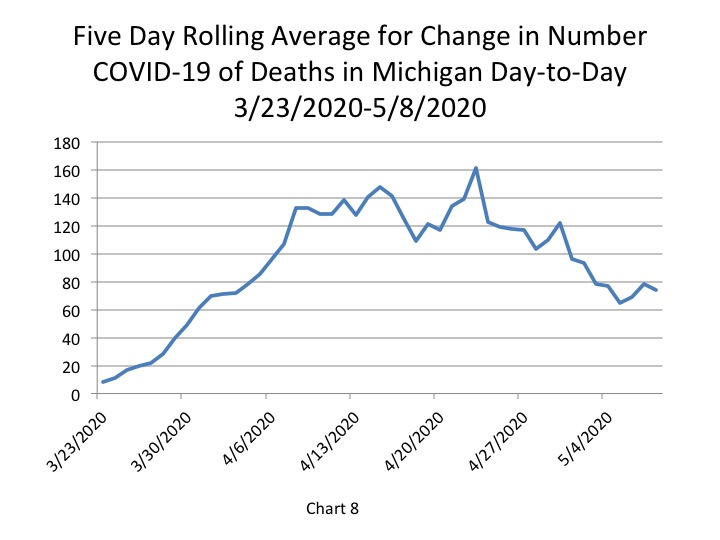
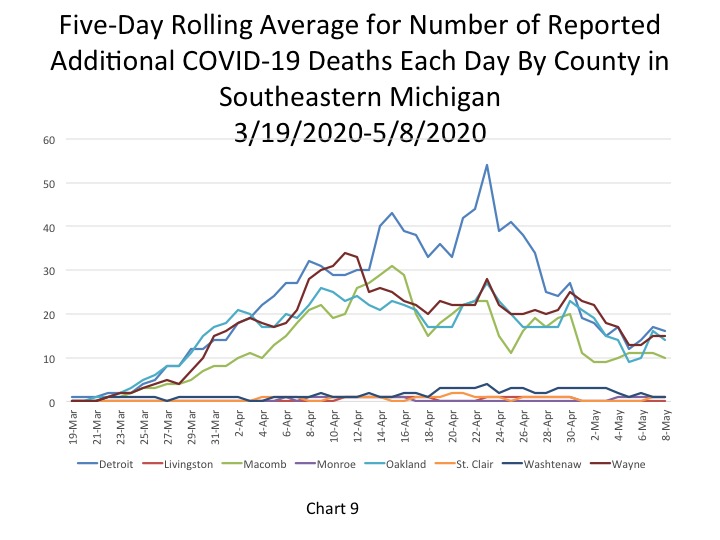
Chart 8 shows that the number of daily deaths in Michigan continues to decline overall, despite a small uptick late last week. On May 8 though the numbers decreased again. Chart 9 shows that Detroit and Oakland and Macomb counties contributed to the decrease in the total number of daily deaths in Michigan. Detroit reported 16 daily deaths, while Oakland County reported 14 additional deaths and Macomb reported 10. None of those entities reported a decline of more than 2 deaths from the day prior. Aside from those three entities, the other five counties in Southeastern Michigan reported the same number of additional deaths as the day prior, further showing that the curve is in fact flattening.
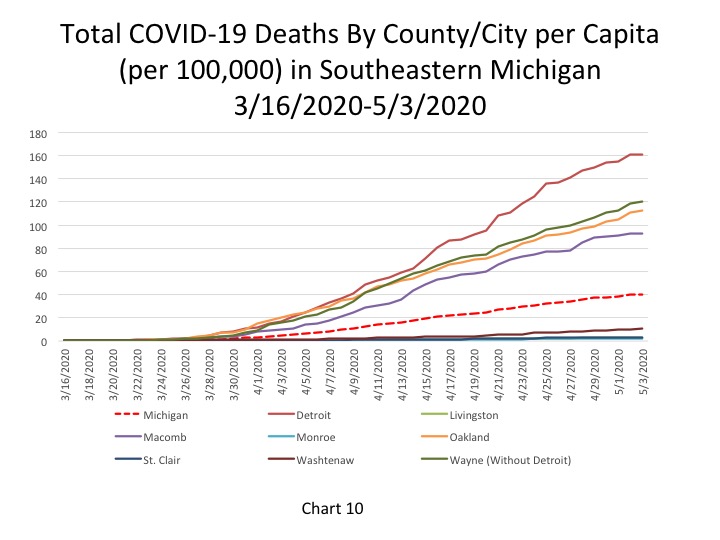
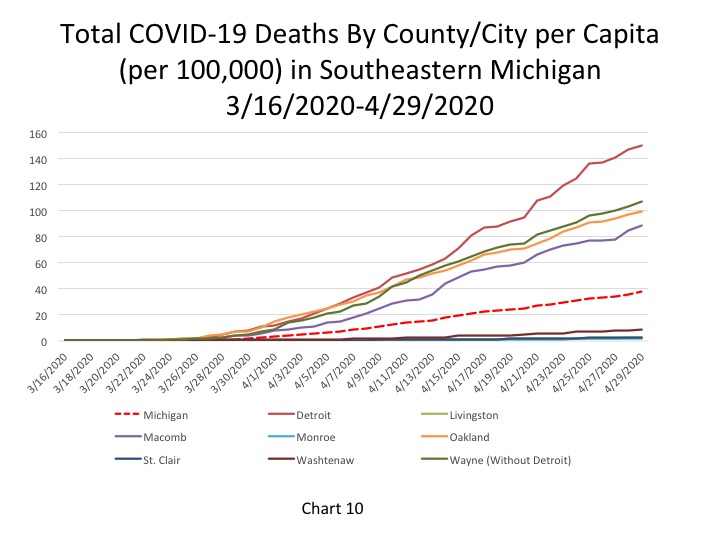
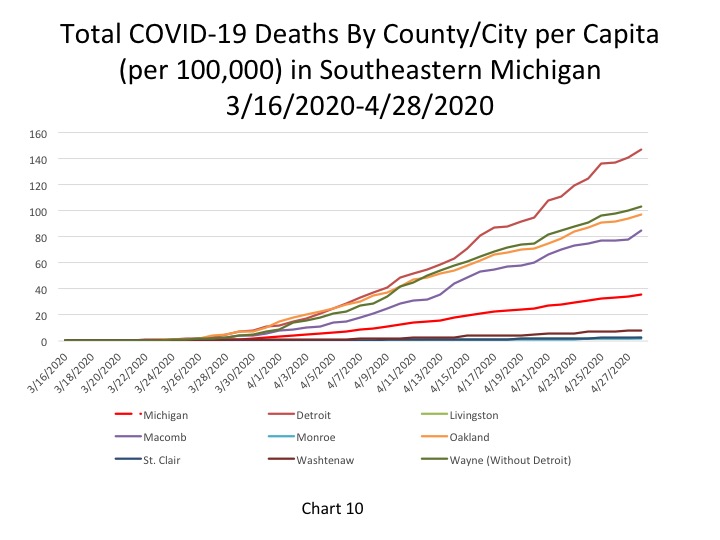
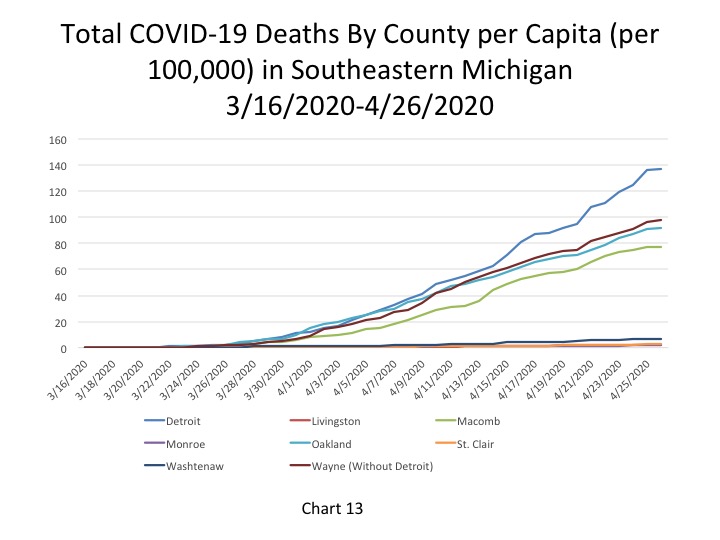
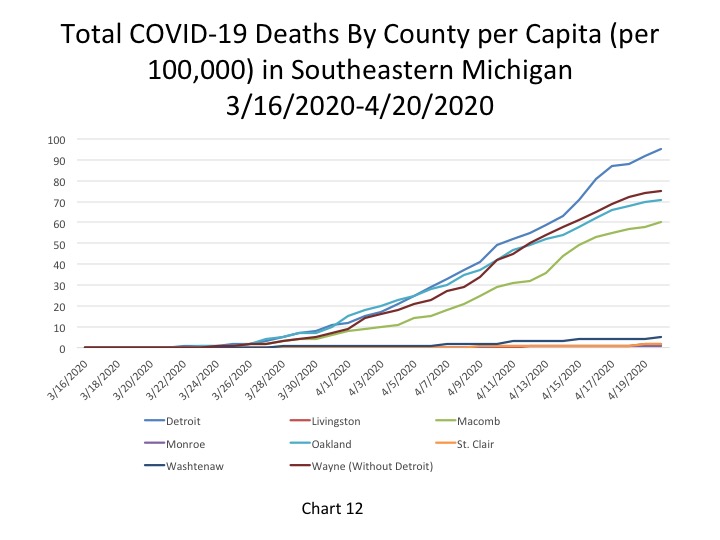
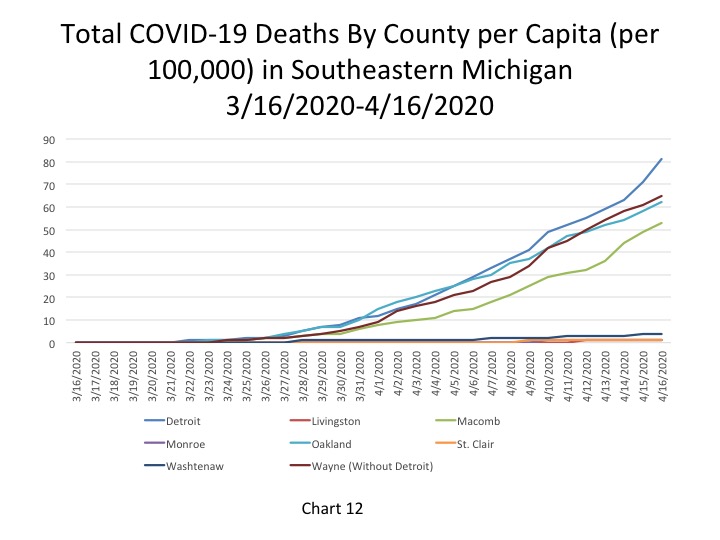
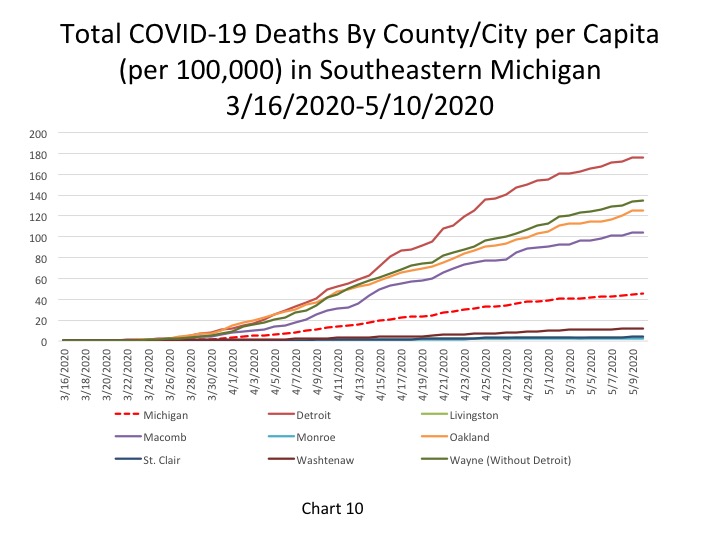
Chart 10 portrays the total number of COVID deaths per 100,000 people. As of May 10, the cumulative total of COVID deaths per 100,000 people in Detroit was 176 (representing 1,187 deaths). In Wayne County there were 135 COVID deaths per 100,000 people (910 total deaths), in Oakland County there were 125 deaths per 100,000 people (843 total deaths), and in Macomb County there were 104 COVID deaths per 100,000 people (698 total).
The State of Michigan had 45 COVID deaths per 100,000 people, a rate that continues to remain lower than the four entities discussed above.
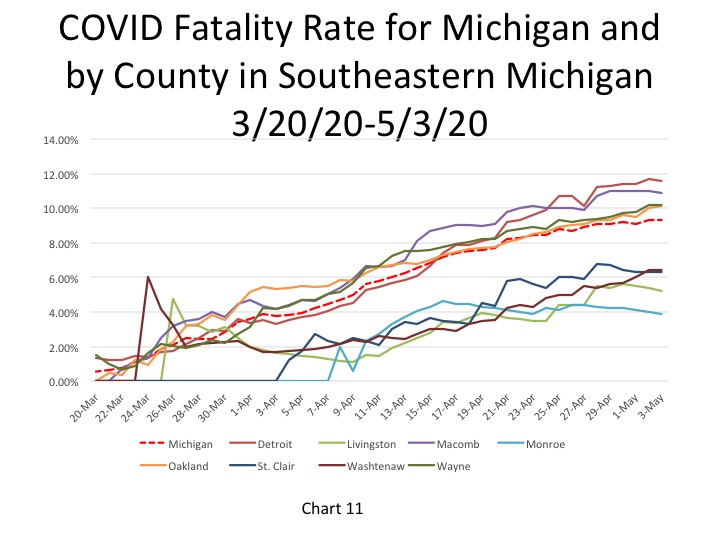
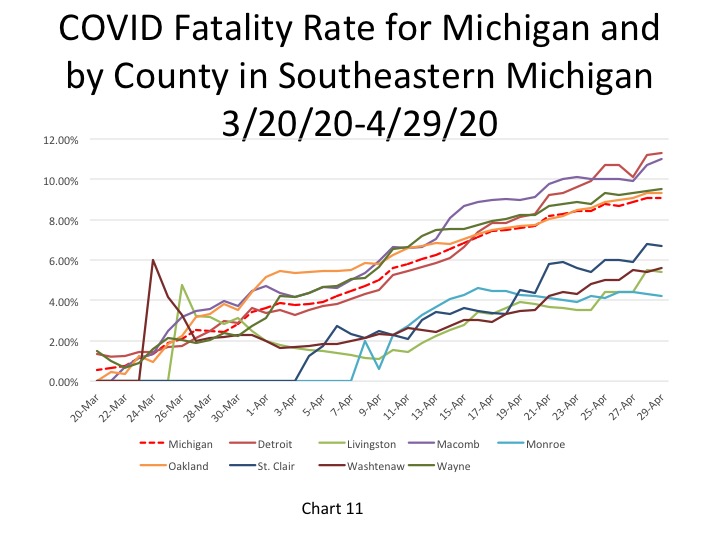
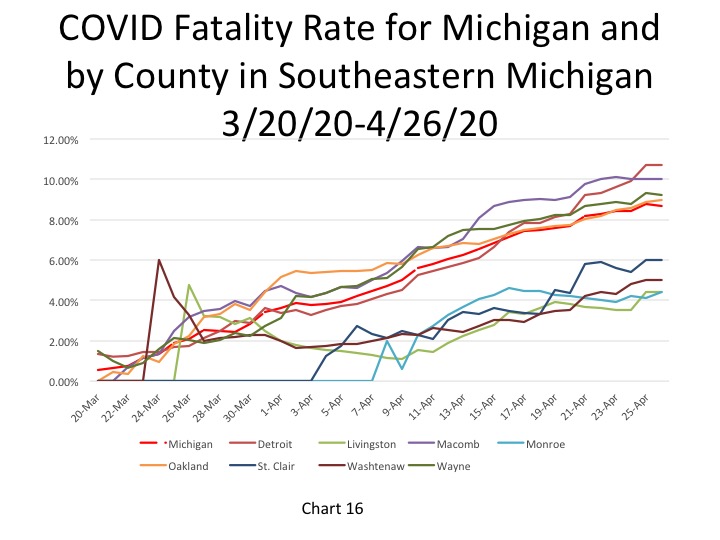
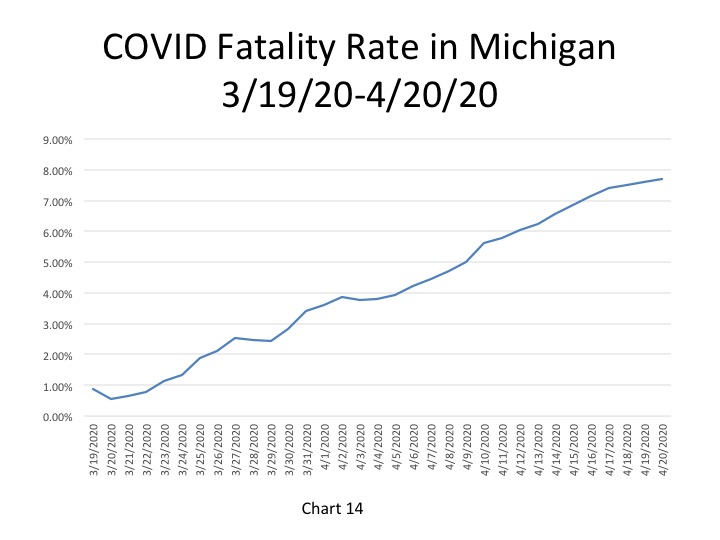
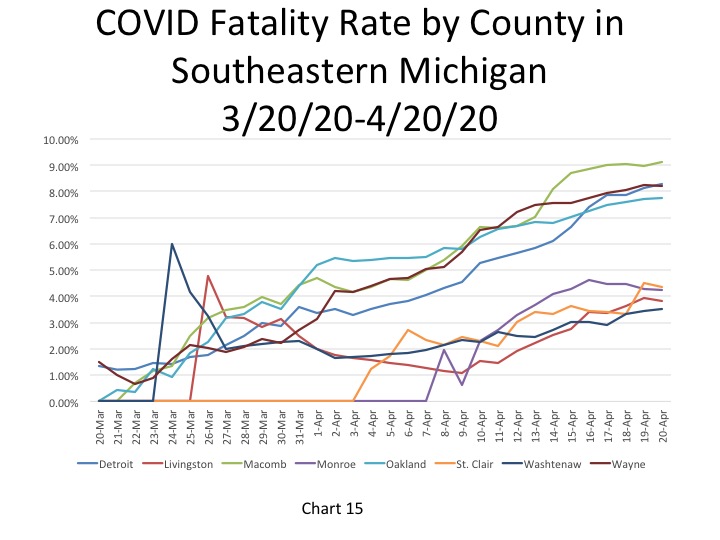
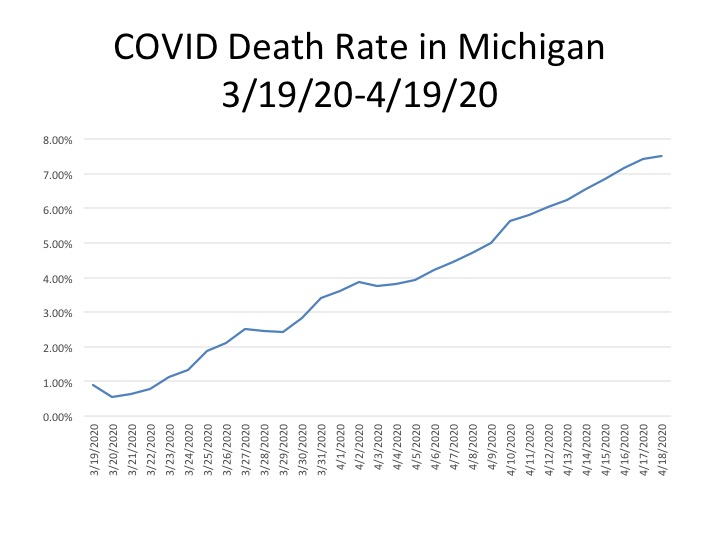
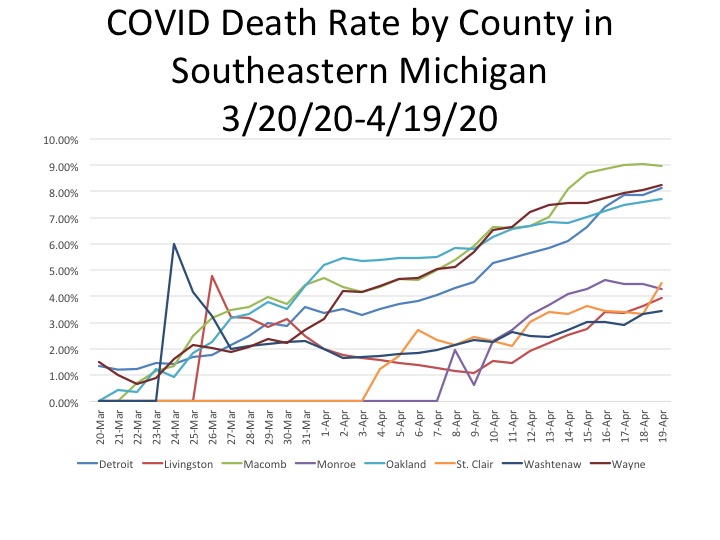
The fatality rate for Detroit and Macomb, Oakland and Macomb counties reached 11 percent or higher on May 10, with Detroit having the highest rate at 12.2 percent. The State’s fatality rate also gradually increased to 9.7 percent.
One reason we may be seeing such high fatality rates in Michigan is due to the low testing rates. When only having-presumably-a lower of number confirmed COVID cases than is actually likely due to the limited availability of tests, the fatality rate appears higher because the base comparison is smaller than it might be.

While the State reported its lowest number of daily deaths since March on May 10 (25), it also reported that 22,686 people have recovered from the virus. These statistics coupled with the fact that the curves for the total number of COVID cases and deaths are flattening show signs that we are beginning to overcome the virus. However, the key word is beginning. Many of those who have been deemed as “recovered” are still battling longer-term affects from the virus, according to a recent Free Press article. Additionally, just because the curve is flattening now doesn’t mean there won’t be another spike in cases and deaths in the future. This could very easily happen if the Stay-at-Home order is broken too soon or people begin to disregard other health recommendations, such as wearing a mask in public and/or congregating in groups. Ultimately, the risk of community spread for the virus remains high and the long-term effects once someone is infected still remain fairly unknown. This is why we must continued to heed the recommendations set forth by the Centers for Disease Control and the State.